
Since Bitcoin (BTC) hit a six-month low on August 5 during the broader market downturn, it has seen a modest rise in demand, forming an ascending triangle pattern.
Currently trading at $60,940, the leading cryptocurrency has rebounded by 13% from its August 5 low of $54,018.
Bitcoin Seeks to Break Above Resistance
An ascending triangle is a bullish chart pattern that forms when an asset’s price moves between a flat horizontal resistance line and a rising support line. This pattern signals growing buying pressure while selling activity remains concentrated at a specific price level. As demand increases, the price edges closer to breaking the resistance.
For Bitcoin, the key resistance level within this pattern is $61,845. Currently trading at $60,940, BTC is attempting to break above this resistance, indicating that buyers may soon overcome selling pressure, potentially pushing the price higher.
The Chaikin Money Flow (CMF) indicator supports this outlook. With a reading of 0.01, the CMF has moved above the zero line for the first time since August 13, reflecting increasing capital inflows that strengthen the bullish momentum.
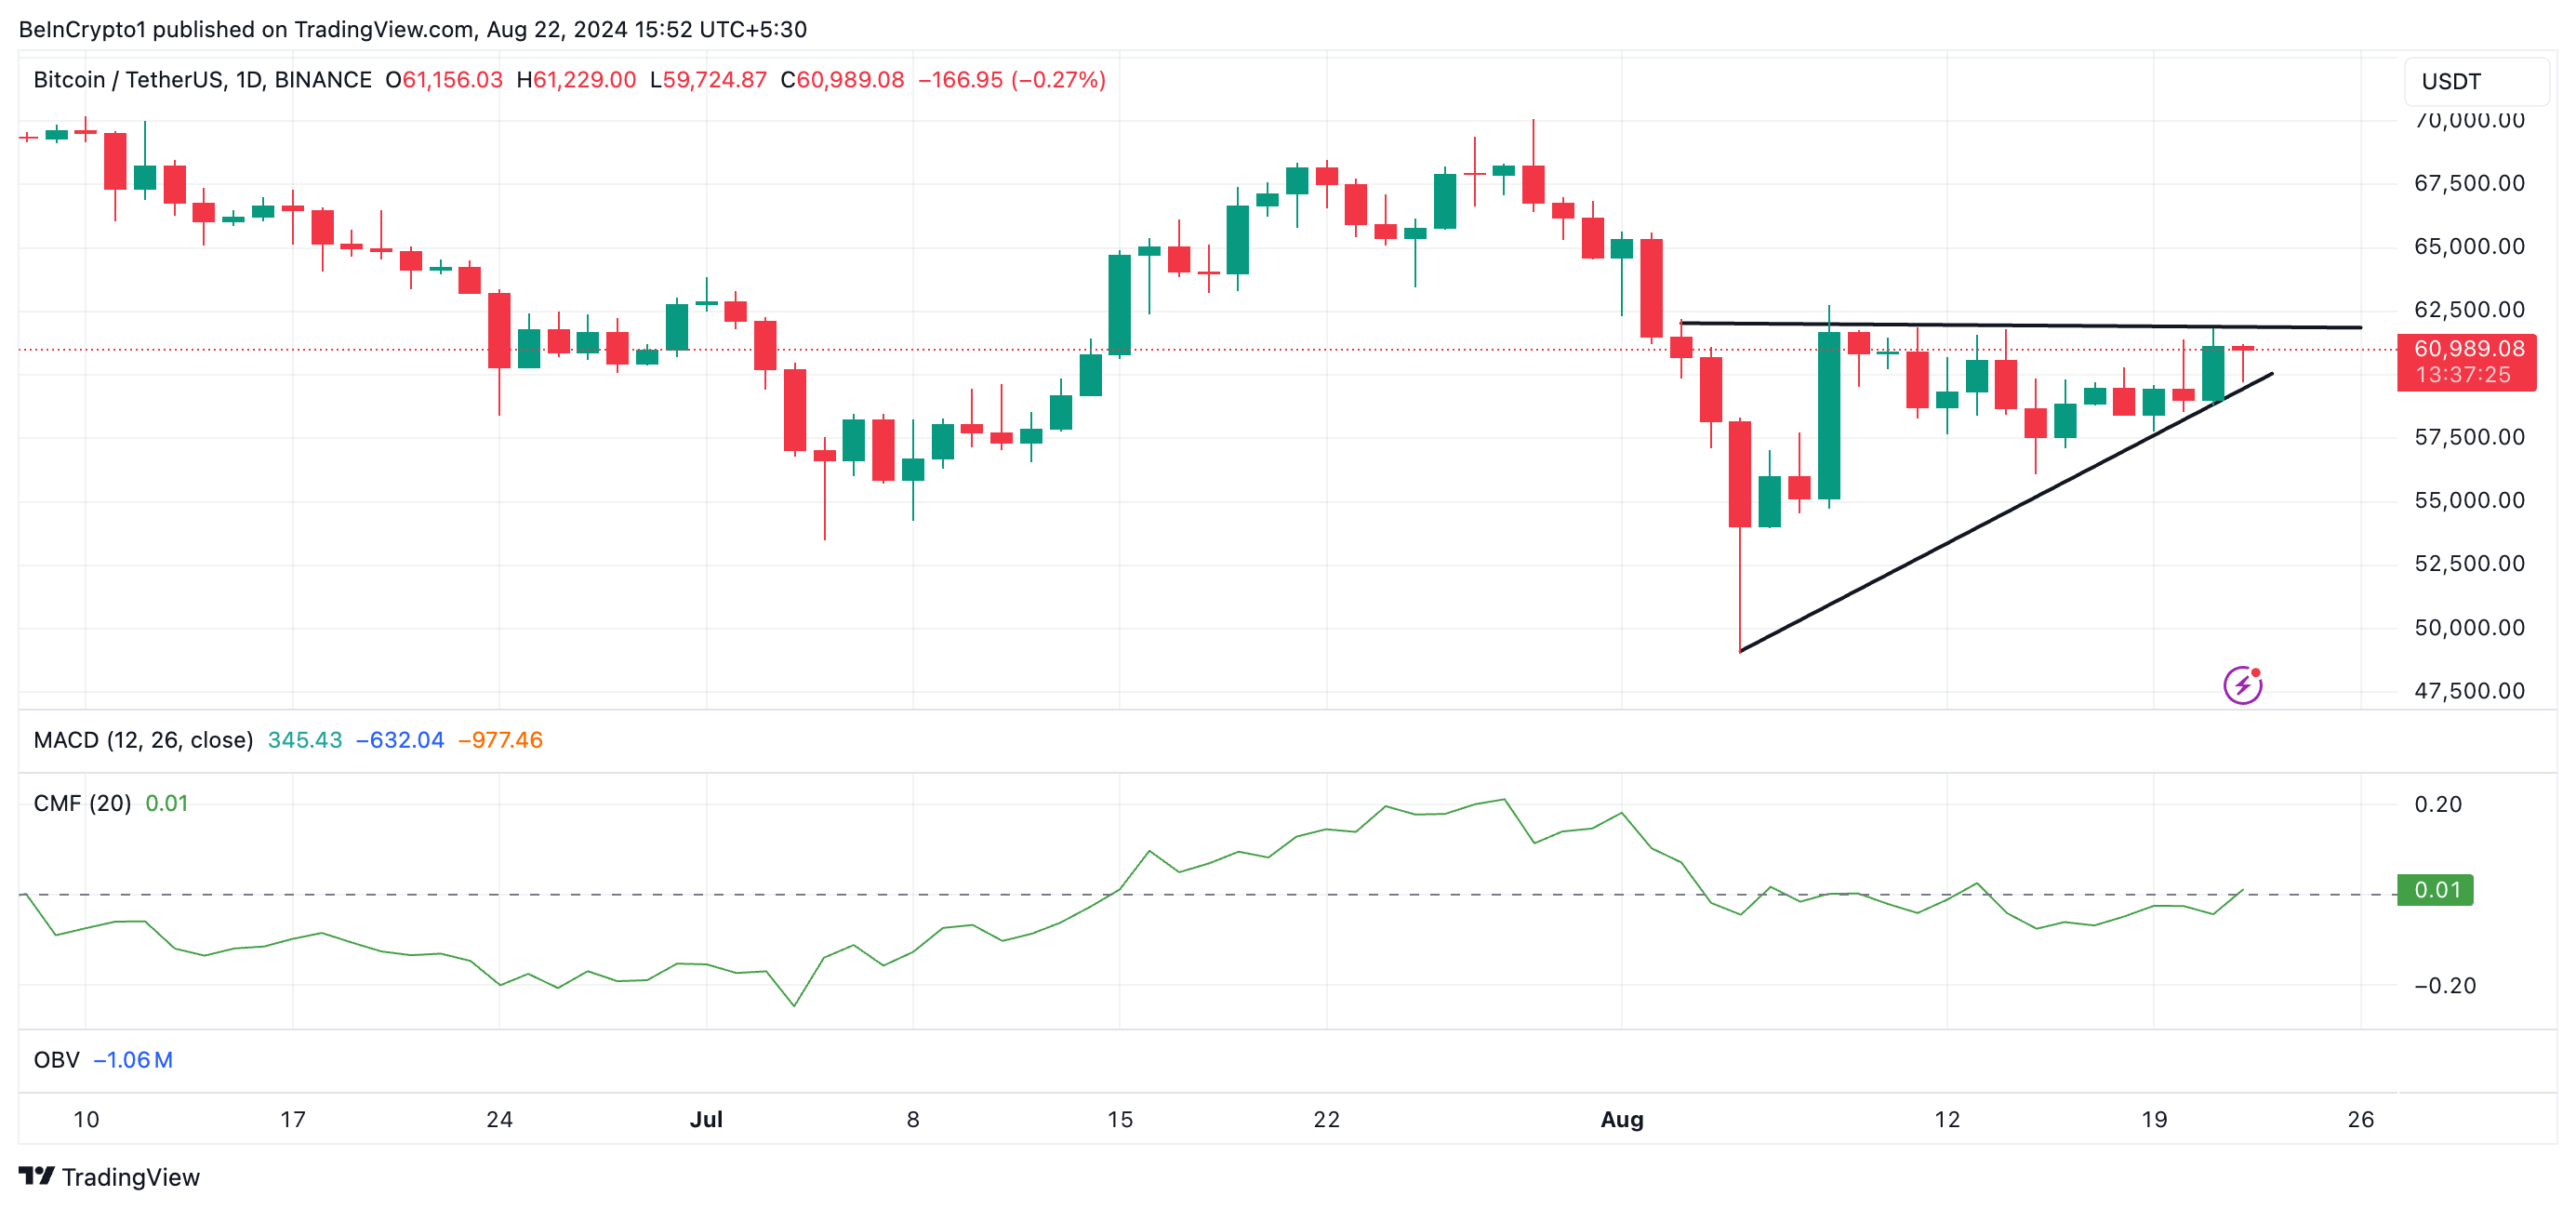
This indicator measures the flow of money into and out of an asset. When its value is above zero, it signals liquidity entry into the market and a spike in buying activity. Traders often view it as a precursor to a price rally.
Additionally, BTC’s on-balance volume (OBV) has risen steadily since the ascending triangle began. This indicator measures buying and selling pressure in an asset’s market.
Read more: What Happened at the Last Bitcoin Halving? Predictions for 2024
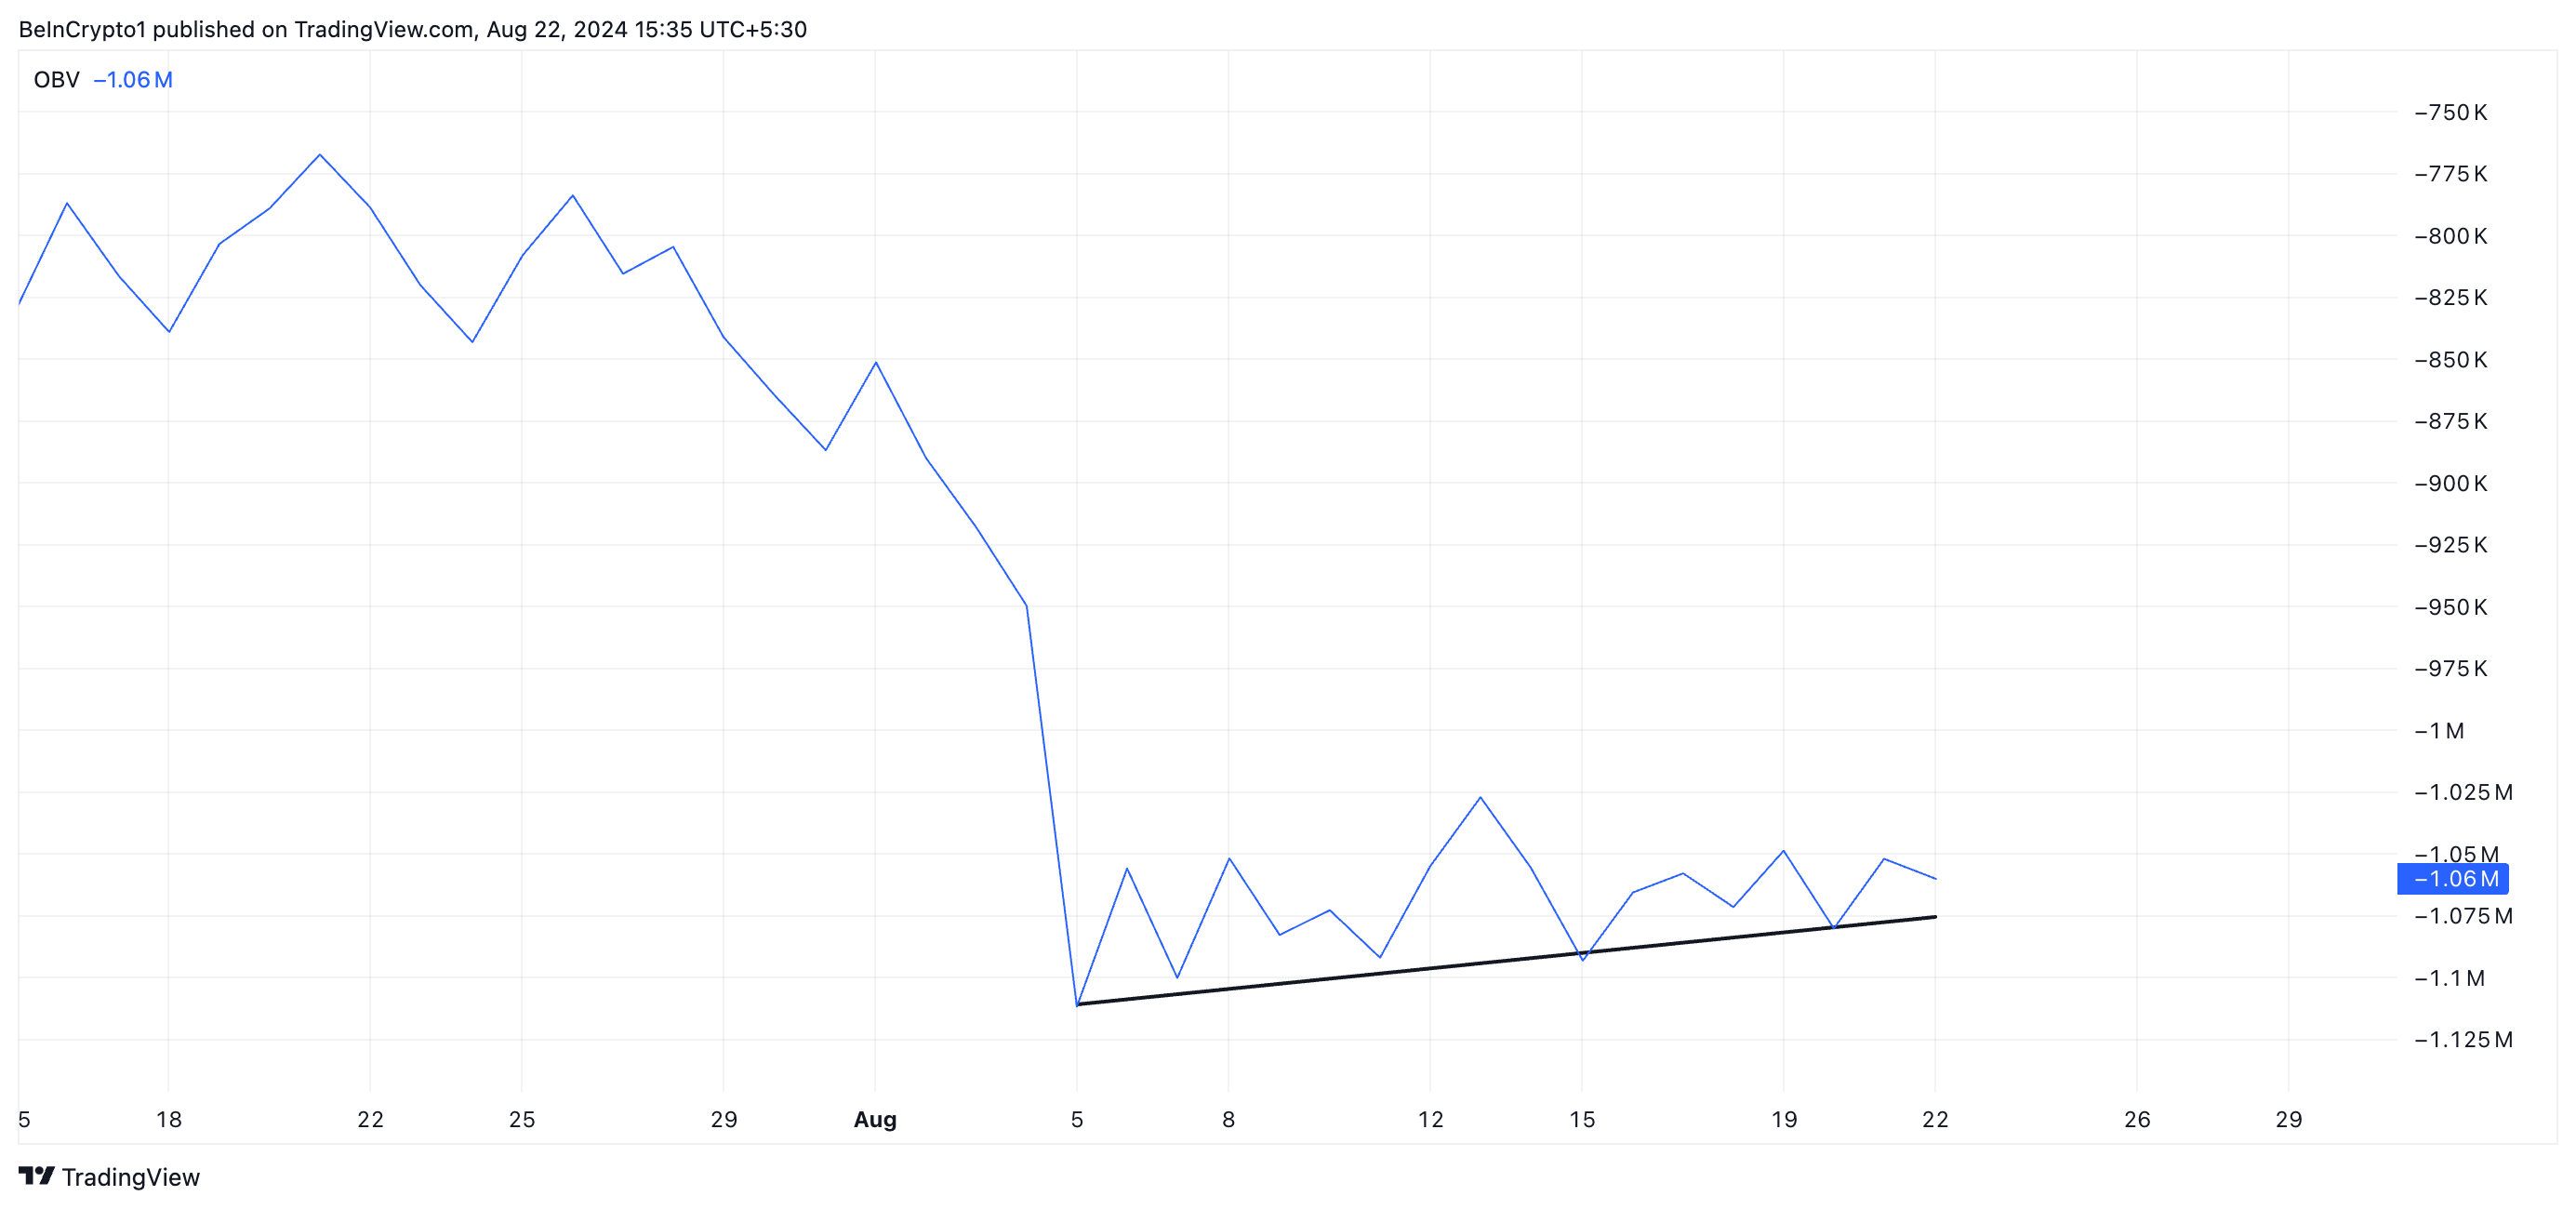
When it increases, it indicates that buying pressure outweighs selling activity, hinting at a bullish recovery.
BTC Price Prediction: Futures Traders Tread a Different Path
While BTC enjoys a growing bullish bias in its spot market, its derivatives market traders have adopted a bearish approach. This is evident in the coin’s taker-buy-sell ratio (assessed using a 14-day simple moving average), which has fallen below one. CryptoQuant’s data put the metric’s value at 0.99 at the time of writing.
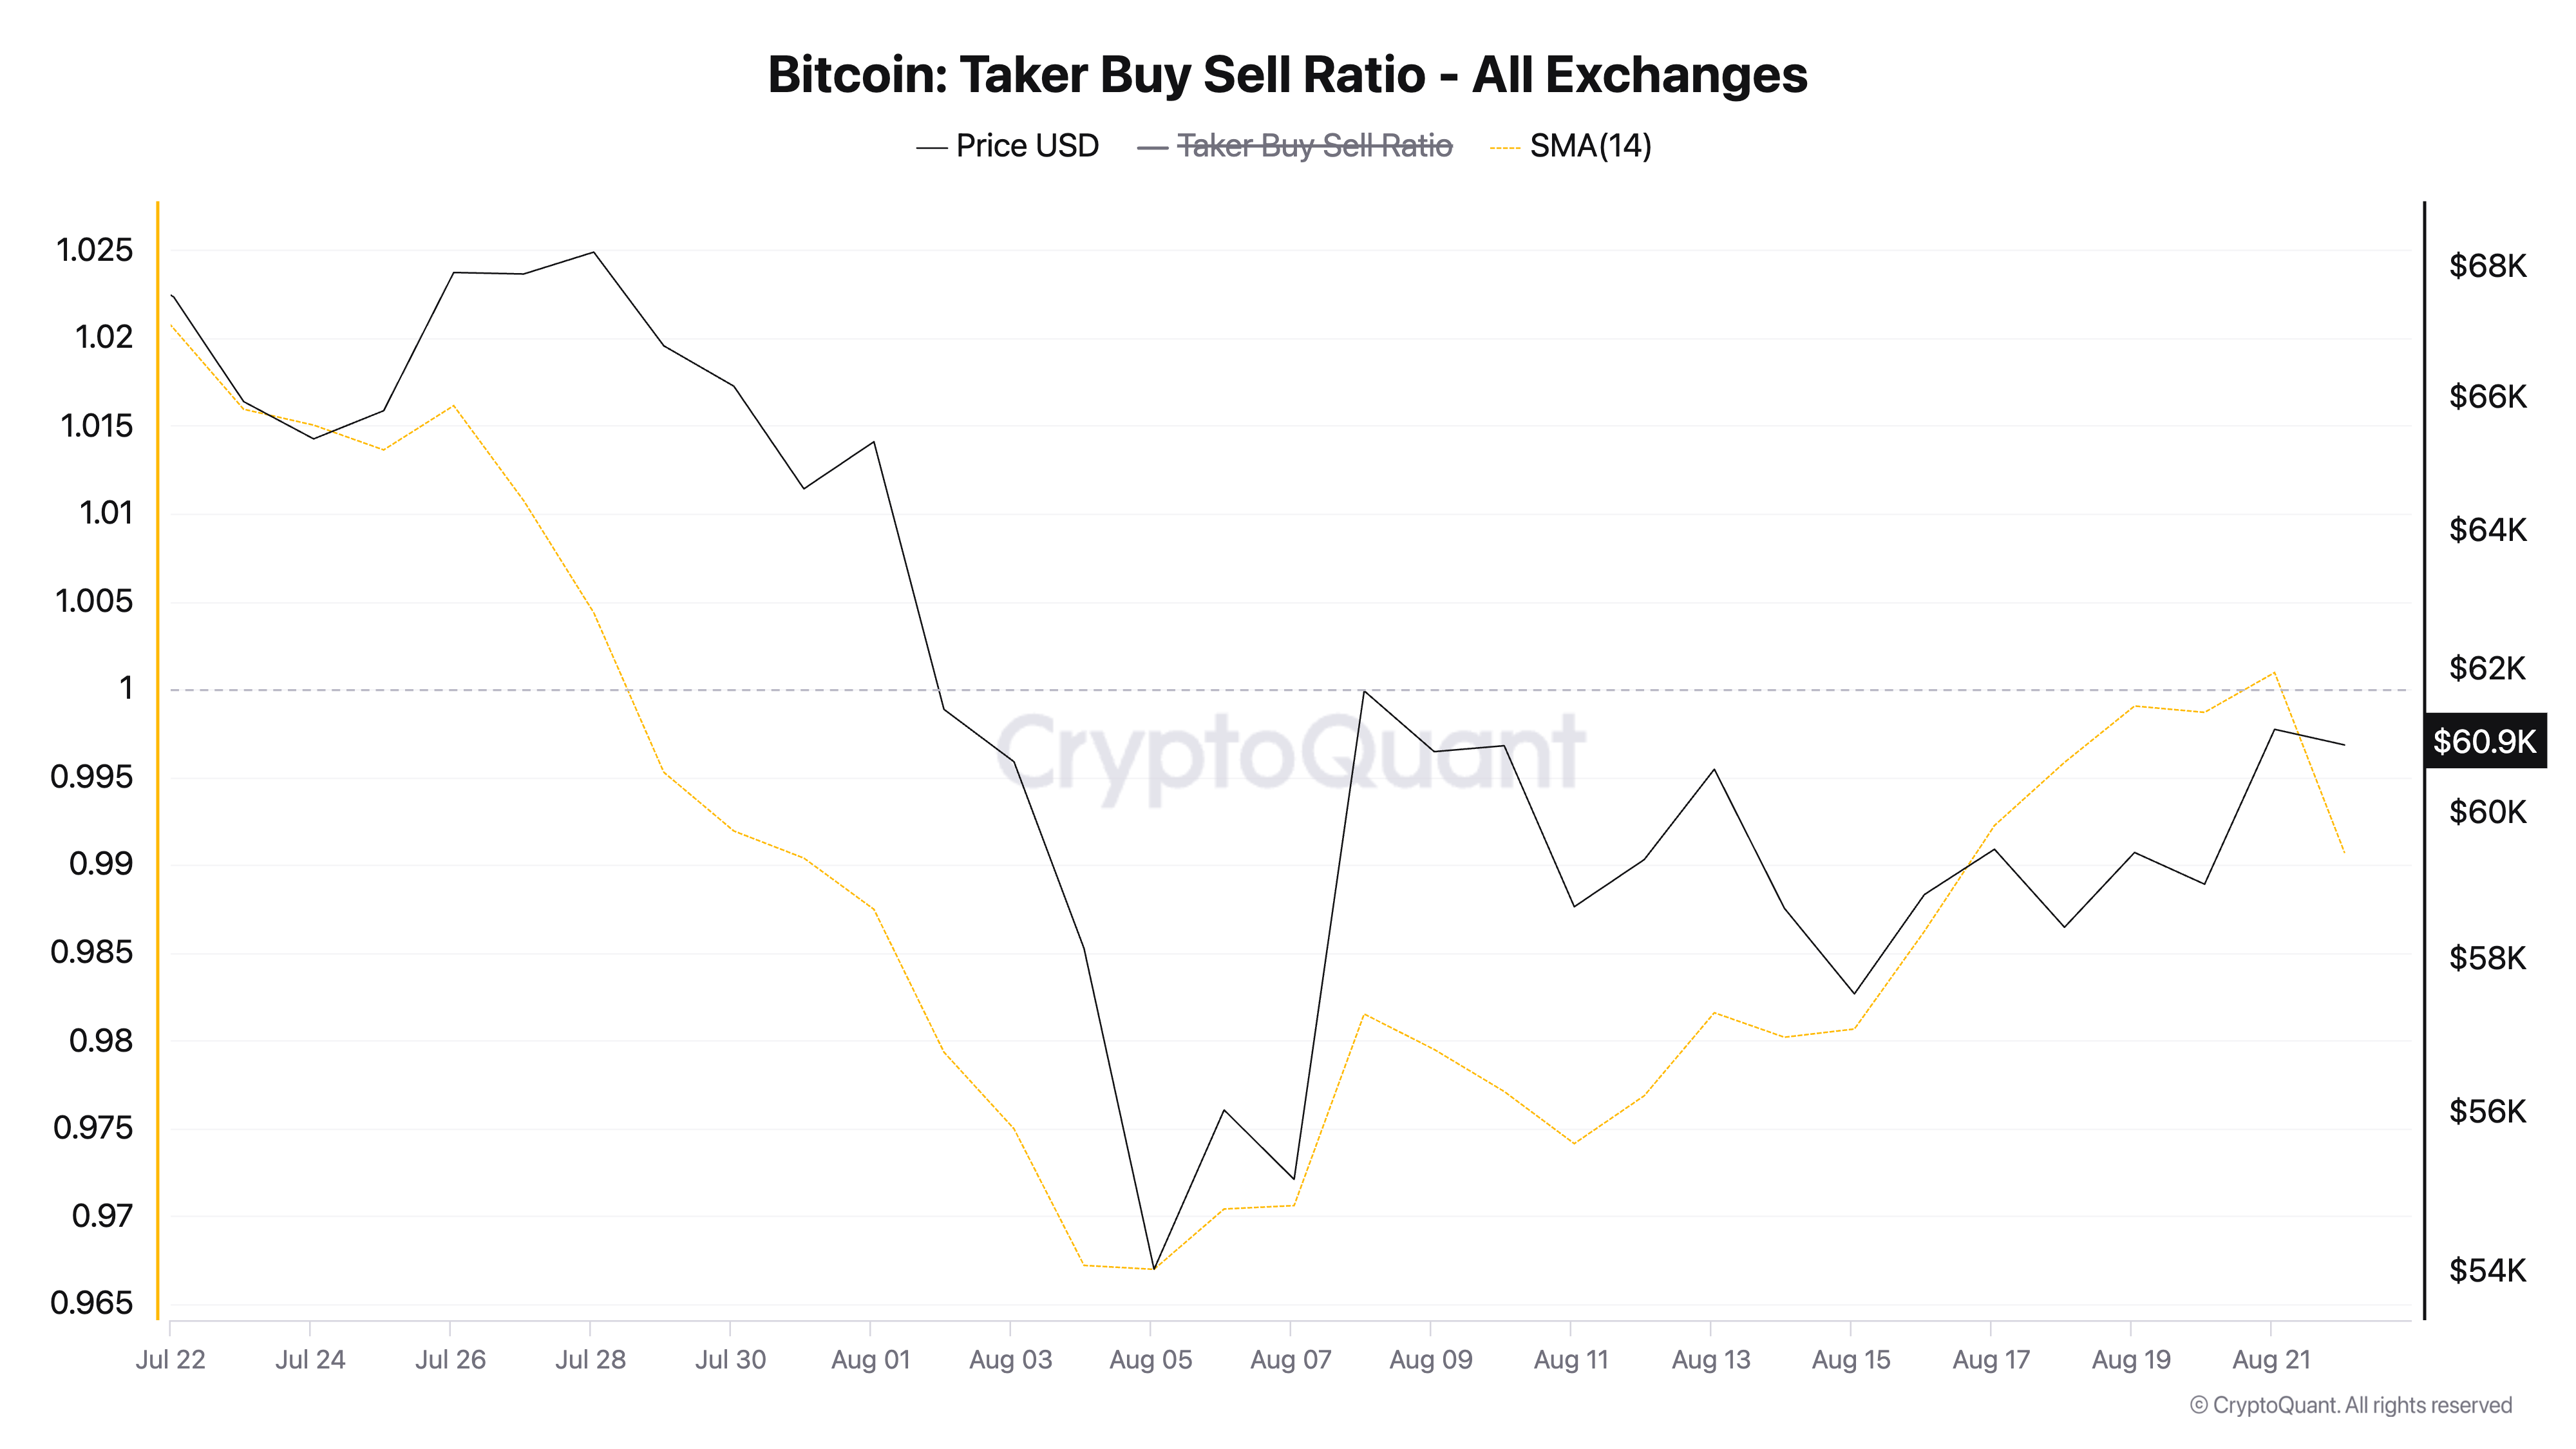
This metric measures the ratio between buy and sell volumes in an asset’s futures market. A value greater than one indicates more buy volume than sell volume, while a value less than one indicates more sell volume than buy volume.
A taker buy-sell ratio below one is a bearish signal, as it indicates that traders in an asset’s perpetual futures market are predominantly selling their assets rather than buying more.
Read more: 7 Ways To Survive the Crypto Bear Market
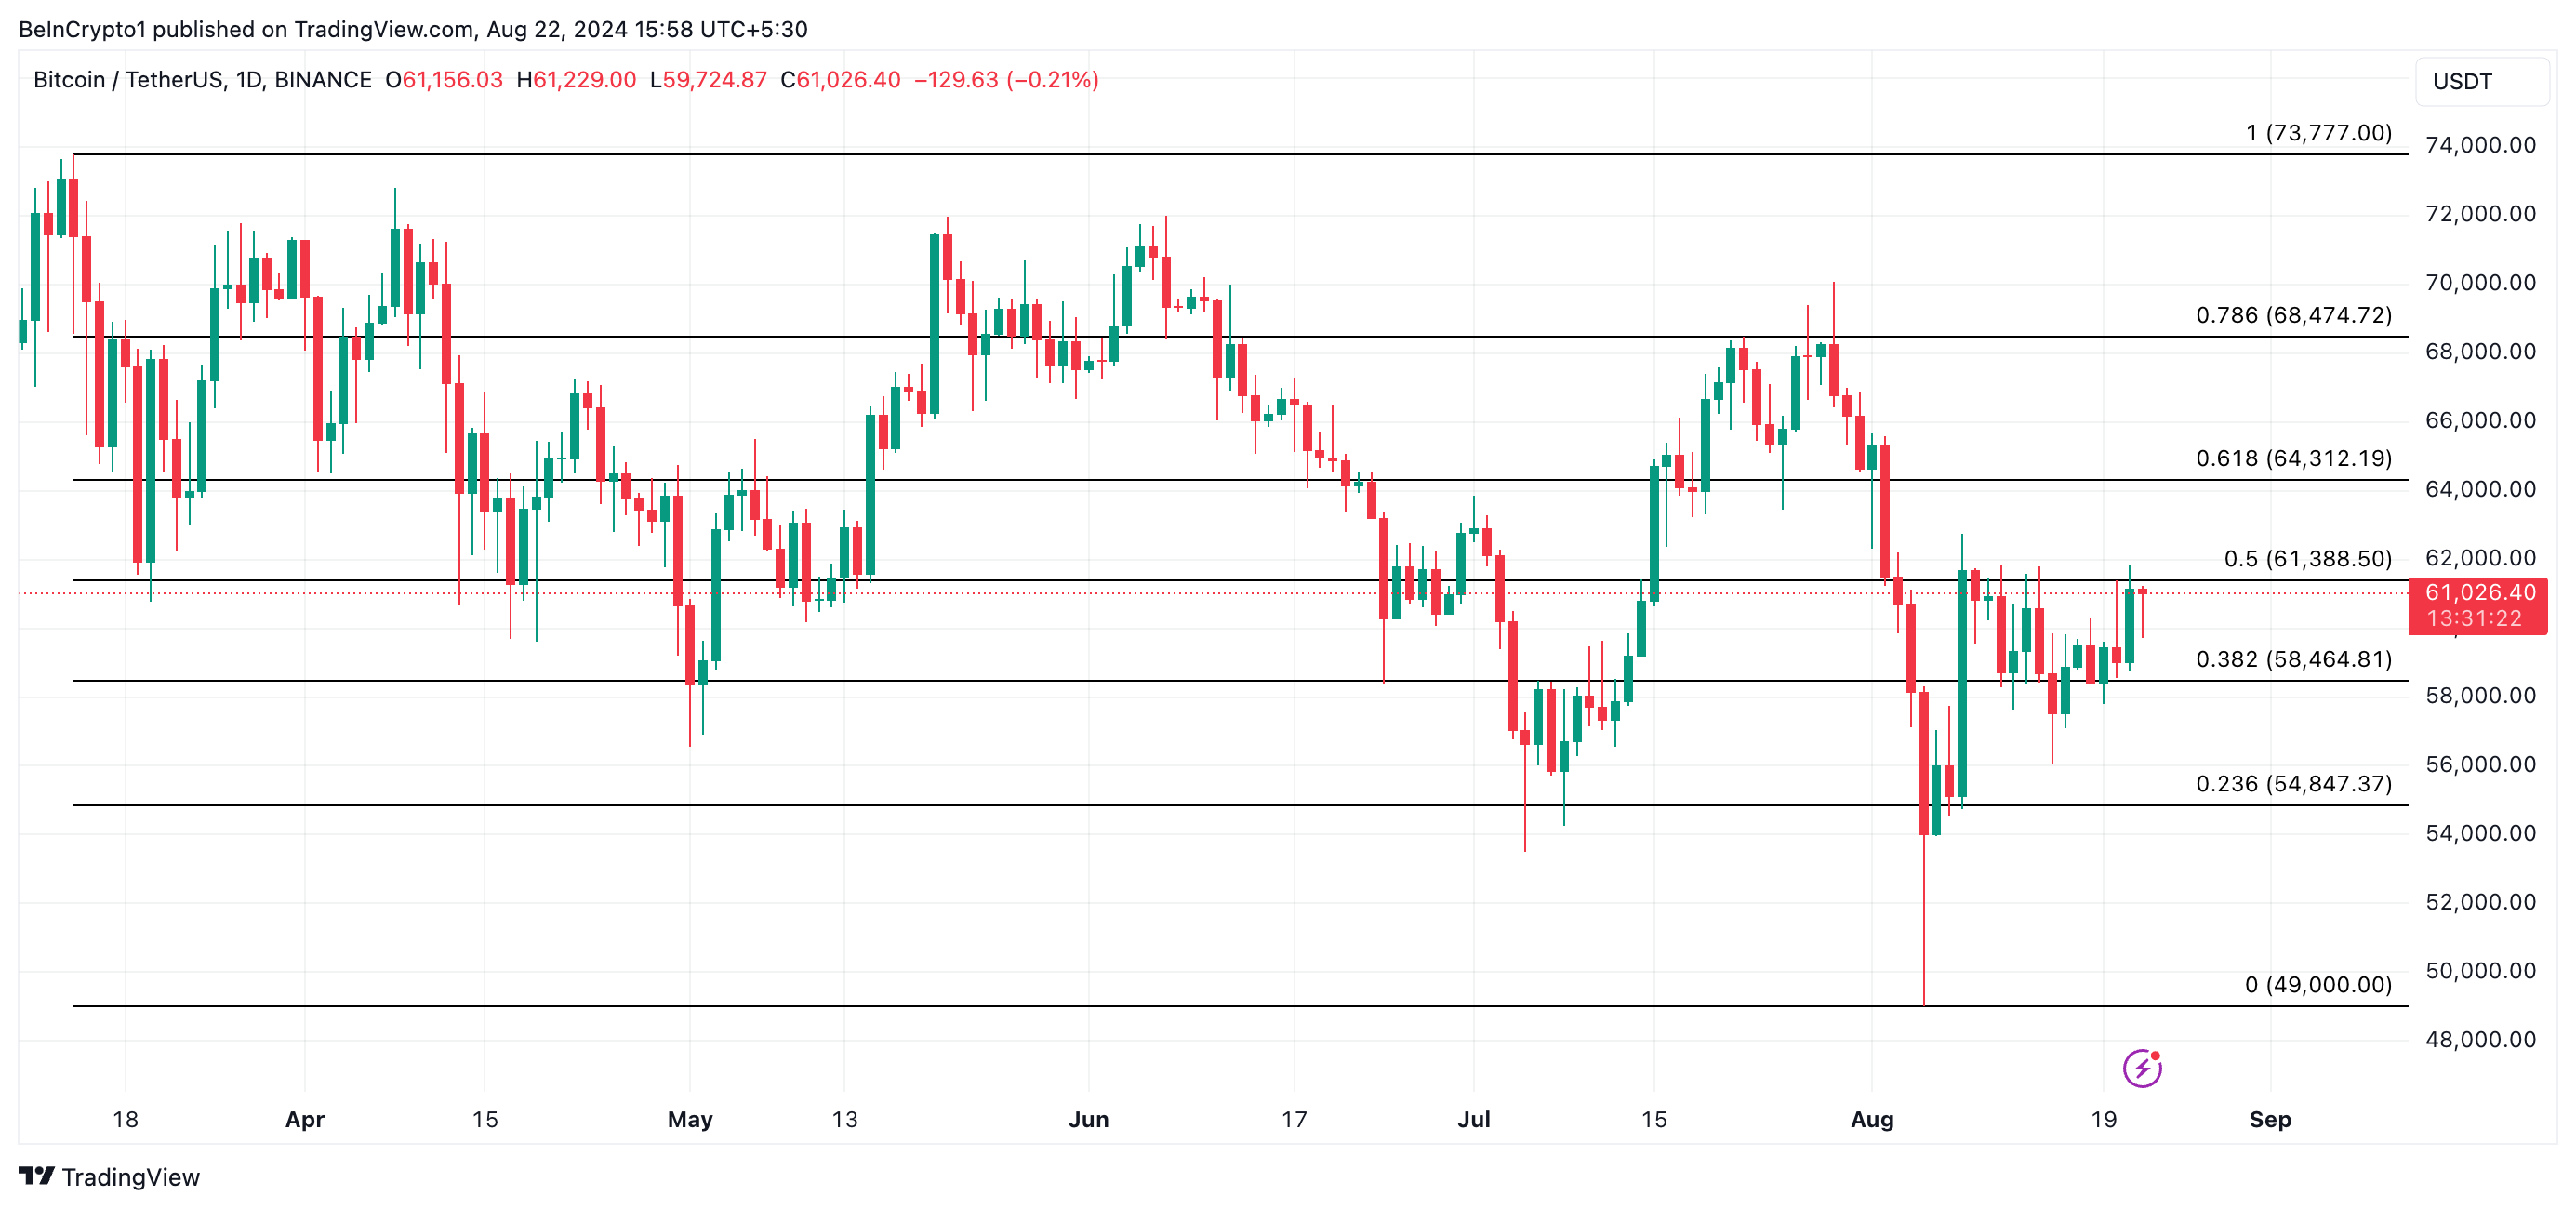
If traders continue selling, Bitcoin’s price could drop to $58,464, retracing some of its recent gains. On the other hand, if their strategy shifts toward accumulating more BTC, it could break above the ascending triangle’s resistance, potentially pushing the price to $64,321.
