


Binance Coin (BNB) has been increasing rapidly since breaking out from a symmetrical triangle on March 30.
BNB seems to be in the fifth wave of an ongoing bullish impulse.
BNB Token Burn
During its launch, Binance committed to burn 100 million BNB.
The burning program involves the buyback and subsequent destroying of BNB tokens each year to reduce the total supply. However, this is not done by burning tokens from outside holders. It is instead done by burning tokens from the team treasury.
The 15th quarterly BNB burn occurred on April 15. In it, 1,099,888 tokens were burned, which at the current price have a value of $593 Million.
Triangle Breakout For BNB
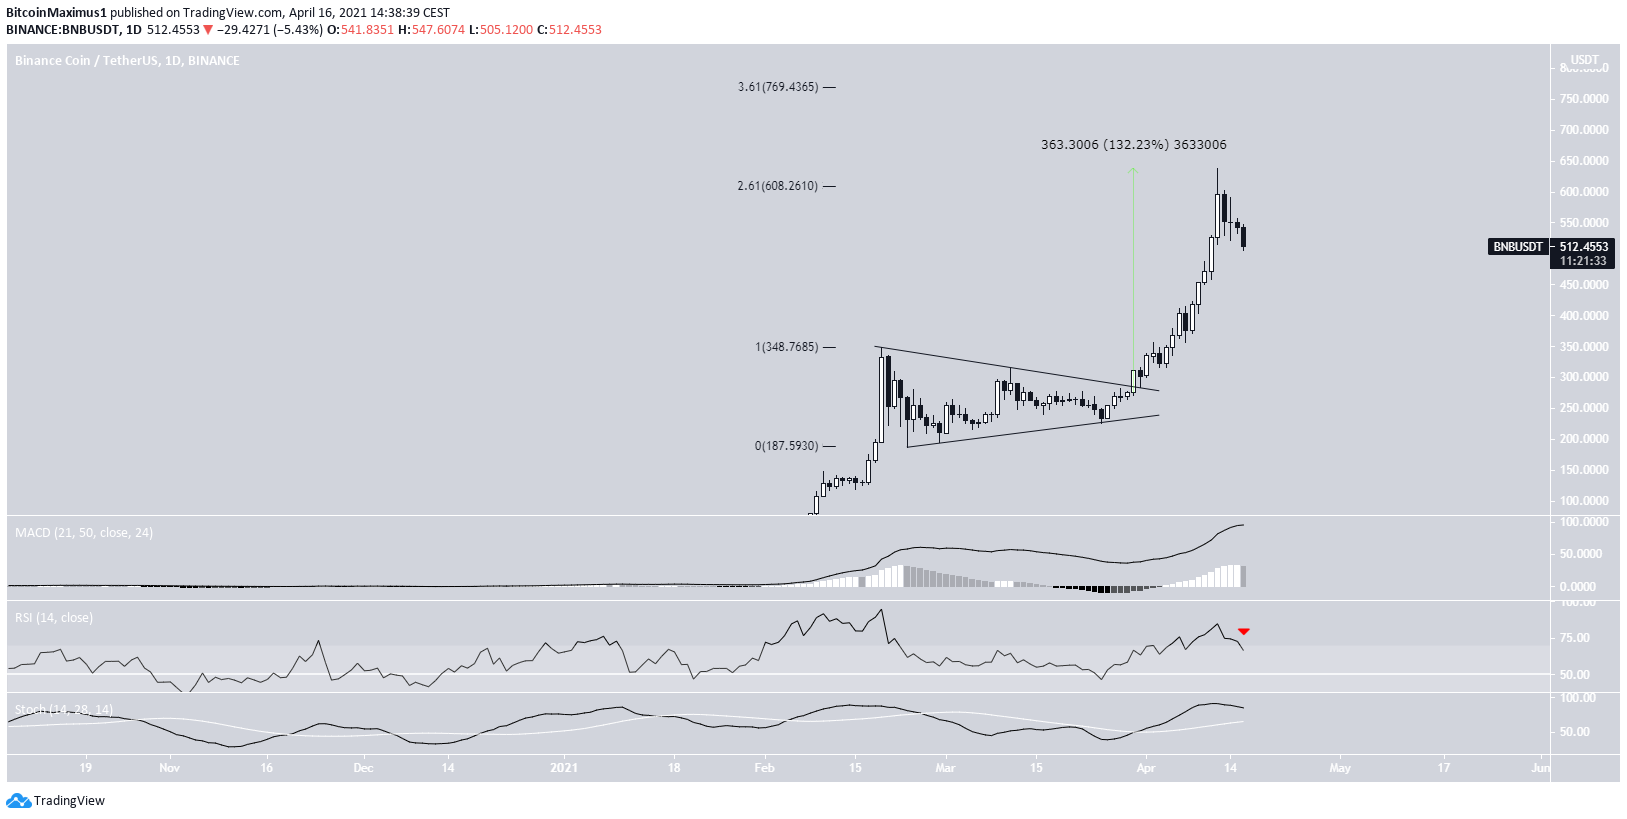
On March 30, BNB broke out from a symmetrical triangle. It has increased considerably since.
On April 10, it reached a new all-time high price of $638.5. This measured an increase of 132% from the breakout level. BNB has been moving downwards since.
The token made the high right at the 2.61 external Fib retracement of the previous downward movement. The next resistance area is found at $769.
Despite the long-term increase, technical indicators have begun to turn bearish. This is especially evident by the RSI cross below 70. Also, the MACD has made one lower momentum bar, and the Stochastic Oscillator has begun to move downwards.
Therefore, it is possible that the upward move is gradually reaching its top.
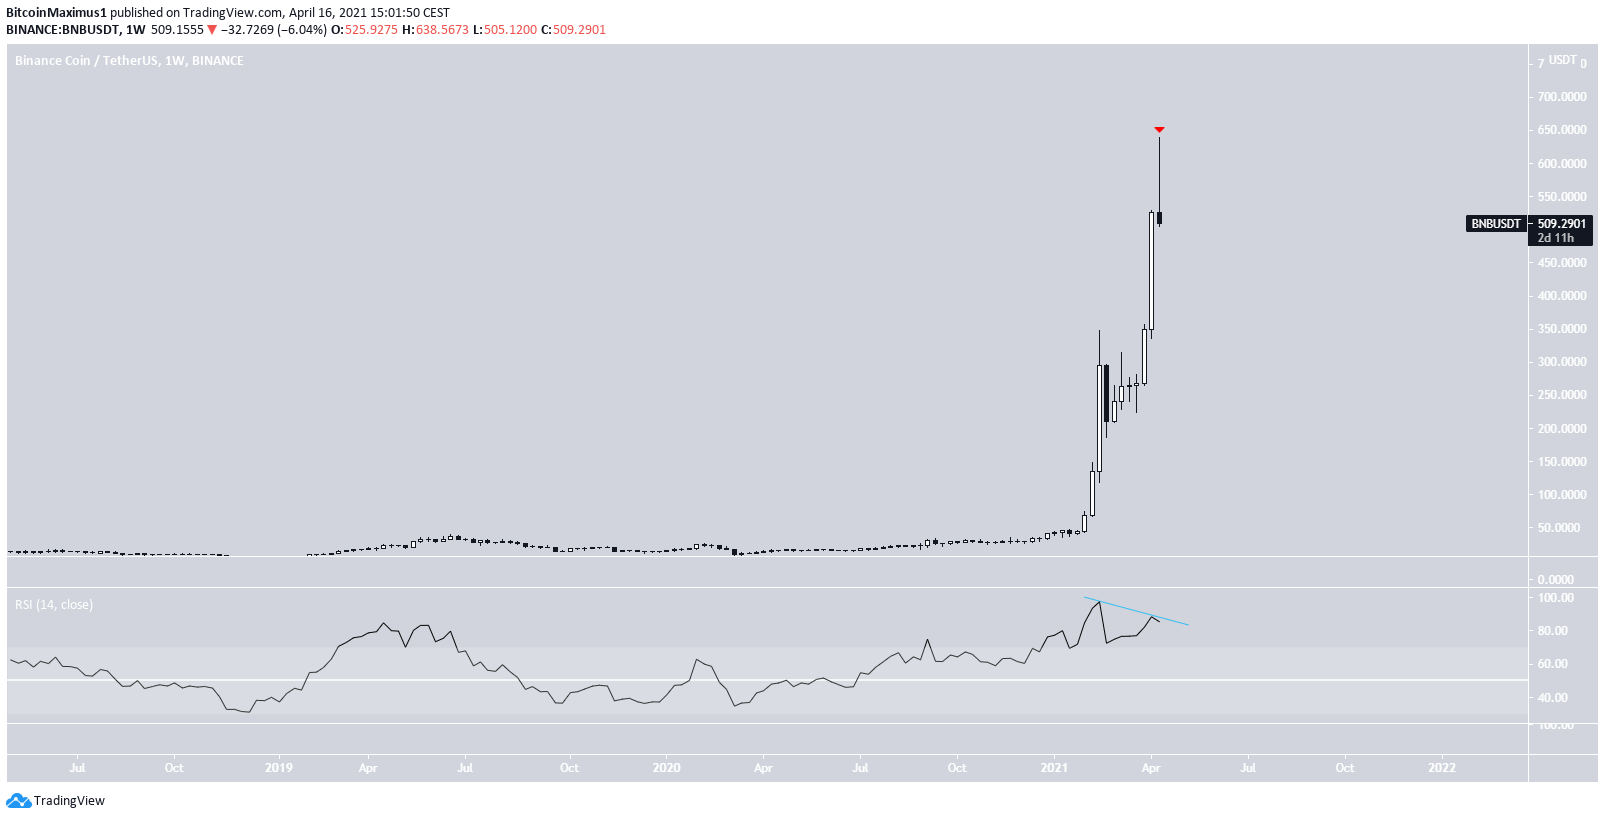
BNB Weekly Movement
The weekly chart is already showing signs of weakness. Firstly, there is bearish divergence developing in the RSI.
Secondly, while this depends on the close, the weekly time frame potentially creates a shooting star. This is seen as a bearish sign that often leads to trend reversals.
Nevertheless, there are two more days left until the weekly close. Thus this potential bearish reversal sign can still be invalidated.
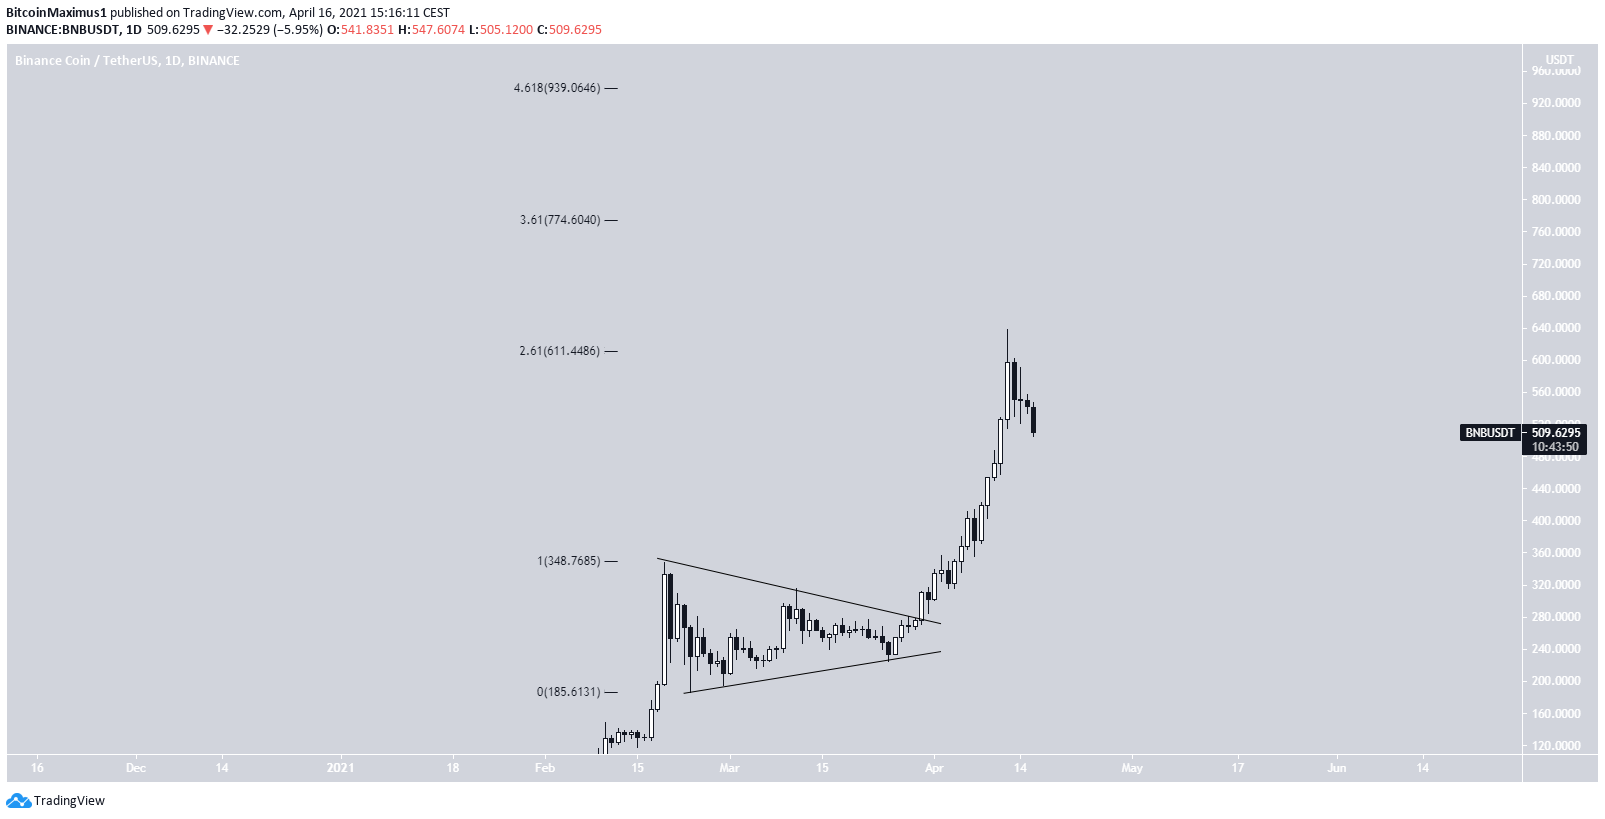
Wave Count
Symmetrical triangles are often fourth waves. Therefore, it is likely that the ensuing breakout is wave five.
Therefore, BNB is likely in the fifth and final wave of a bullish impulse.
While we cannot determine if wave five will extend, BNB is likely nearing the top of its bullish impulse.
If wave five extends, the token will find the two most likely targets for the top of the move at $774 and $939.
Conclusion
To conclude, BNB seems to be in the fifth and final wave of a bullish impulse. While the current wave may extend to $774 or even $939 (unlikely), the current upward movement seems to be nearing its end.
For BeInCrypto’s latest bitcoin (BTC) analysis, click here.


