


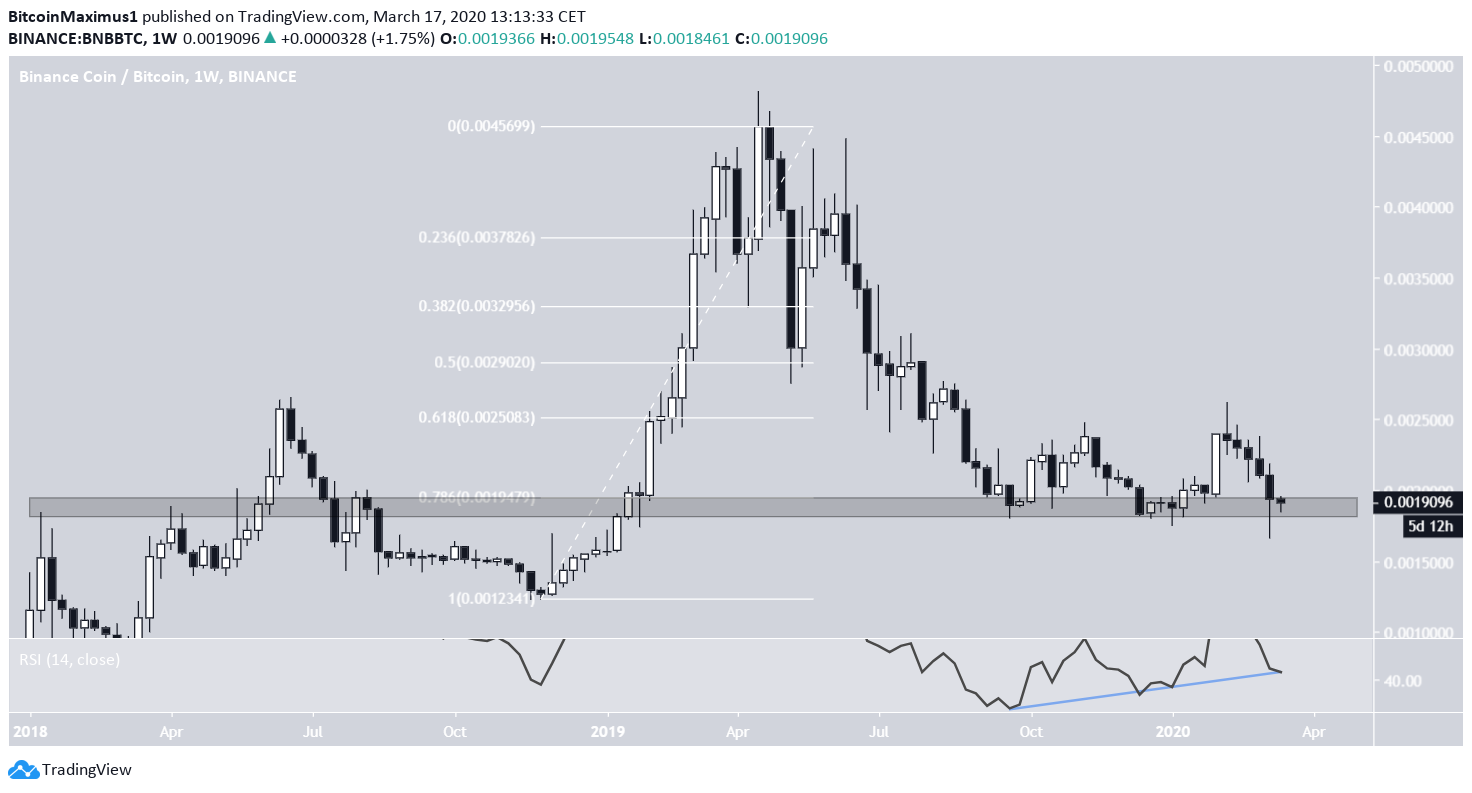
The BNB price has been decreasing since reaching a high of 481,340 on April 20, 2019. On Sept. 21, the price reached the 190,000 satoshi support area. While it has attempted to initiate several upward moves, it has fallen back to this level each time.
Binance Coin (BNB) Price Highlights
- The price has made a triple bottom.
- The weekly RSI is bullish.
- There is support at 190,000 satoshis.
- There is resistance at 210,000 and 235,000 satoshis.
During the recent BTC price decrease, the majority of altcoins have decreased at an accelerated rate, breaking down below numerous support areas. However, cryptocurrency trader @Cryptotunez outlined a BNB chart, stating that it is the only altcoin that he would touch, considering the overall market conditions.
the only and i stress only altcoin i would touch rn
leading indicator tho, just give it some time pic.twitter.com/JvxOGwj7Tq
— tunez (evm/acc) 🎮 (@cryptunez) March 17, 2020
Let’s take a closer look at the BNB price movement and attempt to determine where the price is heading to next.
Triple Bottom
The main support area for BNB is found at 190,000 satoshis. This is both a previous support area and the 0.786 Fib level of the entire previous increase, making its defense crucial if the price wants to move higher.
The price has been trading inside it since September 2019, having possibly made a triple bottom inside it, which is considered a bullish reversal pattern.
In addition, the weekly RSI has generated bullish divergence through the three bottoms, making a price breakout very likely.
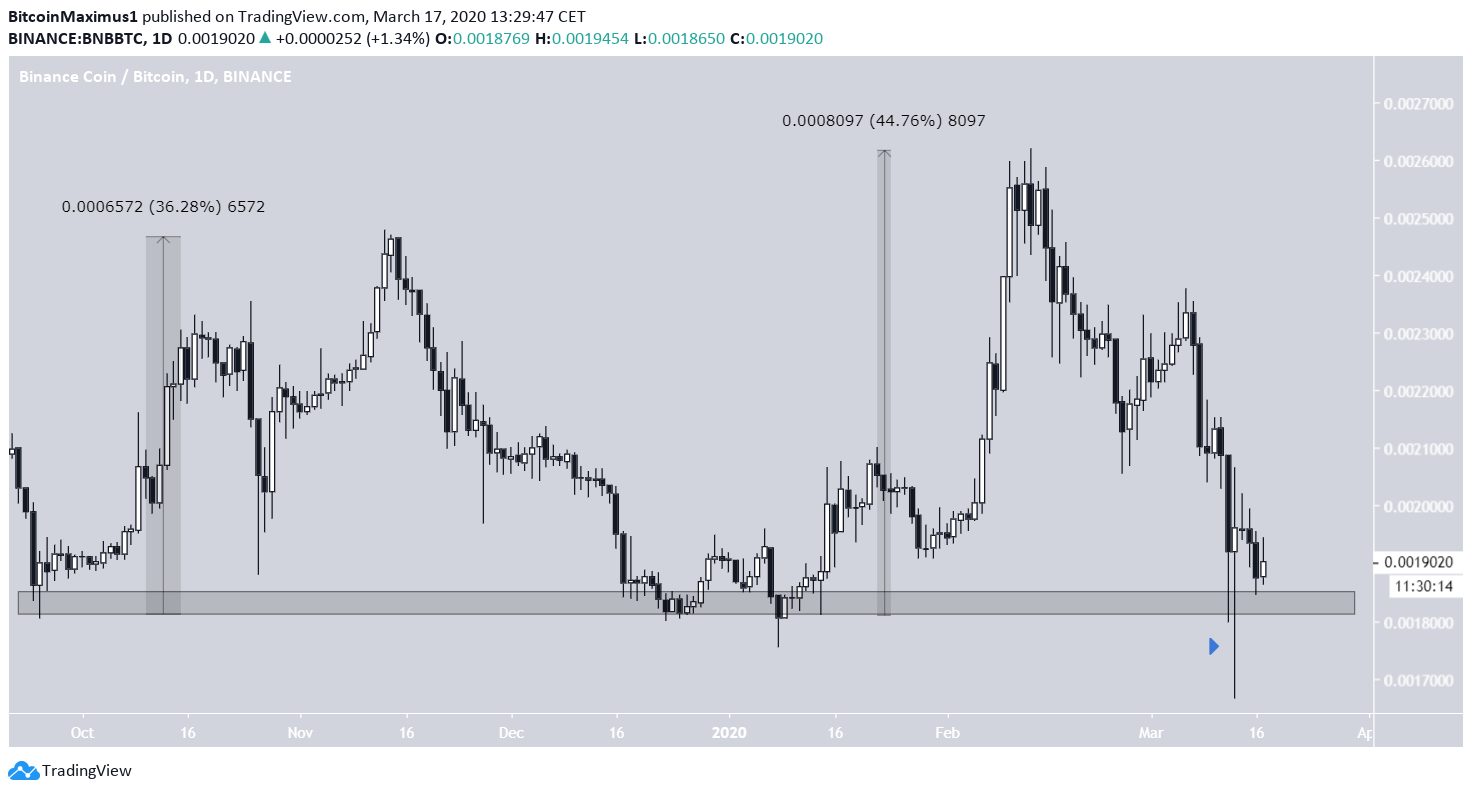
The daily chart reveals two additional interesting characteristics:
First, during the current movement, the price has only reached the support area in the form of a wick.
In addition, during the first two times the price reached it, the second bounce has been stronger than the first one, a sign of strength.
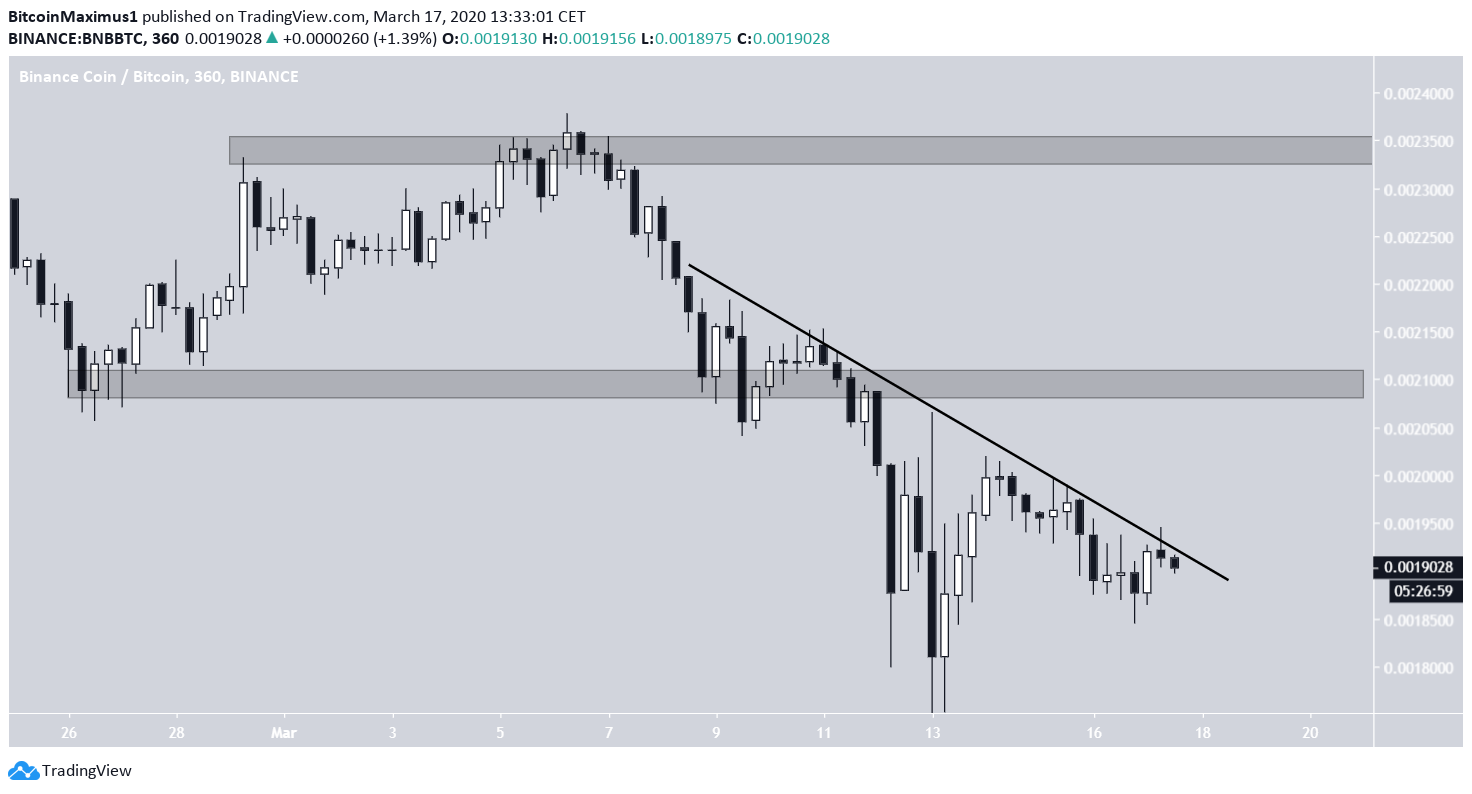
Future Movement
In the short-term, the BNB price is following a descending resistance line. The price is expected to break out from this resistance and move toward the closest resistance area at 210,000 satoshis.
The next resistance area is found at 235,000 satoshis. While the price could reach it, this movement depends on the BTC price, since a strong decrease in the latter would likely cause the same for BNB.
To conclude, the BNB price is trading inside a significant support area, having created a bullish reversal pattern inside it. As long as the 190,000 support area holds, we are expecting the price to move upward toward the resistance area given above.


