


One of the most popular technical analysis indicators, the RSI, has broken decisively from a more than 6-month downtrend line.
A look at similar cases from the previous three years allows us to estimate the potential for increasing the bitcoin (BTC) price in the coming months.
The following article explains what the RSI is and how important the breakout that occurred last week was. It analyses previous situations in which the indicator has broken out of a long-term downtrend and shows that each time this has led to a significant rise in the bitcoin price.
Then, by averaging the historical outcomes and extrapolating the results to the current valuation of BTC, it arrives at a hypothetical target for bitcoin’s rally — $85,487.
What is the RSI?
The Relative Strength Index (RSI) is one of the most popular momentum oscillators in technical analysis. It measures the magnitude of price changes in relation to previous gains or losses. Its visual equivalent is a line chart that moves in the range between 0-100.
The standard interpretation of the RSI is to estimate the overbought (above 70) or oversold (below 30) level of an asset. In the first case, we get a bearish signal, in the second, a bullish signal. The indicator’s creator is J. Welles Wilder Jr., who explained its application in a book from 1978.
Usually, the RSI is calculated based on 14 preceding periods (e.g. 14 weeks, 14 days or 14 2-hour periods). Throughout the following article, we refer to the RSI on the daily interval.
RSI breaks out of 6-month trendline
A few days ago, the RSI indicator for bitcoin broke out of the long-term downtrend line it has been below since January 8, 2021.
The index value was 89 at the time. This was the highest reading in over three years, when the index recorded a level of 94 at the peak of the previous bull market in December 2017.
On the RSI chart, we see a descending trendline (blue) that was in place when a new all-time high (ATH) was set at $64,895 on April 14. The line was also further in force during the May declines and the subsequent consolidation in the range of $28,600 – $41,300.
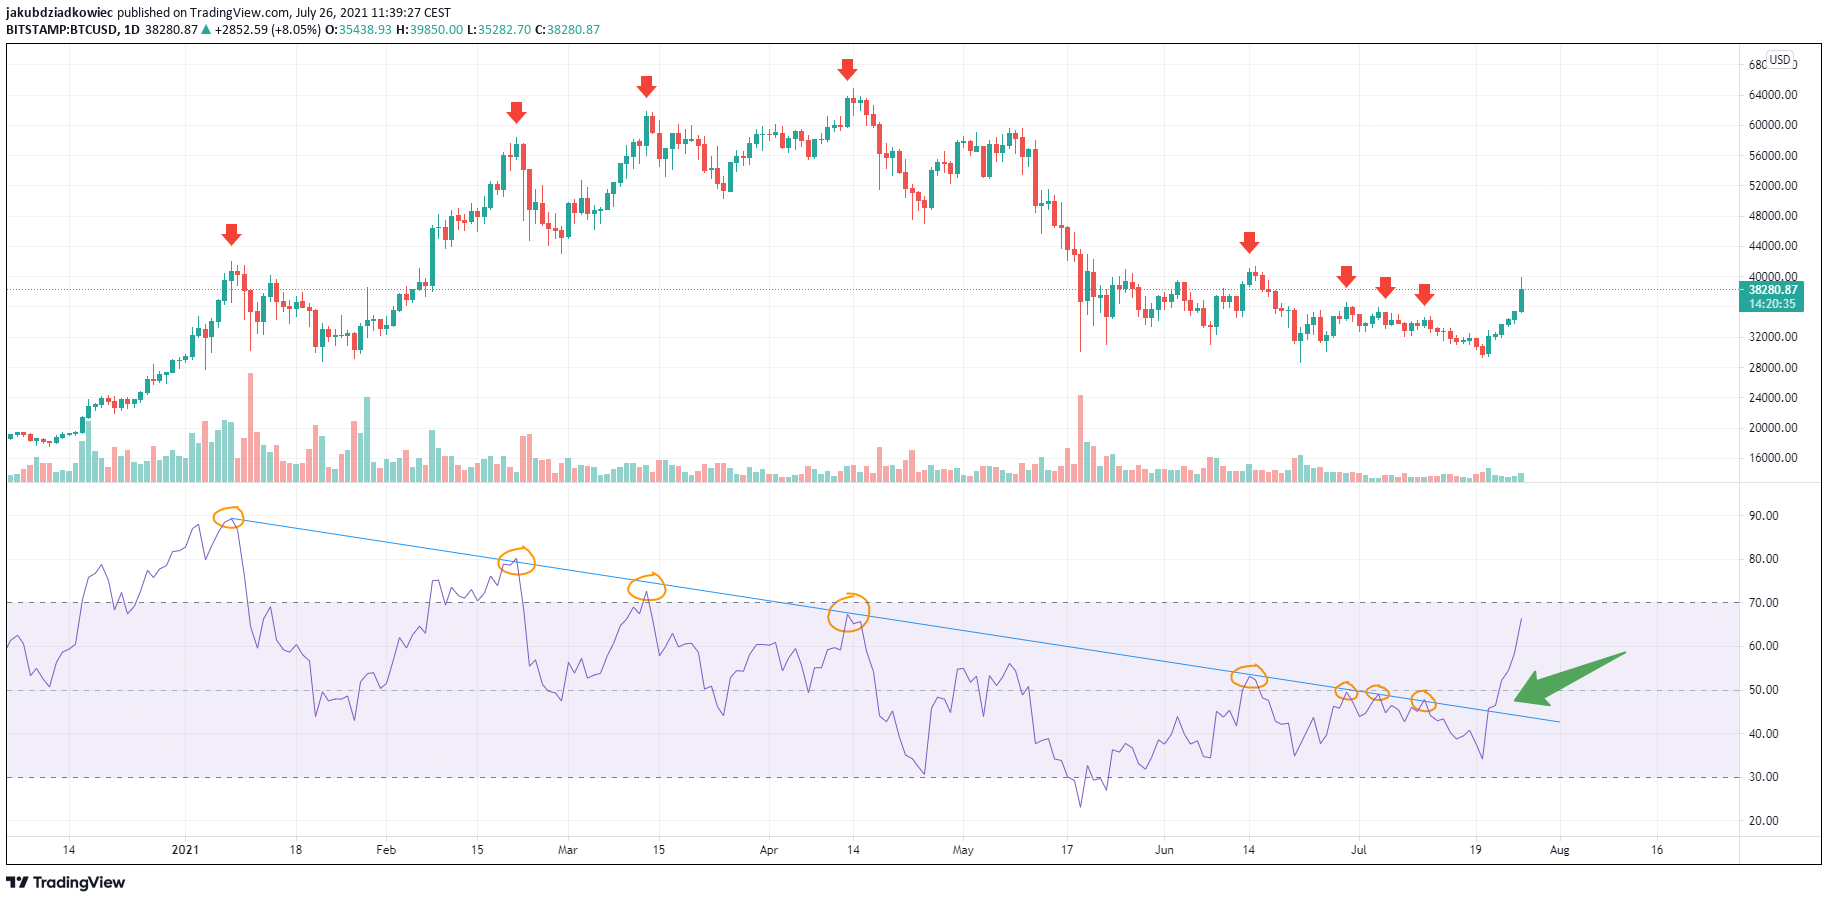
In total, the downtrend line was retested 8 times over a 6-month period (194 days). However, since July 21, there was a decisive breakout (green arrow).
Today the indicator records a value of 66 and is at its highest since April 16. Just after bitcoin set the ATH. The bitcoin price chart follows the bullish signal from the RSI as it has just regained the support area at $38,000.
Historical RSI breakouts vs. the BTC price
To understand what the long-term significance of an ongoing breakout on the RSI might be, it is worth looking at similar situations from historical BTC price action.
There are several examples of breakouts following several months of downtrends on the RSI and correlated uptrends on Bitcoin over the last three years.
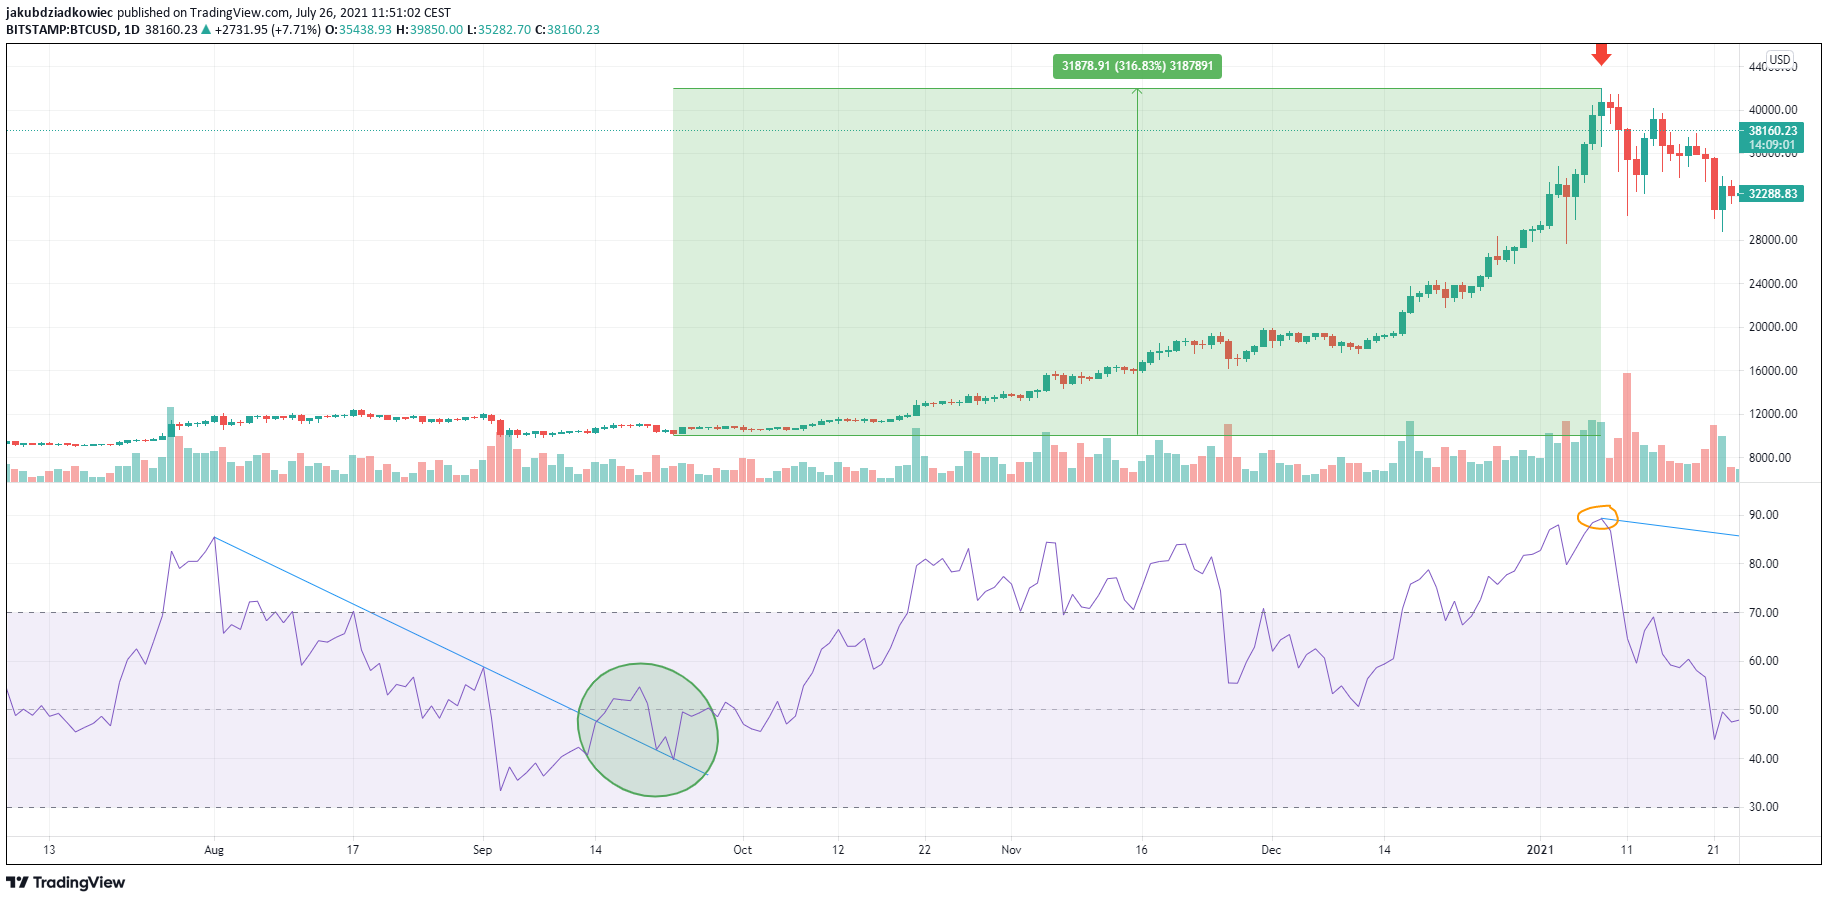
The last time the RSI was in a clear downtrend was from August 1 to September 23, 2020. The indicator broke out of the trendline (blue), followed by a bullish re-test (green circle) and rose to the aforementioned 89 level on January 8, 2021.
During this time, bitcoin’s price increased by 317%, from a level of $10,138 to a peak at $42,000. Meanwhile, BTC pierced the historical ATH of 2017 at $20,000.
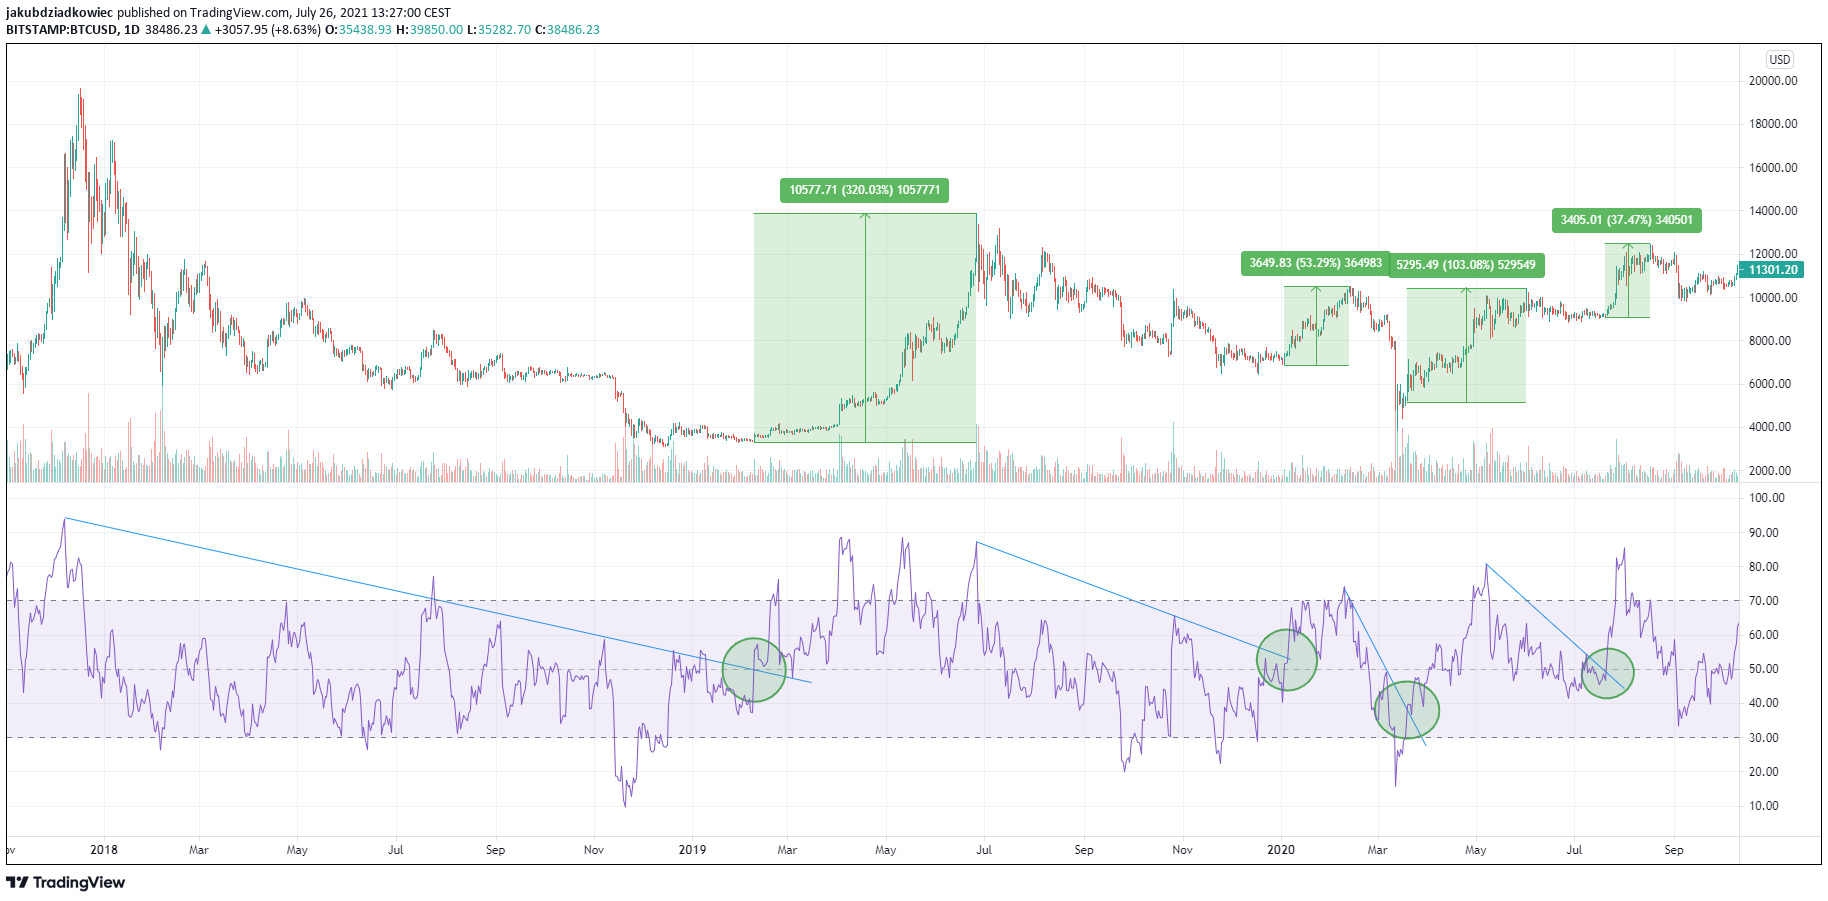
Going back to the end of the last bull market, we find four more instances of the RSI breaking out above the long-term downtrend line:
- February 8, 2019, when the RSI broke out of 14 months of declines (426 days). The breakout saw the BTC price rise by 320%, from $3,337 to a peak at $13,880 on June 26, 2019.
- On January 3, 2020, when the RSI was in a downtrend for more than 6 months (193 days), from the above-mentioned peak. Bitcoin rose 53% after this breakout, from $6,853 to a peak at $10,495, followed by a coronavirus crash.
- March 19, 2020, after the RSI indicator bottomed at 15 a few days earlier. BTC then rose 103% in just 74 days, from a low of $5,266 to $10,429 on June 1, 2020.
- July 20, 2020, when the RSI broke out after a 2.5-month downtrend (75 days). The breakout led to a 37% increase in the BTC price, from $9,128 to a peak at $12,473 on August 17, 2020.
Conclusion: 166% profit for BTC
In conclusion, one may be tempted to average the amount of increases in the bitcoin price that have always followed the breakout of the RSI indicator from the long-term downtrend. The average of all five increases discussed above (320%, 53%, 103%, 37% and 317%) is 166%.
Using a simple extrapolation of this average to the bitcoin price at the time of the current RSI breakout, we can estimate a hypothetical upward movement target. The close of the daily candle on July 21 was at $32,138. Increasing this value by 166%, we get a BTC target of $85,487.
Of course, this is not a technical target of any kind but merely a calculation of the averaged upside of bitcoin’s price after its Relative Strength Index breaks out of its long-term downtrend.
For BeInCrypto’s previous Bitcoin (BTC) analysis, click here.


