


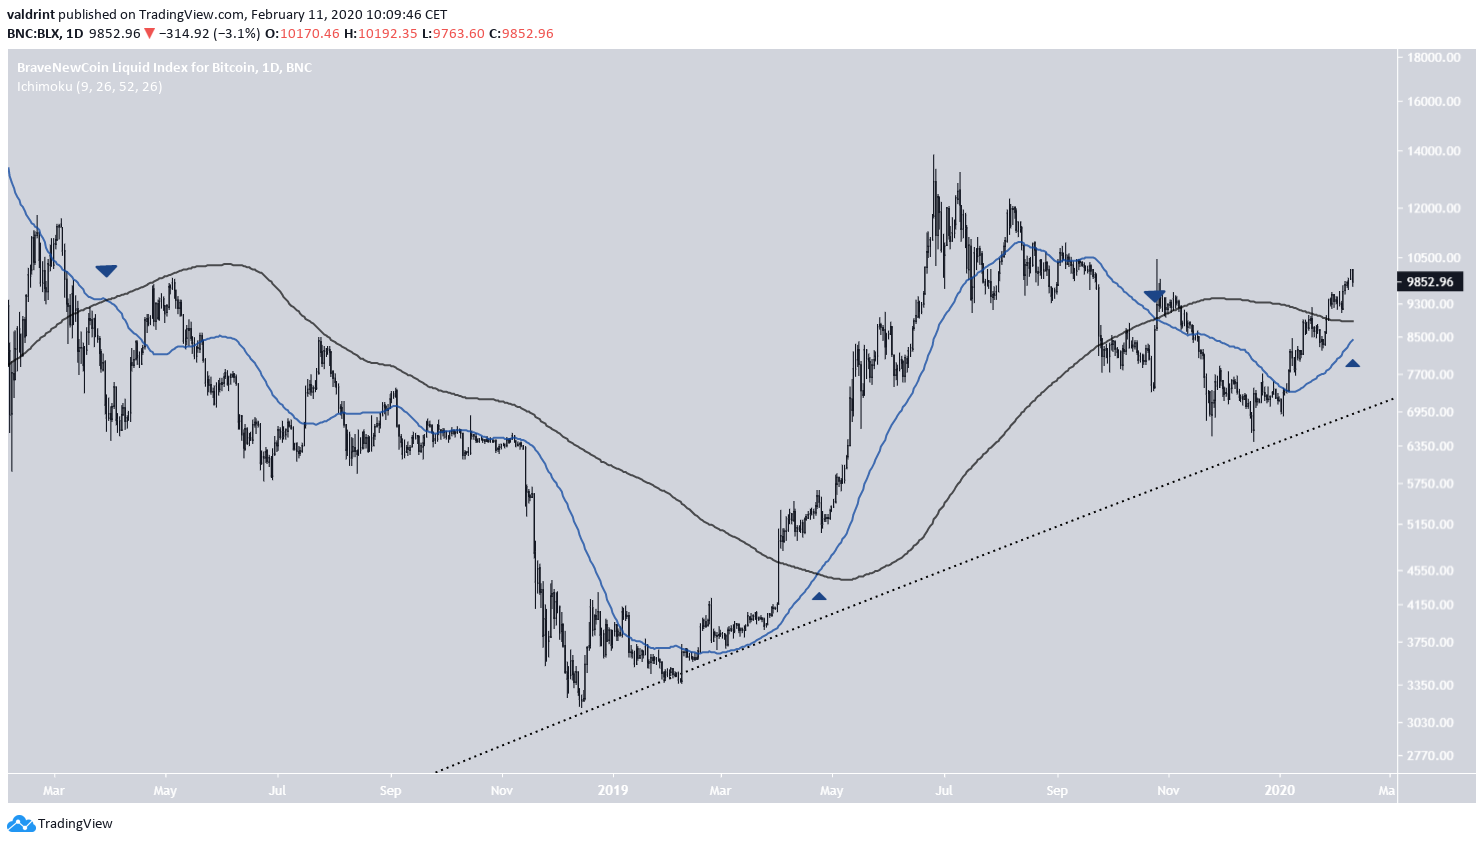
The Bitcoin price is trading above most daily and weekly moving averages. The previous time this occurred, the BTC price was engulfed in a solid upward trend.
Bitcoin Highlights
- The Bitcoin price is likely in a bullish trend.
- It is trading above significant daily & weekly moving averages.
- Numerous moving averages have made bullish crosses.
Trader and analyst @filbfilb outlined a Bitcoin price chart with numerous moving averages (MAs) plotted in it. He states that the Bitcoin price is trading above all significant MAs in the daily and weekly time-frames.
https://twitter.com/filbfilb/status/1227011765990559746?s=09
Has this ever occurred prior to today? What does this mean for the future price movement? Continue reading below if you want to find out.
Weekly Bitcoin Moving Averages
For the weekly chart, we are going to use the following MAs:
- 10-week (red)
- 20-week (green)
- 50-week (blue)
- 100-week (white)
- 200-week (black)
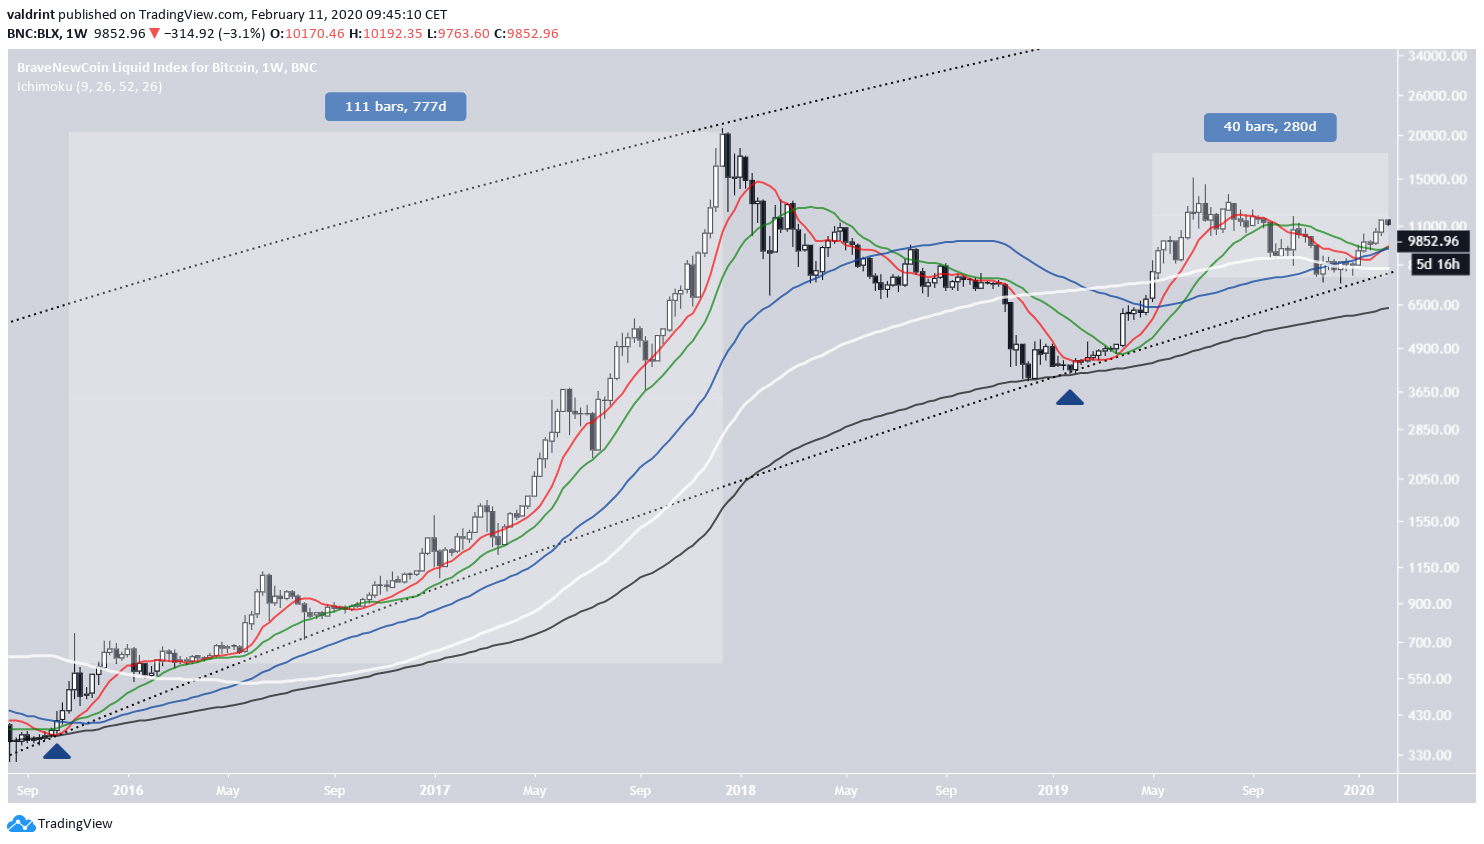
The Bitcoin price has been trading above all of them for the past six weeks and, if we discount the relatively short-term 10- and 20-week MAs, it has been trading above the rest since April 2019.
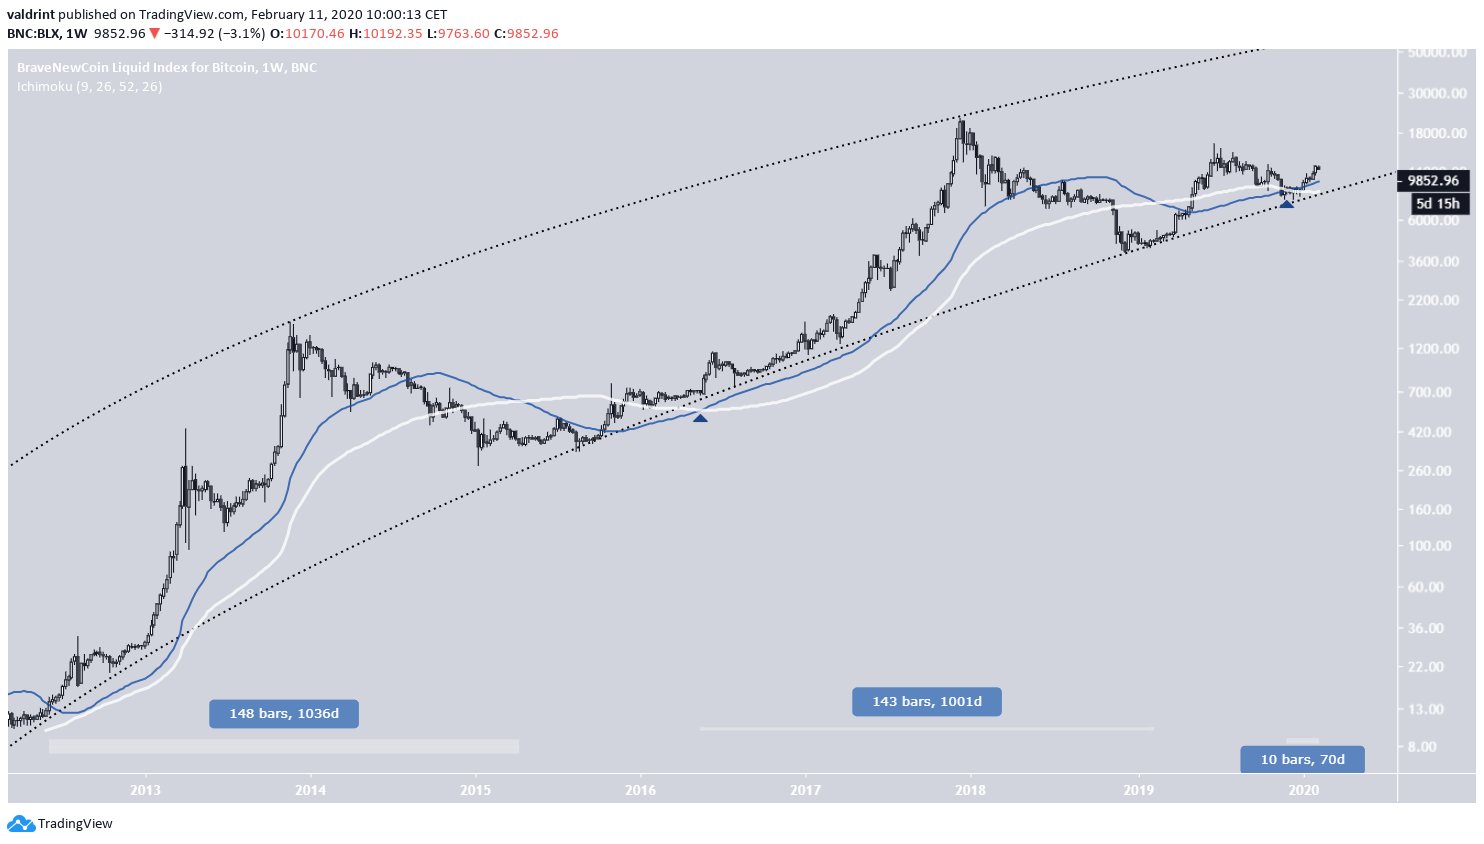
The previous time the price traded above all these MAs was the period from December 2015-2017, which was the preceding bullish market.
Another similarity is that the 2015 movement began after a bounce on the long-term logarithmic growth curve (dashed) and the 200-day MA — the same catalyst that began the current upward movement in December 2018.
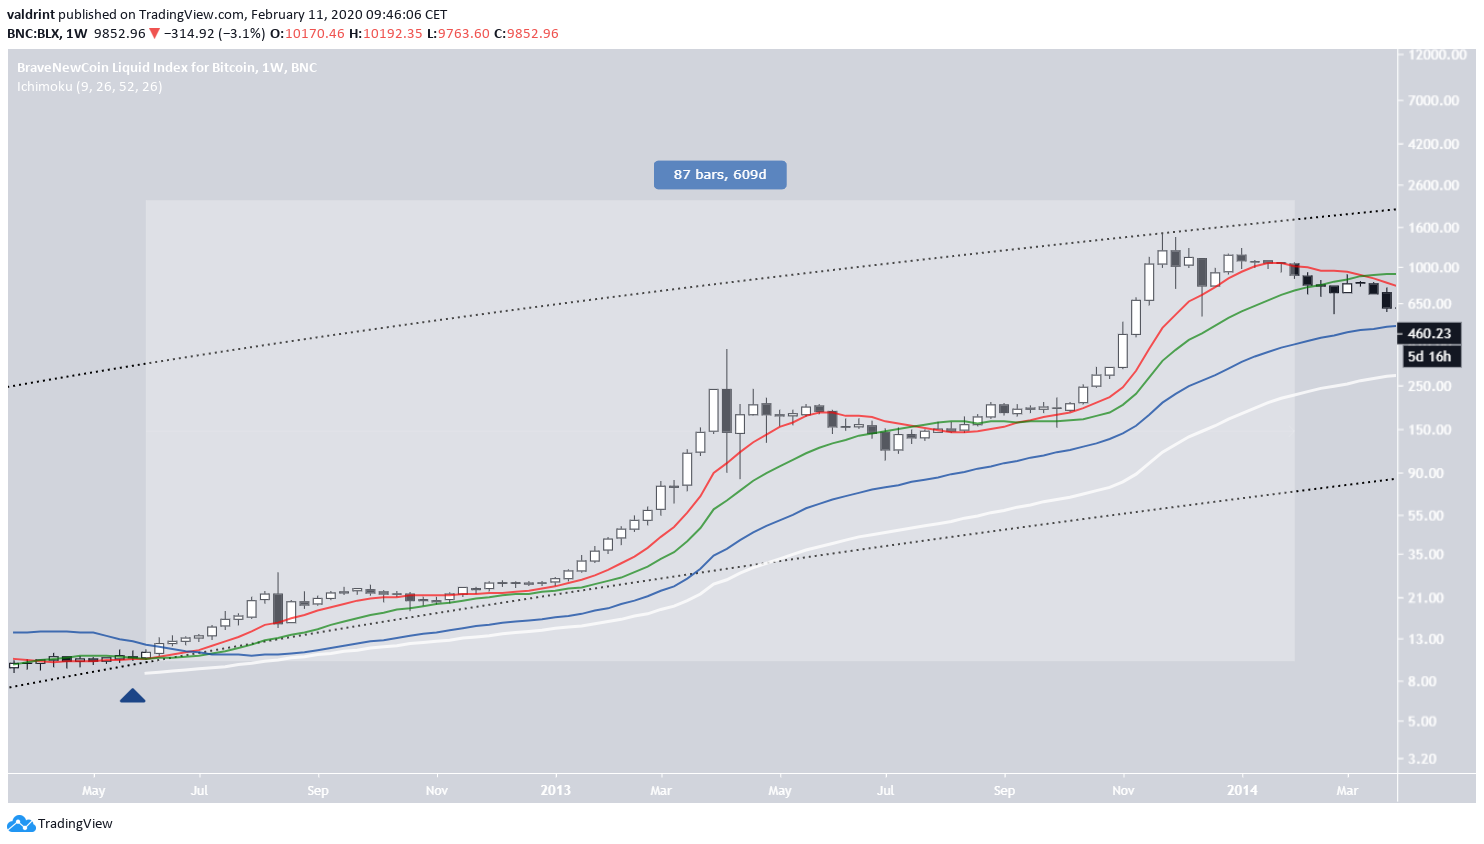
An almost identical scenario can be observed in 2012-2014.
The price bounced on the logarithmic growth curve in May 2012 and began an almost two-year-long upward trend, in which the price traded above these MAs — with the exclusion of the 200-week MA, which had yet to be plotted due to the lack of data points.
Also, there have only been two times when the 50-week MA made a bullish cross with the 100-week one, in May 2016 and December 2019. Both times, the bullish market cycle began shortly after — which was noted by the 50-week MA being above the 100-week one. This last characteristic occurred for around 1000 days in both prior bullish cycles but lagged slightly, meaning that it gave the signal for the beginning and end of the market a few months after the market reversed.
Currently, the 50-week MA is above the 100-week one and has been so for 70 days.
Going just by the historic relationship of the price and its weekly MAs and the MAs with each other, we can make the claim that the Bitcoin price is in a bullish trend.
Daily Moving Averages
For the daily chart, we are using the same period moving averages. The Bitcoin price has not respected them as much as the weekly ones, especially the short-term 10-, 20- and 50-day MAs.
However, the 100-day MA has been a good predictor of the direction of the trend, since during the times the price has been above it the trend has been bullish and vice versa.
In addition, it has intermittently offered support/resistance to the price.
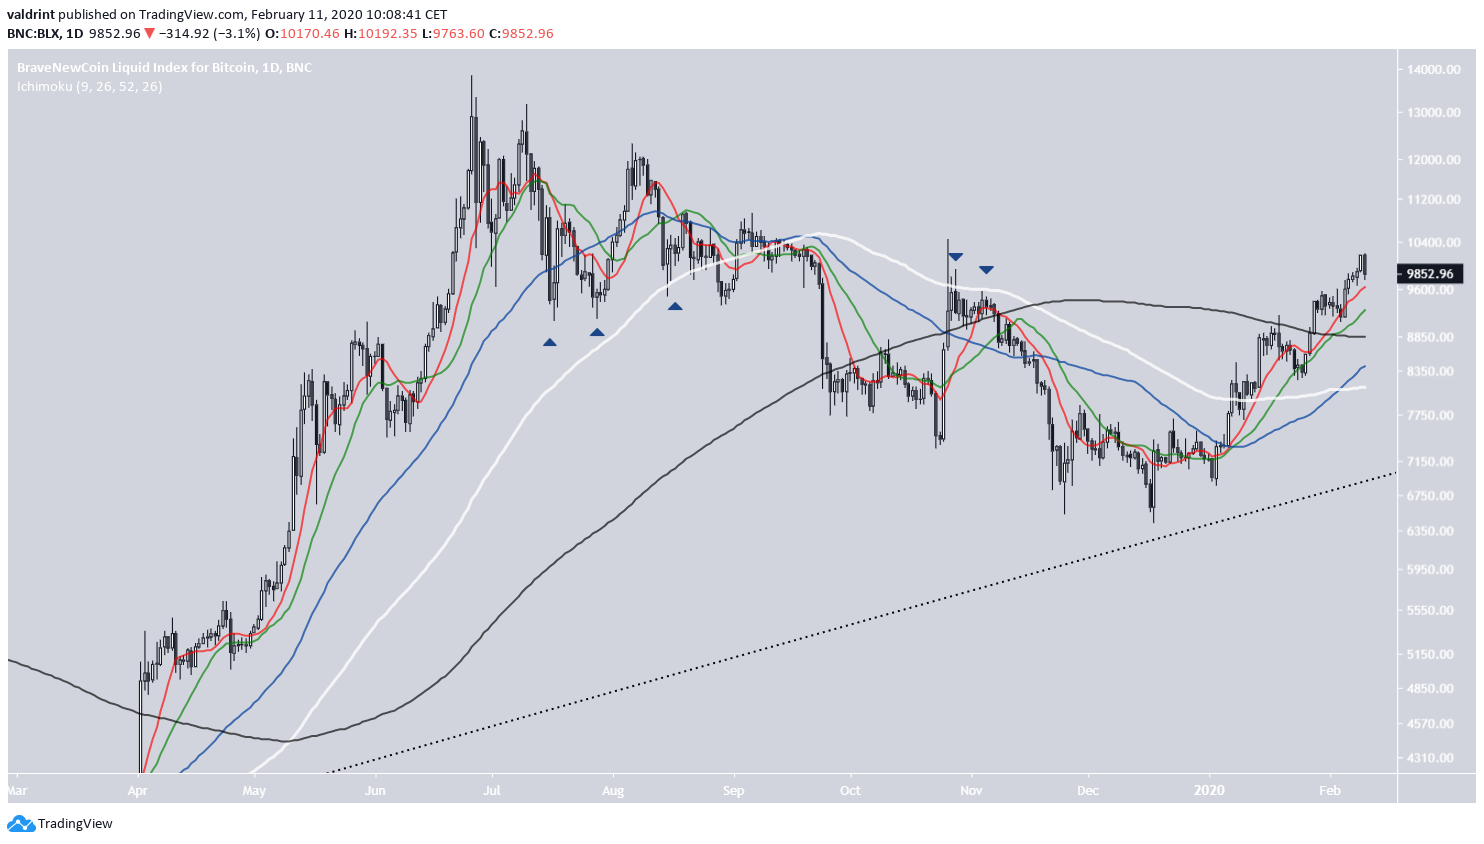
A more interesting relationship is that between the 50- and 200-day moving averages.
These MAs first made a bearish cross (a death cross) on April 2018, signaling that the Bitcoin price is in a downward trend and preceding a decrease from $9900 to $3100.
Afterward, a bullish cross between the same MAs (golden cross) transpired in April 2019, preceding a price increase from $5000 to $13,600.
Currently, the MAs are very close to making a bullish cross, and judging by the slope of the 50-day MA, it is almost a certainty that the cross will transpire soon, confirming that the price is in a bullish trend.
 Conclusion
The relationship of the Bitcoin price to its daily and weekly MAs has been historically relevant in determining the direction of the trend, especially when combined with the relationship of the MAs to itself.
Analyzing the current price and MAs, we can make the claim that the Bitcoin price is in the initial stages of a long-term upward trend, which could continue for two more years.


