


On July 9, the Bitcoin (BTC) price created a bearish engulfing candlestick and fell back inside the descending channel it had just broken out from.
This is a sign that the breakout was not legitimate and the price is likely to head lower.
Bitcoin Bearish Engulfing Candlestick
On July 8, the Bitcoin price increased above the resistance line of a descending channel that had been in place since June 1. This possible breakout indicated that the price is going higher, possibly towards the range high at $10,050.
However, BTC fell back inside this channel the next day, creating a bearish engulfing candlestick that also caused it to decrease below the $9,300 support area, which is also the middle of the range. The failed breakout suggests that BTC is likely to continue decreasing at the rate predicted by the channel.
While volume was not extreme, and the price did not reach a close below the 50-day moving average (MA), it is expected to pick up during a substantial drop below the MA.
The most likely target would be around $8,550, both the range low and the middle of the descending channel.
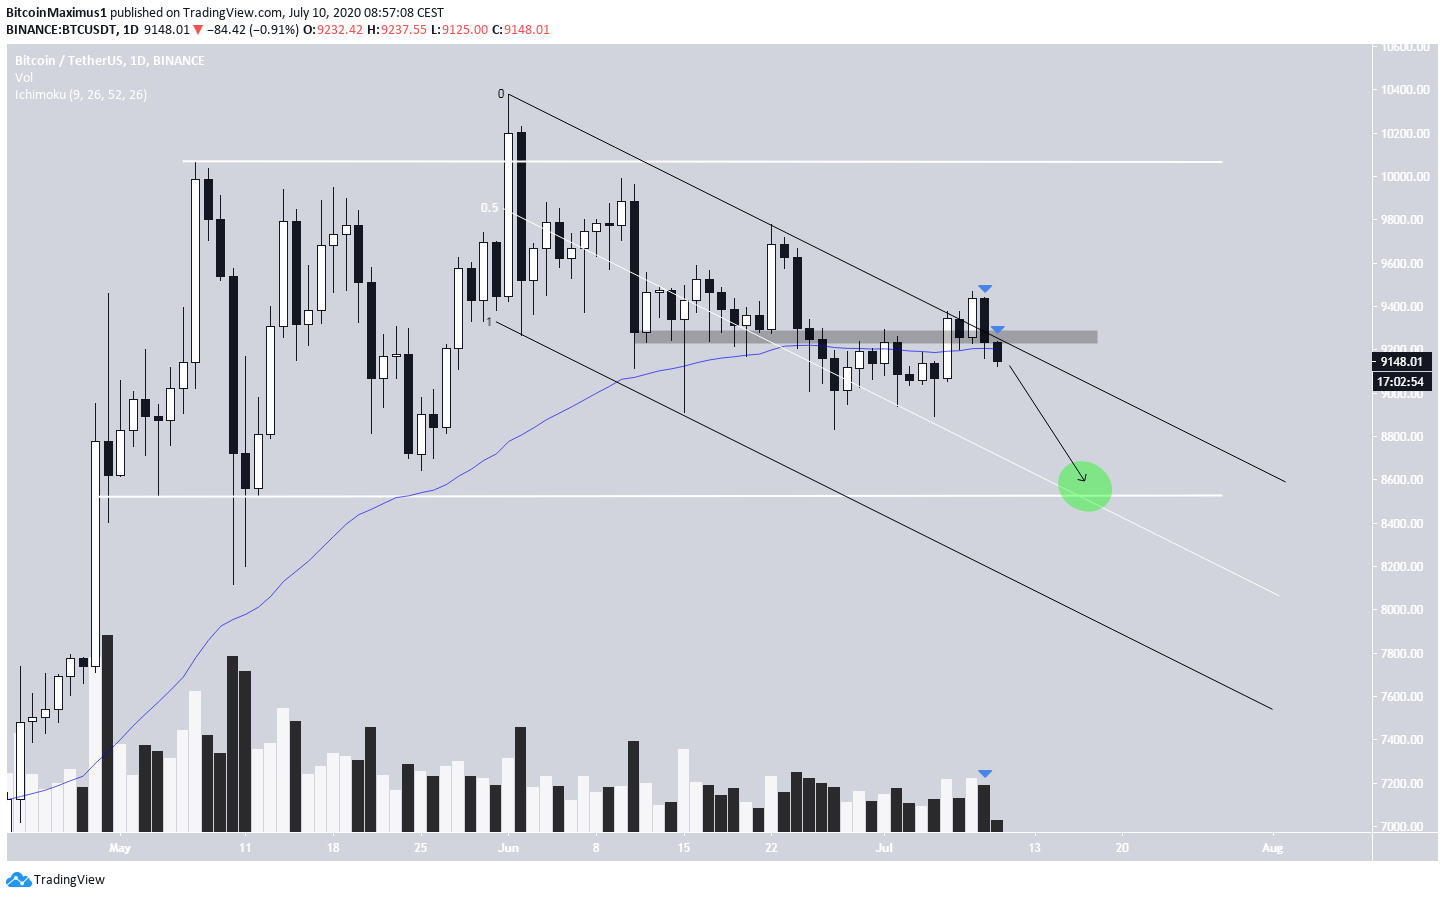
The bias is clearly bearish since previous resistance areas are failing to provide support, and are instead being broken through easily.
We saw this at the $9,250 and $9,170 areas, which failed to provide even the slightest of bounces. In addition, they have seemingly turned to resistance now.
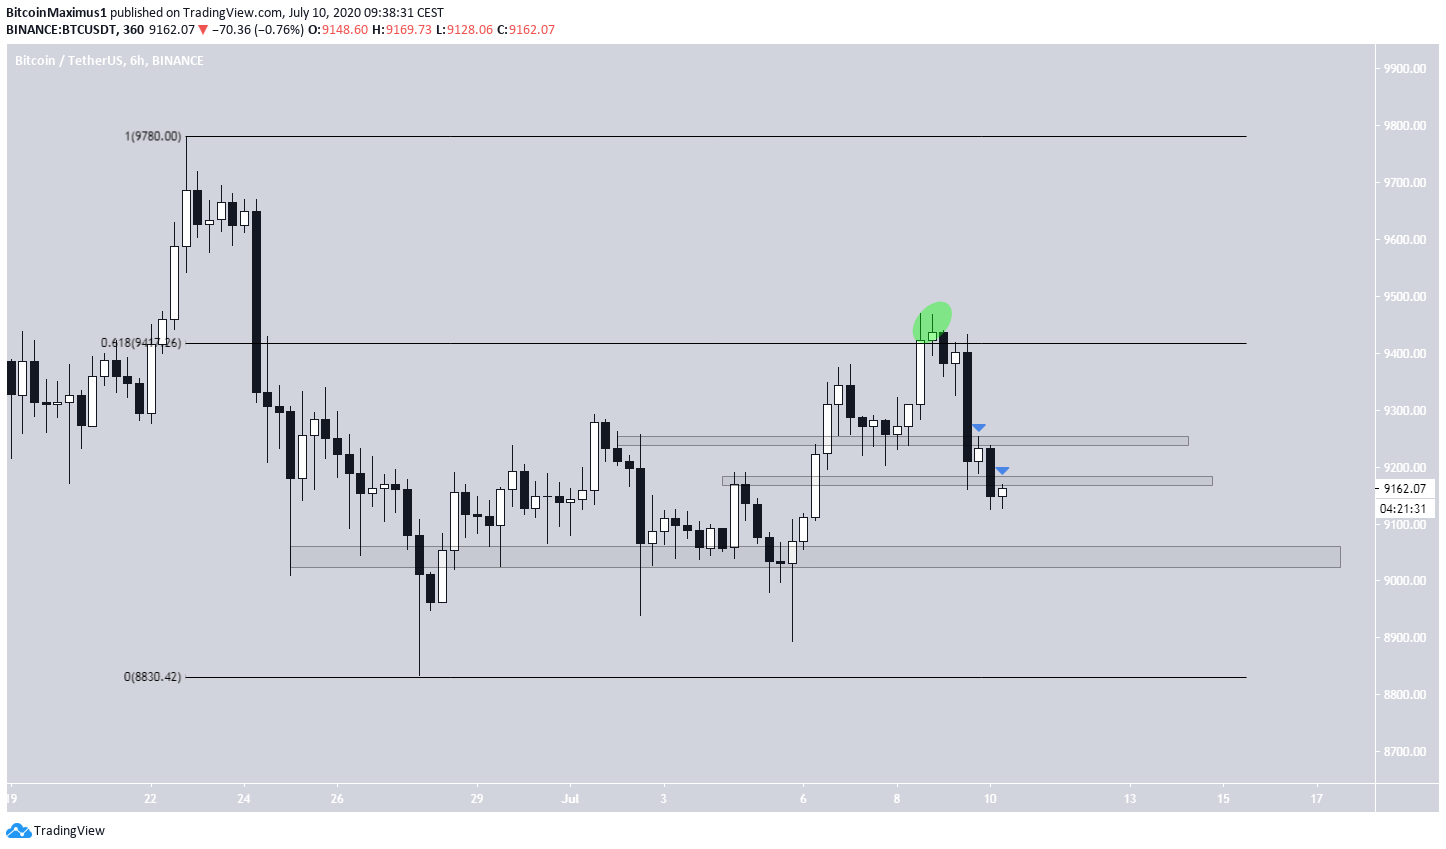
Furthermore, the July 8 increase above the 0.618 Fib level could not be sustained and led to an accelerated decrease afterward.
The closest support level that has yet to be tested this time around is found at $9,050.
Ascending Parallel Channel
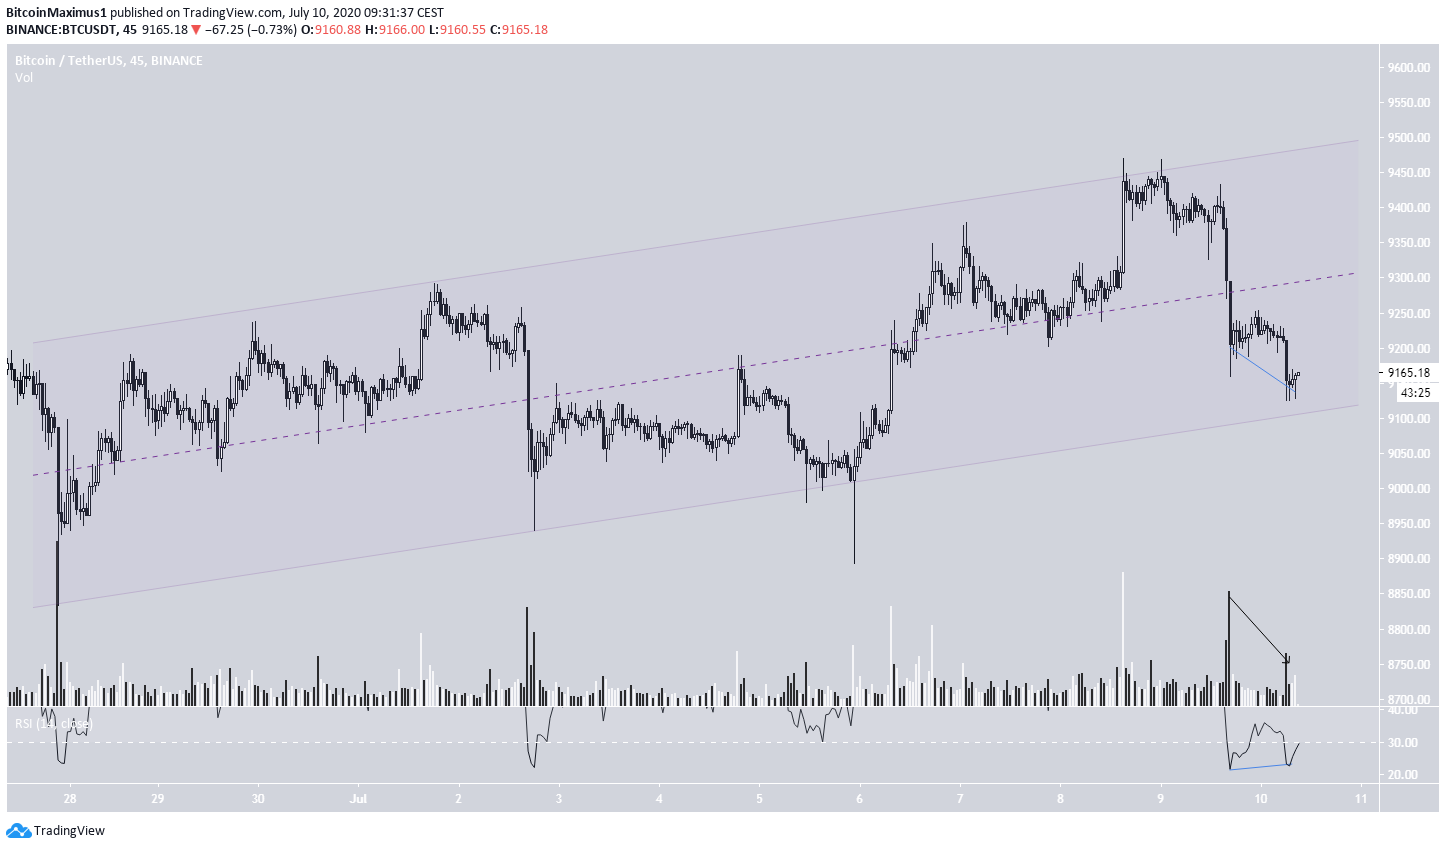
In the short-term, BTC is trading inside an ascending, parallel channel. It is currently very close to the support line of this channel.
Volume has been decreasing throughout the downward move, and there is some bullish divergence developing in the lower time-frame RSI.
So, we could see a short-term bounce that takes the price towards the middle of this channel, before it eventually breaks down.
A breakdown from the channel and the $9,050 support would indicate that the price is likely heading towards the range low.
For our previous analysis, click here.


