


Bitcoin (BTC) bounced on Dec. 22 and regained almost the entirety of its losses from the previous dip.
While the most likely scenario is that the trend is still bullish, BTC has not yet confirmed this.
Bitcoin Bounces from Range Lows
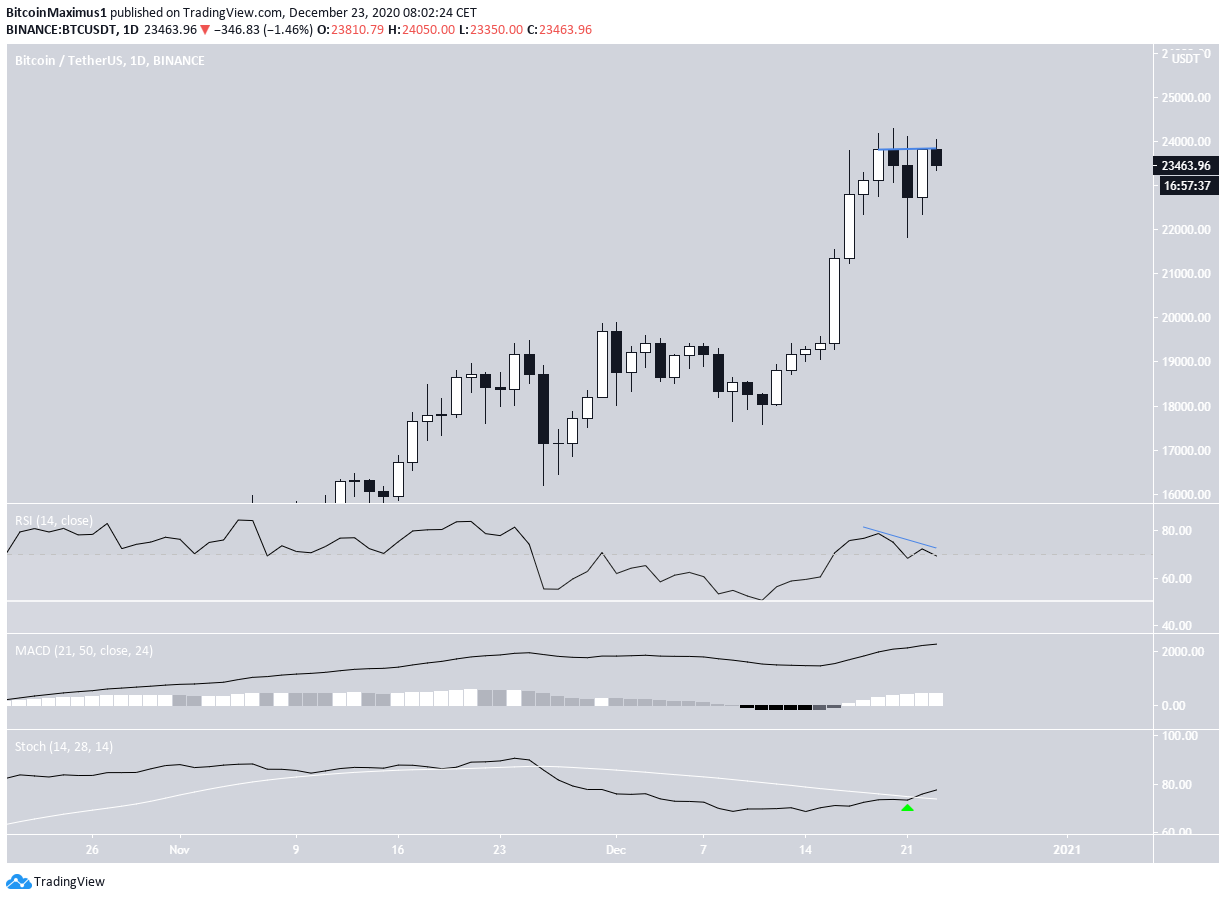
On Dec. 22, BTC bounced from the range lows and regained the majority of its losses from the past two days. BTC reached a high of $24,050 before decreasing slightly.
In response to the previous decrease, yesterday’s candlestick is bullish engulfing.
Technical indicators in the daily time-frame are still bullish despite the bearish divergence developing in the RSI. The Stochastic oscillator is moving upwards and the MACD has yet to make one lower momentum bar.
Future Movement
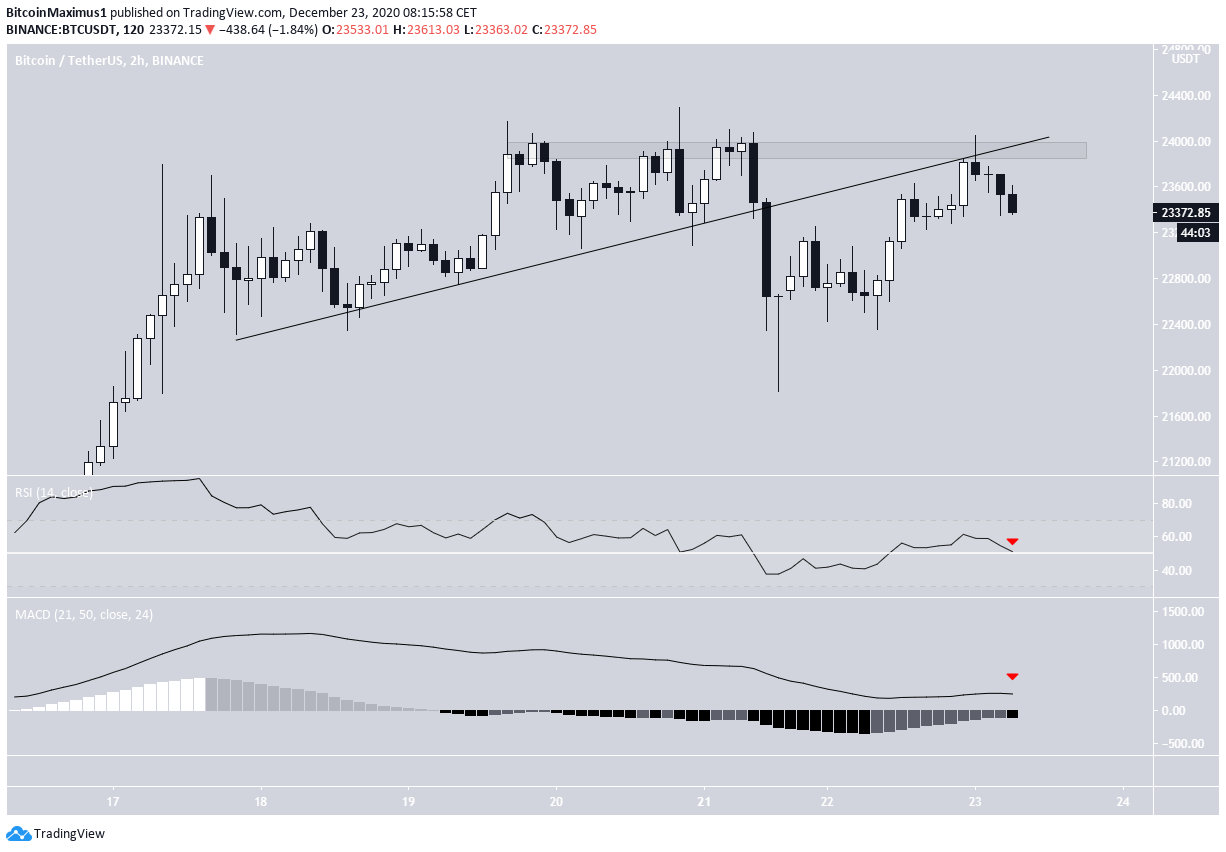
The two-hour chart shows that BTC has broken down from an ascending support line and validated as resistance after. This movement also validated the $23,900 area as a minor resistance level.
Technical indicators are still bullish, but not by much. The RSI is risking falling below 50 and the MACD below 0. If this were to happen, it would likely mean that the short-term trend is bearish.
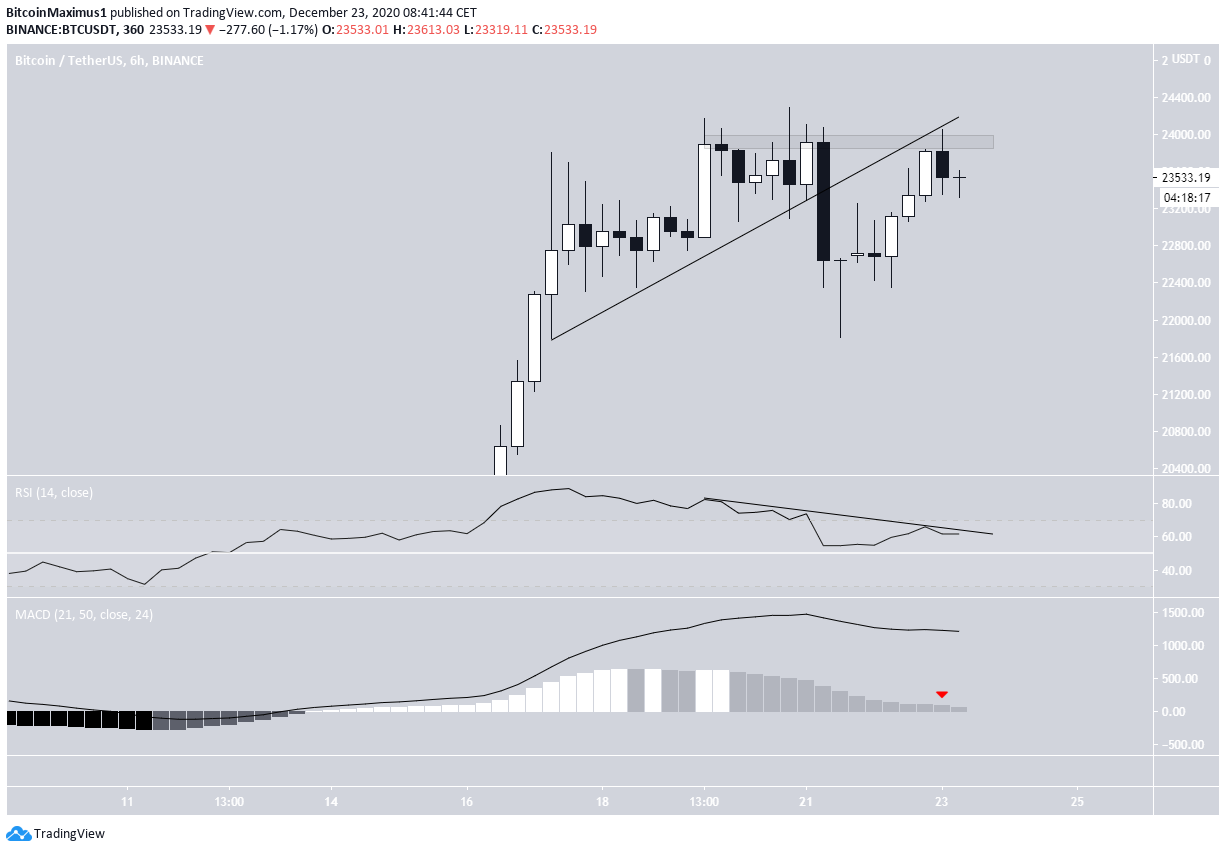
The same thing is visible in the slightly higher six-hour time-frame.
The RSI is following a descending resistance line and the MACD has almost turned negative.
Therefore, BTC needs to clear the $23,950 area in order to be considered bullish.
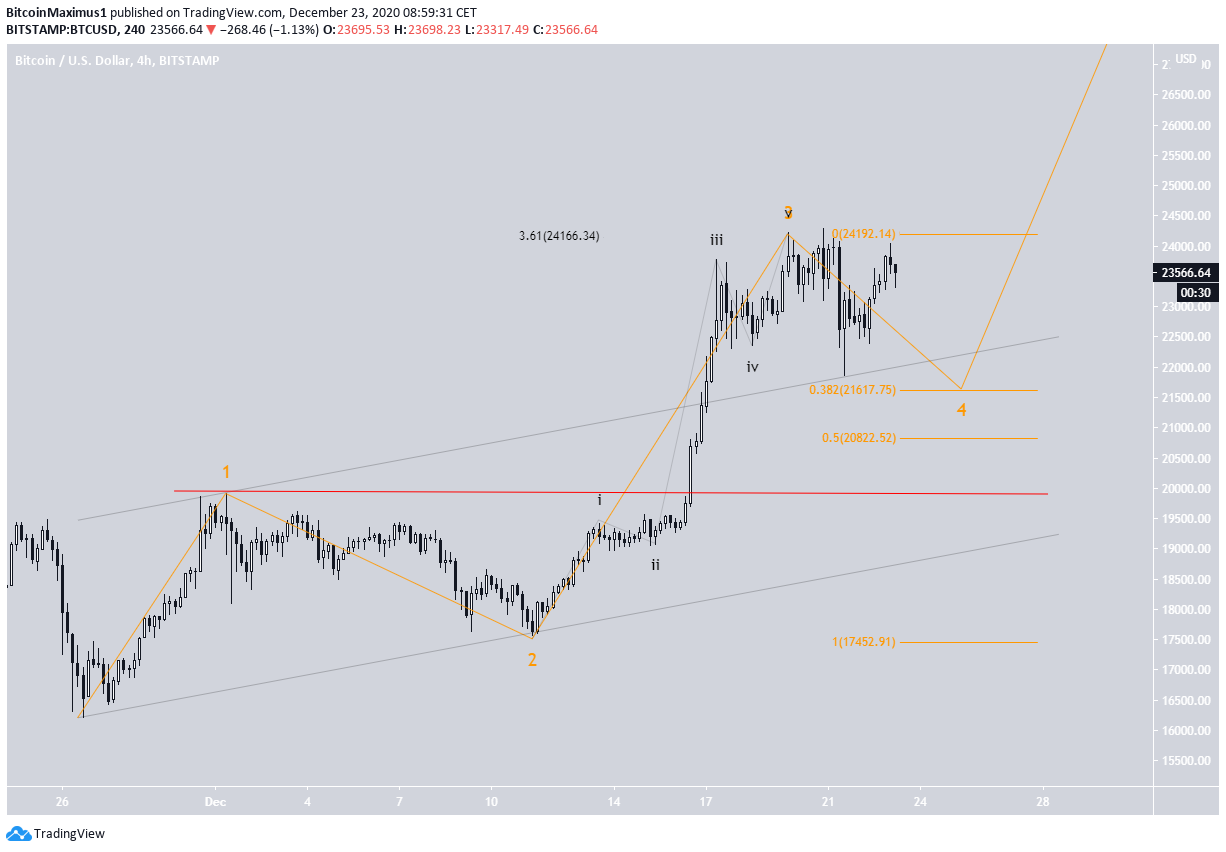
Wave Count
Yesterday’s bounce nearly confirmed the possibility that the previous low was a fourth wave pullback. BTC appears to have now begun sub-wave 5 (black), which completes a larger wave 3 (orange).
If correct, the move would be expected to end near $26,000.
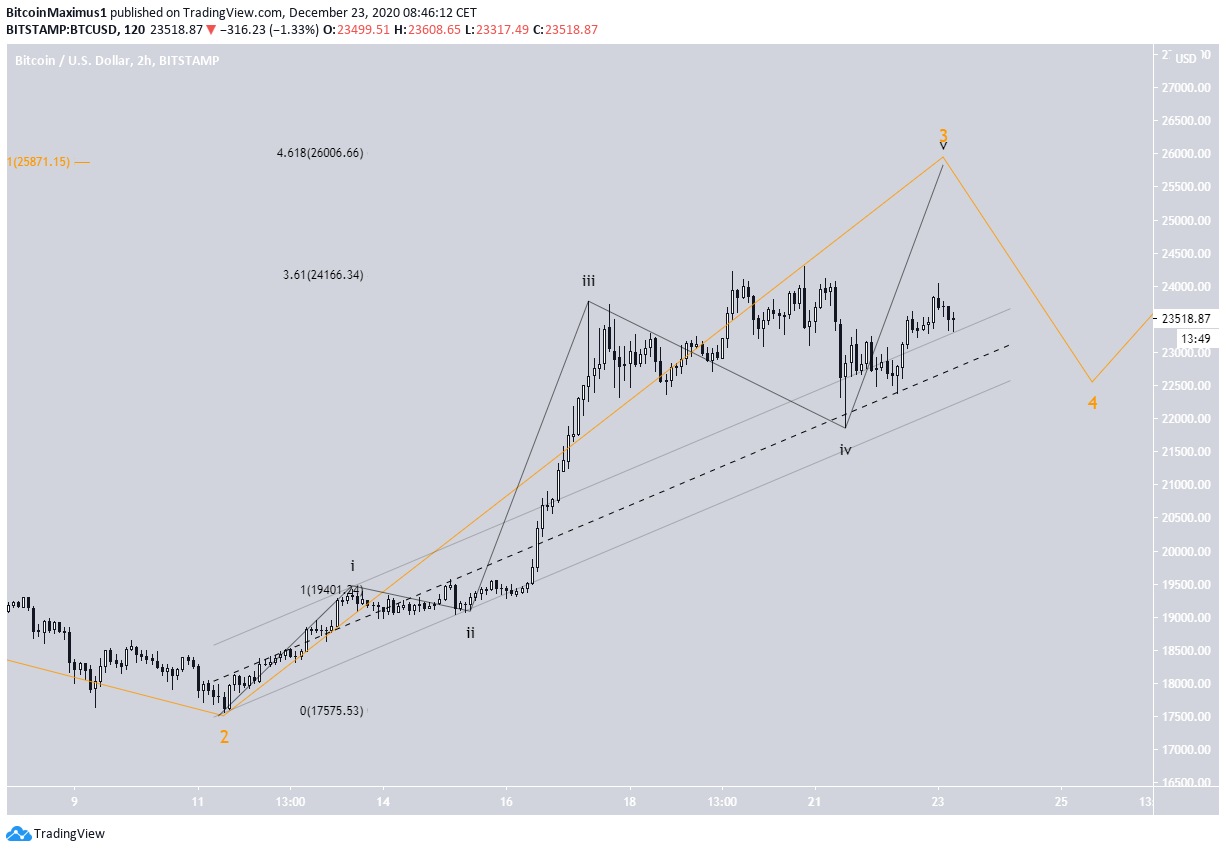
However, an alternative count suggests that BTC has completed wave 3 and has now begun its correction inside wave 4.
As stated in BeInCrypto’s Bitcoin analysis from Dec. 22:
“Even in this case, we would expect wave 4 to be shallow and swift due to the principle of alternation.”
Therefore, BTC would be expected to reach a low near $21,600, with a possible low deviation to $20,800.
In any case, a decrease below the wave 1 high of $19,918 (red line) would invalidate both bullish counts.
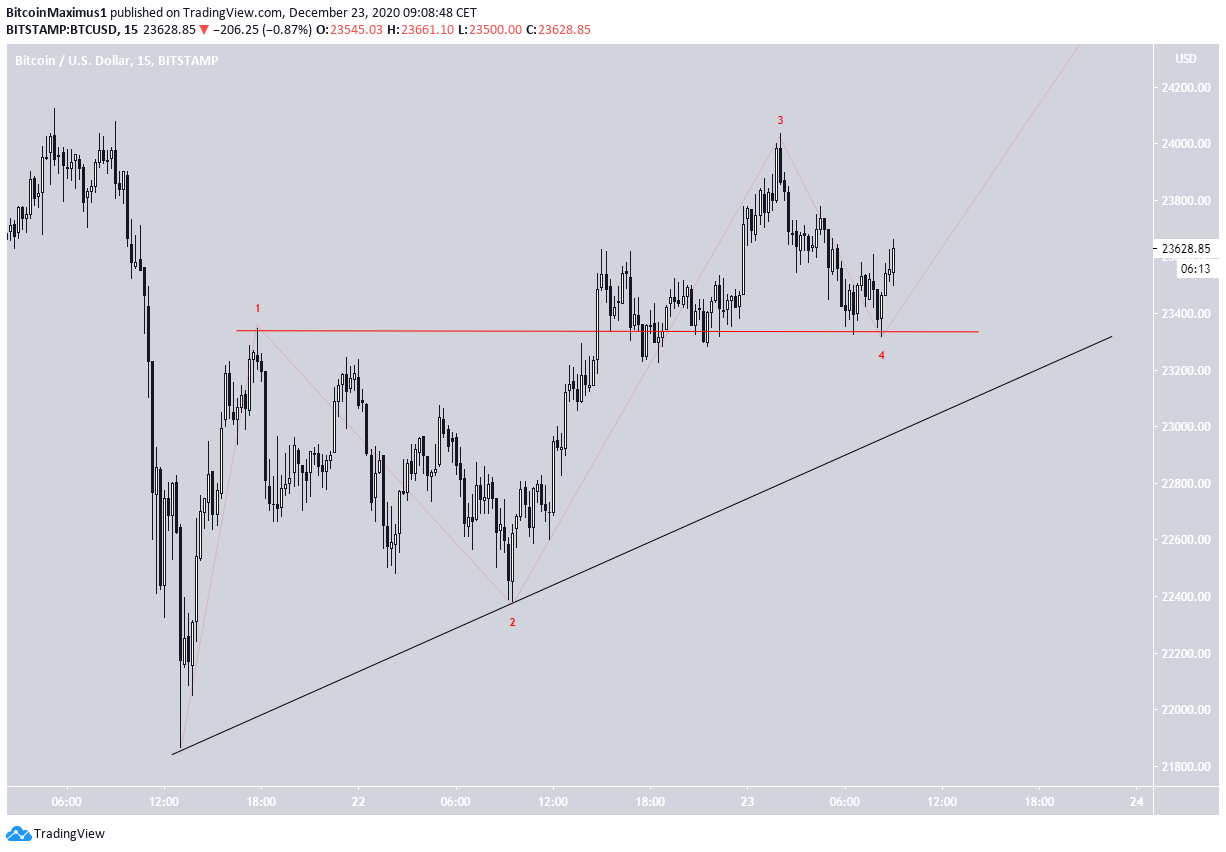
The issue with the bullish count is that wave 4 has crossed into wave 1 territory, hence invalidating that this is a bullish impulse. It may be possible that BTC is following a 1-2/1-2 wave count.
However, a breakdown from the ascending support line at $23,000 would invalidate this scenario.
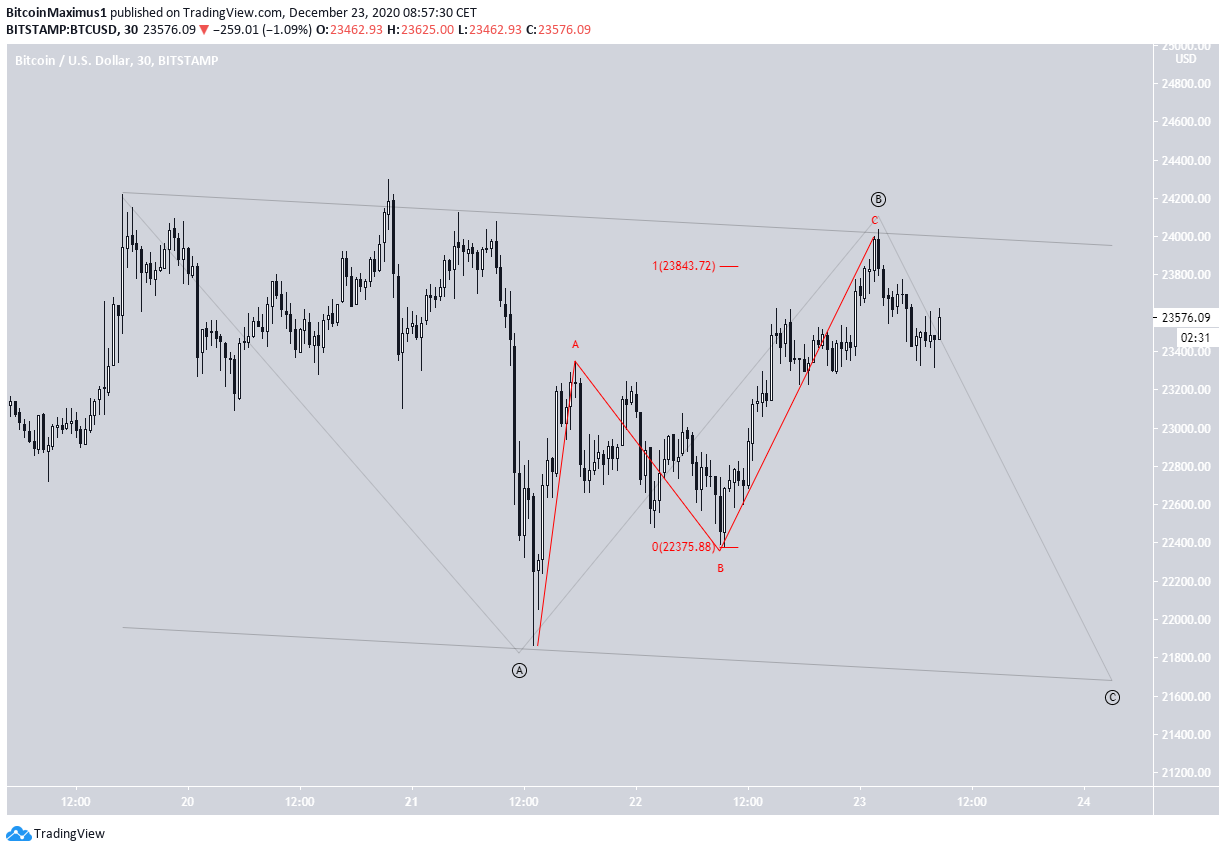
In that case, the increase is likely an A-B-C corrective structure (shown in red) which completes a larger B wave (black). A correction would be expected to follow.
This correction could take BTC back to the $21,600 area as outlined above.
Conclusion
While the longer-term BTC trend is still bullish, it is currently unclear if Bitcoin has finished its short-term correction or if there is one more low remaining.
Reclaiming the $23,900 area would suggest that the short-term correction is done and BTC is heading towards $26,000. The loss of $23,000 would likely indicate that BTC is heading back to the $20,800-$21,600 range.
For BeInCrypto’s previous Bitcoin (BTC) analysis, click here!
Disclaimer: Cryptocurrency trading carries a high level of risk and may not be suitable for all investors. The views expressed in this article do not reflect those of BeInCrypto.


