


Bitcoin has been grinding higher, with price edging above $74,000 this week in a move that signals rising demand. The upward trajectory looks constructive on the surface, but underlying dynamics reveal a more complex picture.
Several bearish indicators suggest the current advance is not yet a confirmed reversal, and caution remains warranted.
Bitcoin Is Looking At A Repetition Of The Past
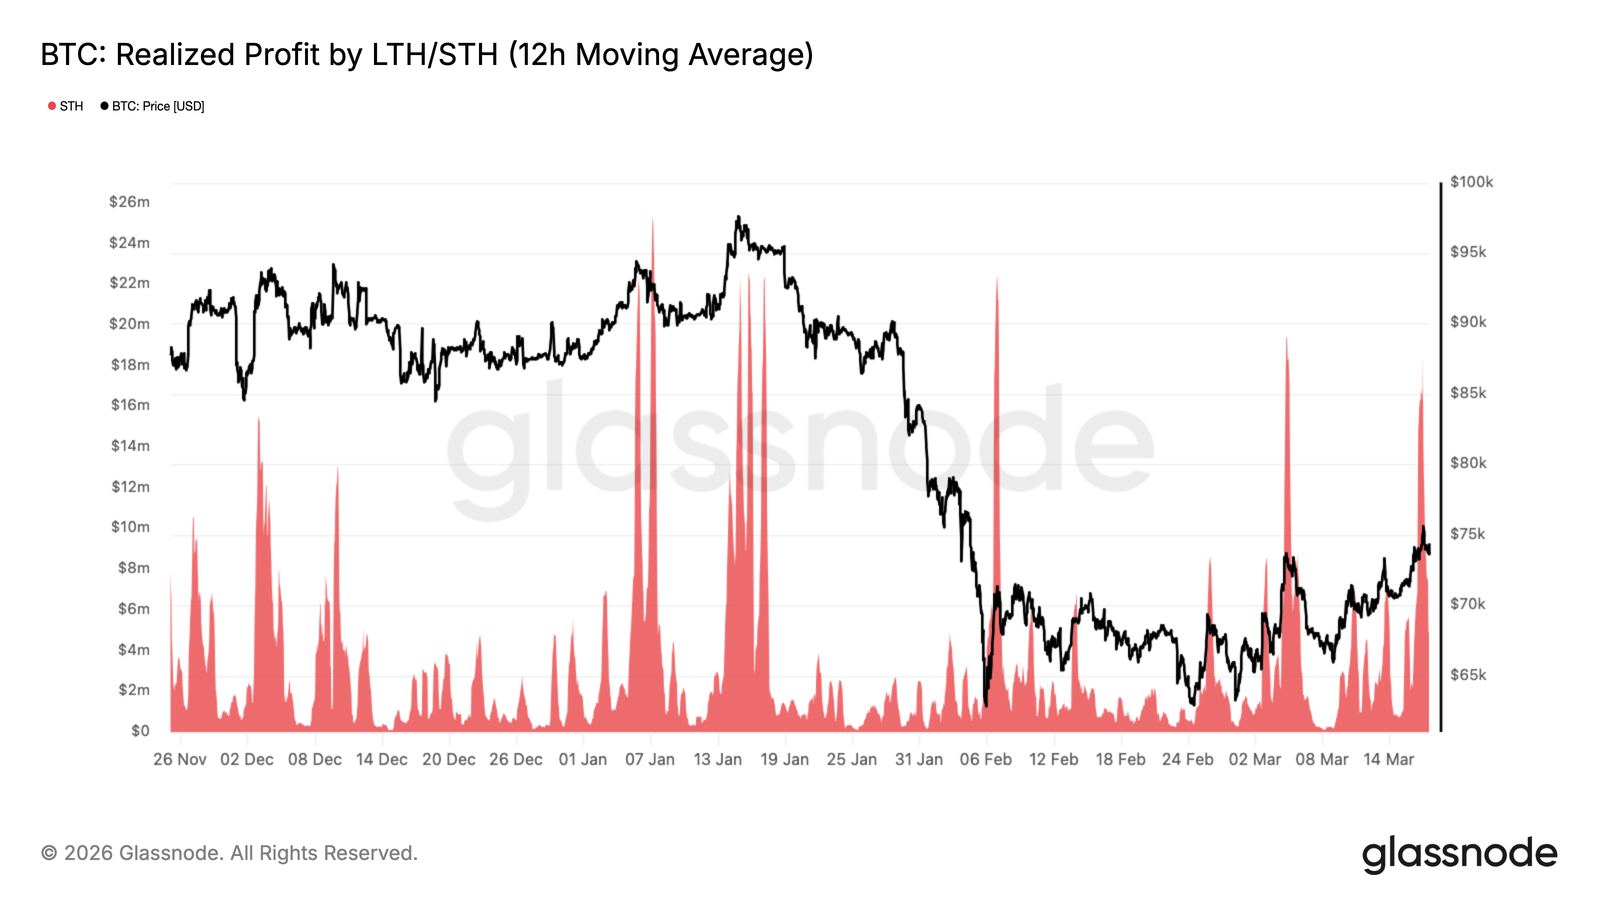
As Bitcoin pushed above $74,000 this week, the 12-hour simple moving average of short-term holder realized profit spiked to $18.4 million per hour. This elevated reading mirrors the pattern observed throughout February, when STHs consistently sold into rallies above $70,000. Each time the price edged higher, profit-taking from recent BTC buyers exhausted the momentum before a sustainable breakout could develop.
This behavior reflects a defining characteristic of early recoveries in bear market regimes. Recent buyers prioritize exiting positions over holding through resistance levels. Their tendency to treat price strength as an exit opportunity rather than a signal to accumulate creates a structural ceiling that prevents rallies from compounding into sustained breakouts.
Want more token insights like this? Sign up for Editor Harsh Notariya’s Daily Crypto Newsletter here.
Should the market successfully absorb this sell pressure and hold above $70,000 over the coming weeks, higher targets would become increasingly viable. The True Market Mean at $78,000 and the upper band of the current air gap near $82,000 represent the next meaningful objectives. Achieving either level would require STH selling pressure to diminish meaningfully from current rates.
Can Investors Absorb The Selling?
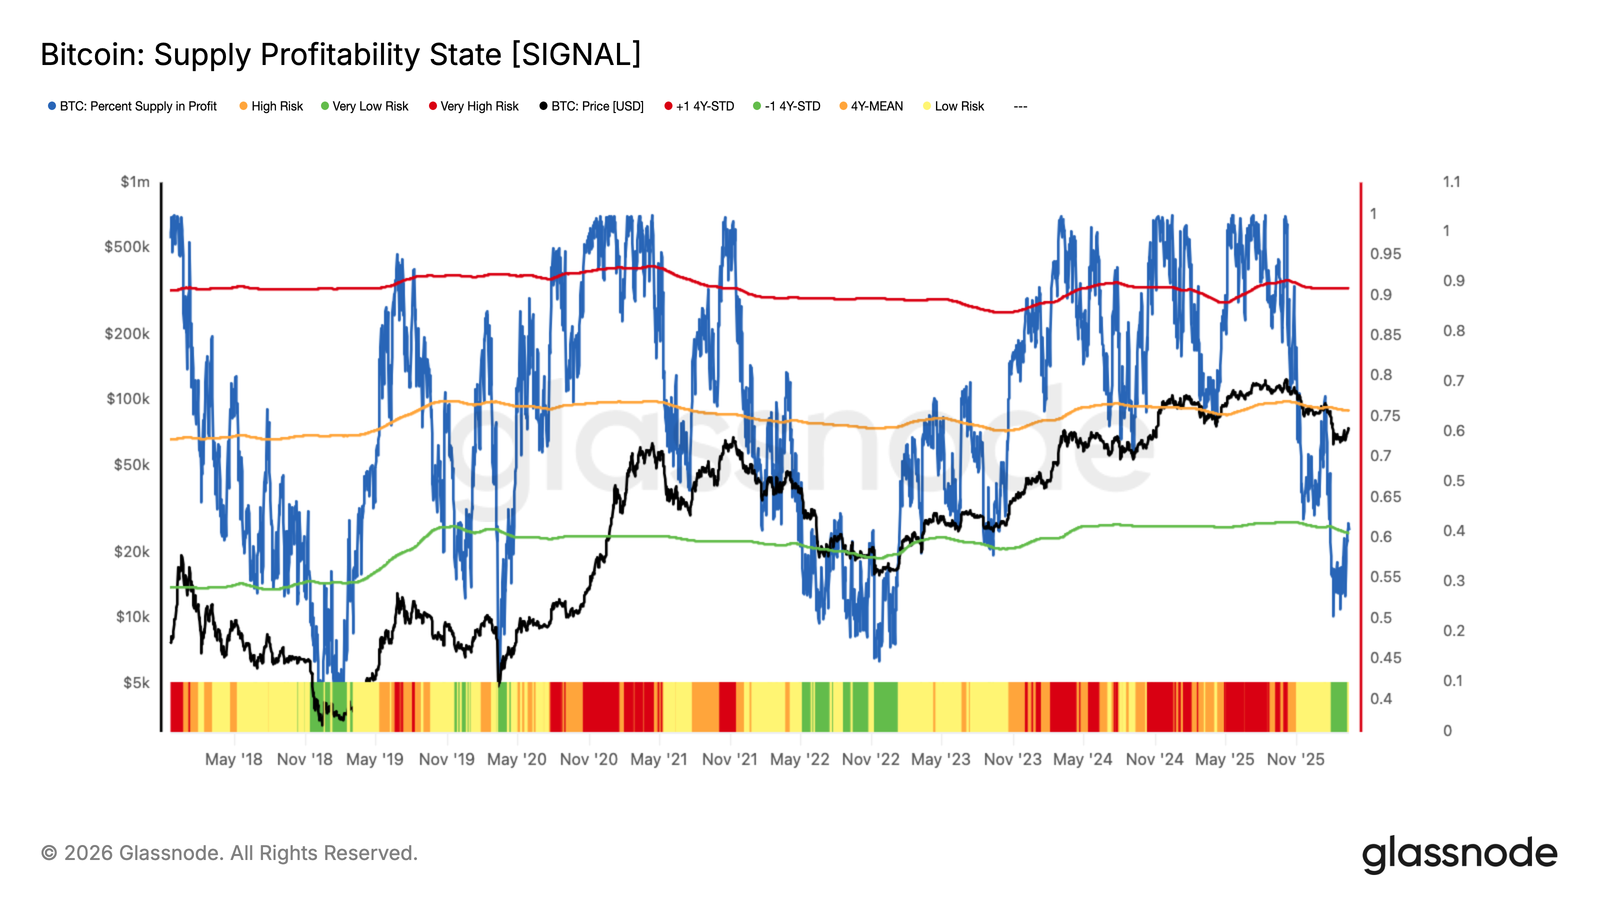
The Supply Profitable State indicator has climbed to approximately 60%, reaching a level consistent with early bounce attempts observed at comparable points in prior cycle bottoms. Historically, recoveries from deep bear markets into early bull conditions have been validated by this metric climbing from below its negative one standard deviation threshold toward its long-run mean of approximately 75%.
The current reading of 60% places Bitcoin precisely at a historically significant inflection point. Previous cycles have shown that market exhaustion frequently occurs at first recovery attempts from this level. The indicator’s position neither confirms nor denies a sustained recovery, but it does align with the pattern of bear market bounces that stall before transitioning into genuine bull market conditions.
A sustained push above 75% would carry significantly more weight as a confirmation signal. Crossing that threshold would indicate that the proportion of supply in profit has moved beyond the early recovery range and into territory historically associated with confirmed bull market conditions. Continued rejection near 60% would reinforce the bear market recovery narrative and validate the cautious interpretation of current price action.
BTC Price Might Note Some Drawdown
Bitcoin price is trading at $70,879, sitting below the $72,294 resistance level. The crypto king failed to sustain its push above $75,000 earlier this week, a development that underscores the persistent selling pressure from short-term holders at elevated price levels. Price is currently moving within an ascending channel, providing near-term structural guidance.
Downward pressure could send Bitcoin below $70,000 and through $68,830, testing the ascending channel’s lower trendline. A breakdown below that boundary is unlikely but would expose BTC to a decline toward $66,224. This would represent a meaningful setback for the recovery thesis.
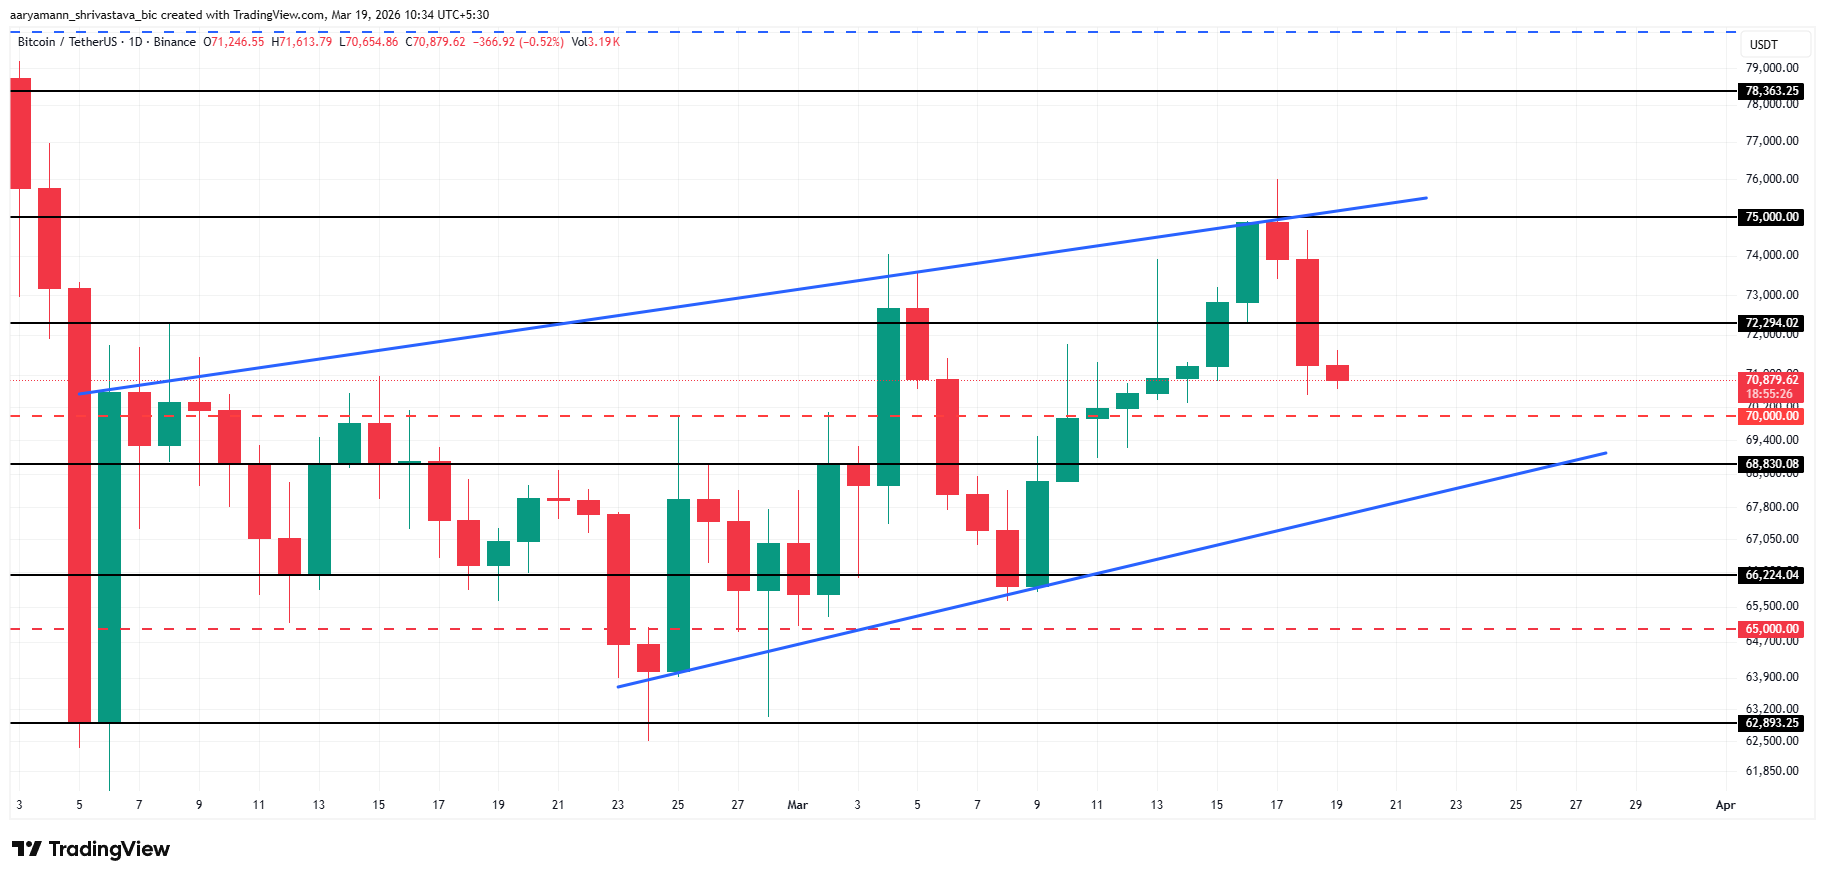
Accumulation at the $70,000 psychological support level offers the constructive alternative. Thus, a confirmed bounce from that zone could push BTC price back toward $75,000, and securing that level as support would invalidate the bearish thesis entirely.


