


![Bitcoin Price Analysis: Two Trade Setups for BTC/USD [Premium Content]](/_mfes/post/_next/image/?url=https%3A%2F%2Fassets.beincrypto.com%2Fimg%2FBDH-LM4AppOi7u0EfblrpObt9u4%3D%2Fsmart%2F0e3e7ed84f1a4a9b9e5e74f6941e1418&w=1920&q=75)
In this subscribers-only article, we are going to analyze the current Bitcoin (BTC) price movement and decide whether BTC has made a bearish triple top or a bullish ascending triangle. Additionally, we are going to present two trade setups.
Triple Top
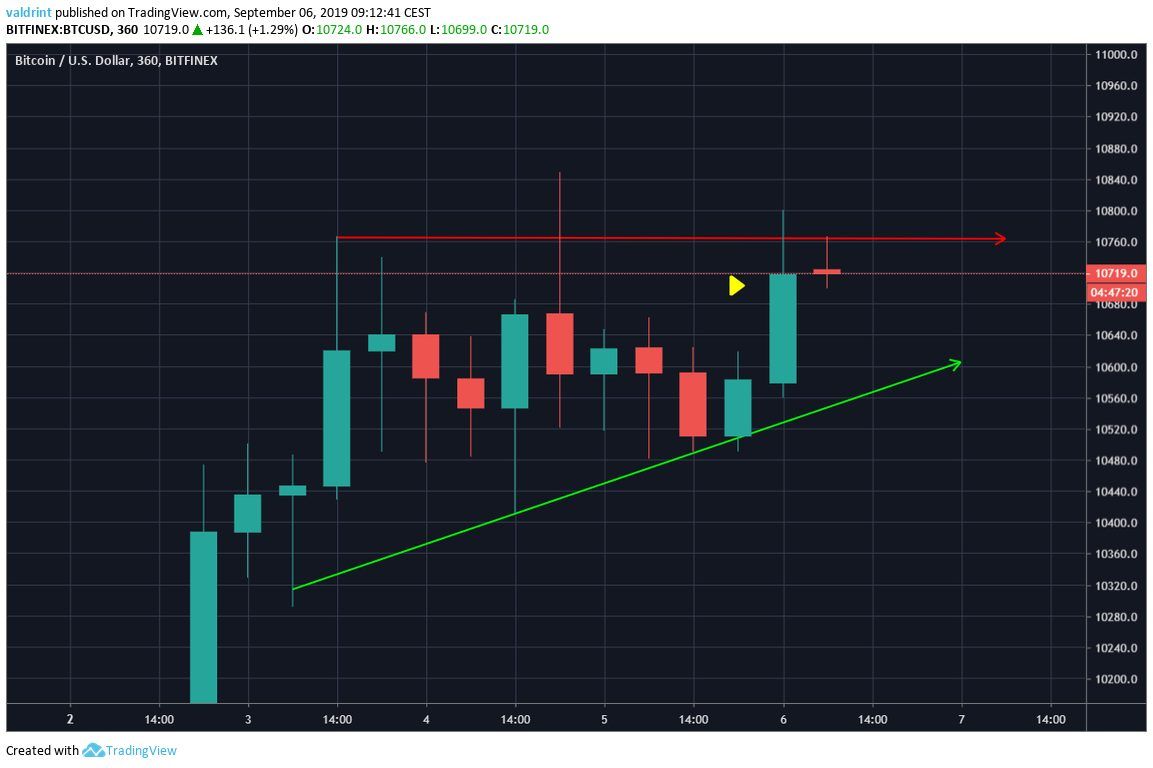
The price movement since September 2 shows a developing triple top in the price of Bitcoin, with three near-identical highs of $10,750.
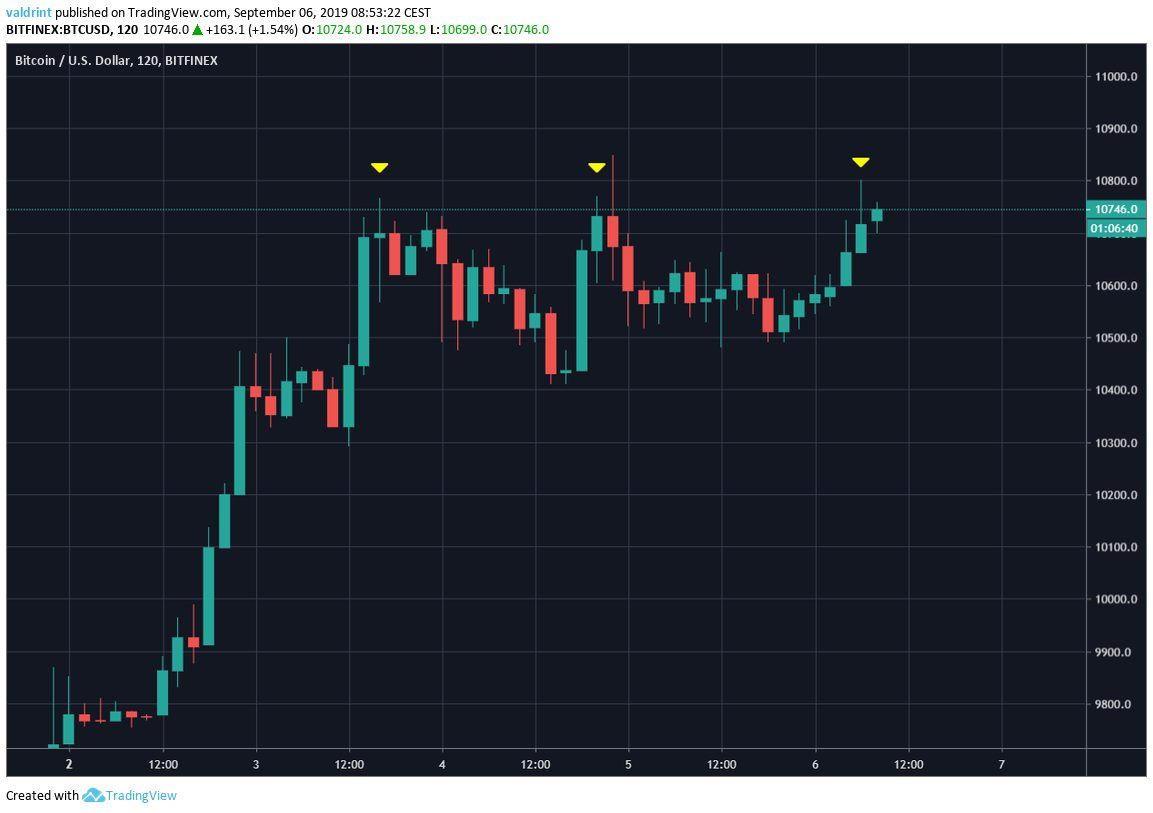
The triple top is a bearish pattern, making a Bitcoin price breakdown more likely.
Since there is no support line, we have presented the nearest support area below. It is found near $10,400. A breakdown below it could trigger a rapid price decrease.
Additionally, the possibility of the triple top is supported by a look at the RSI.
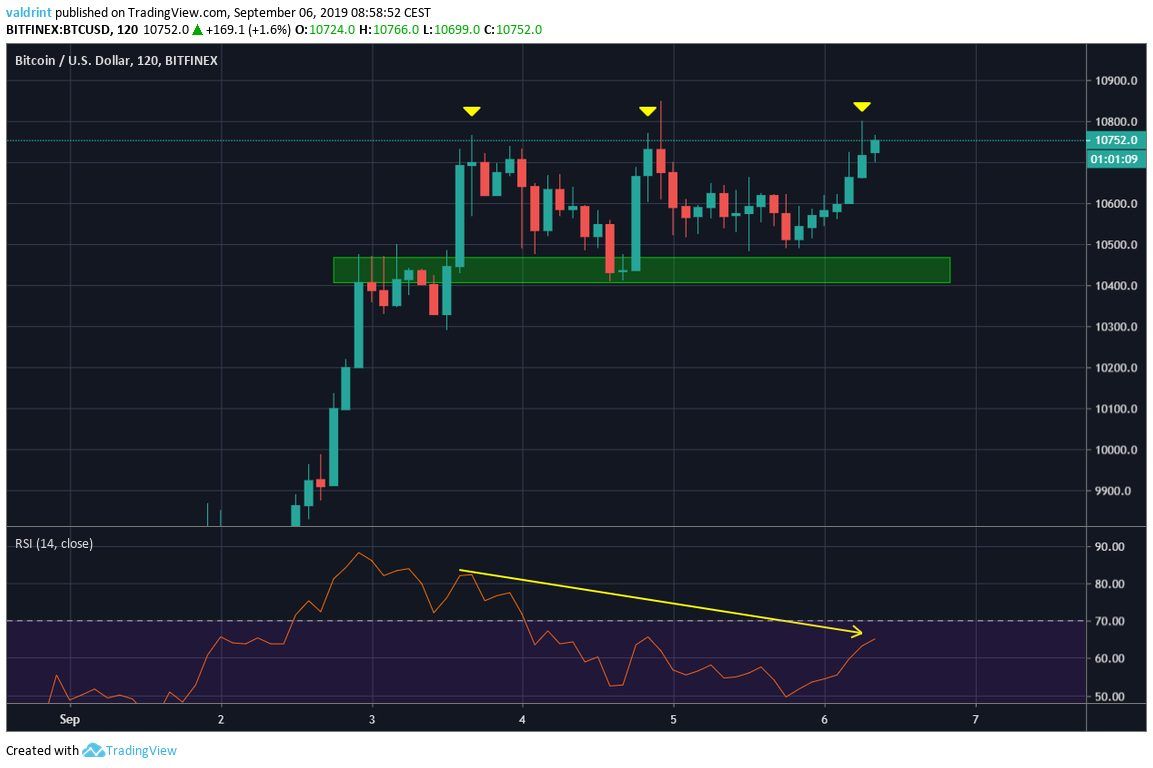
It has been generating a bearish divergence since the creation of the first top. This is a bearish sign and often precedes price decreases.
Ascending Triangle
However, the Bitcoin price movement also resembles an ascending triangle.
The ascending triangle is considered a bullish pattern — making a price breakout more likely.
The horizontal resistance line is traced at the three near-identical highs.
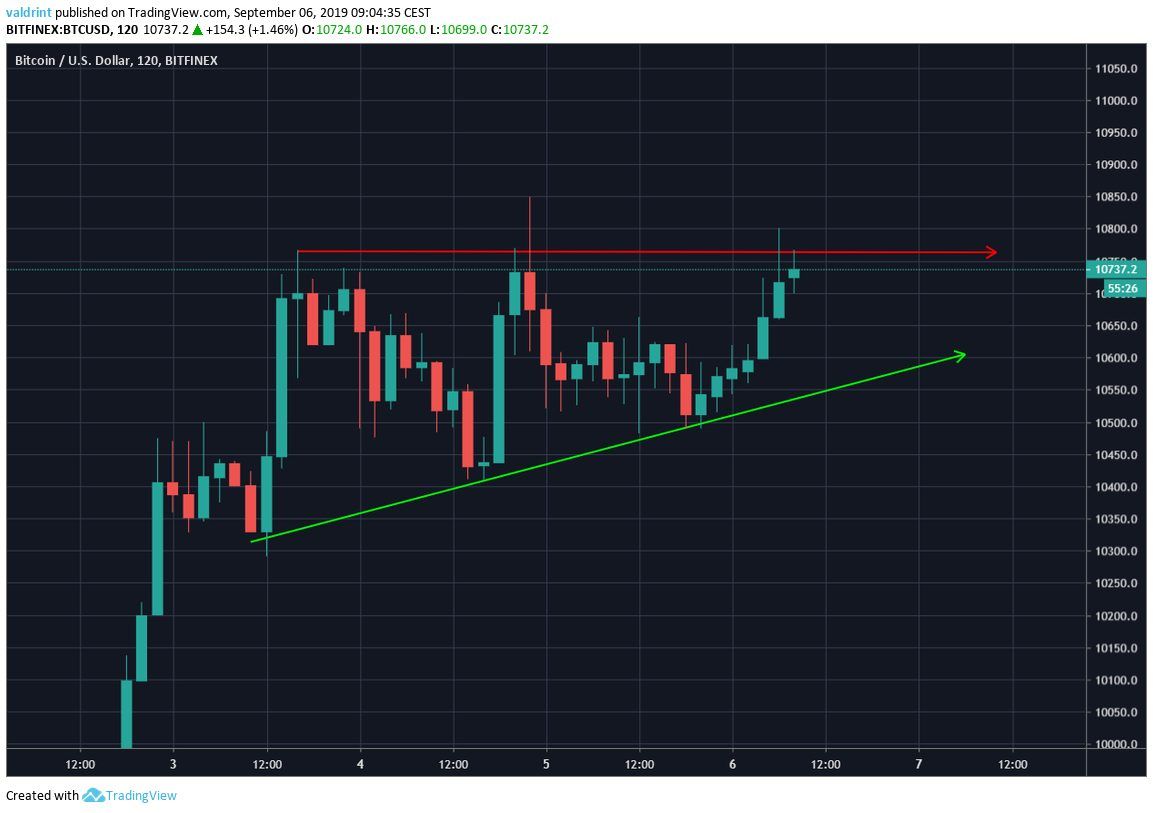
The low of $10,291 on September 3 gives us the beginning of the support line.
The Bitcoin price has made two other higher lows — which complete the ascending support line.
In the previous section, we discussed the presence of bearish divergence. While that is indeed true, a closer look at the RSI reveals that the trend line of the divergence has been broken
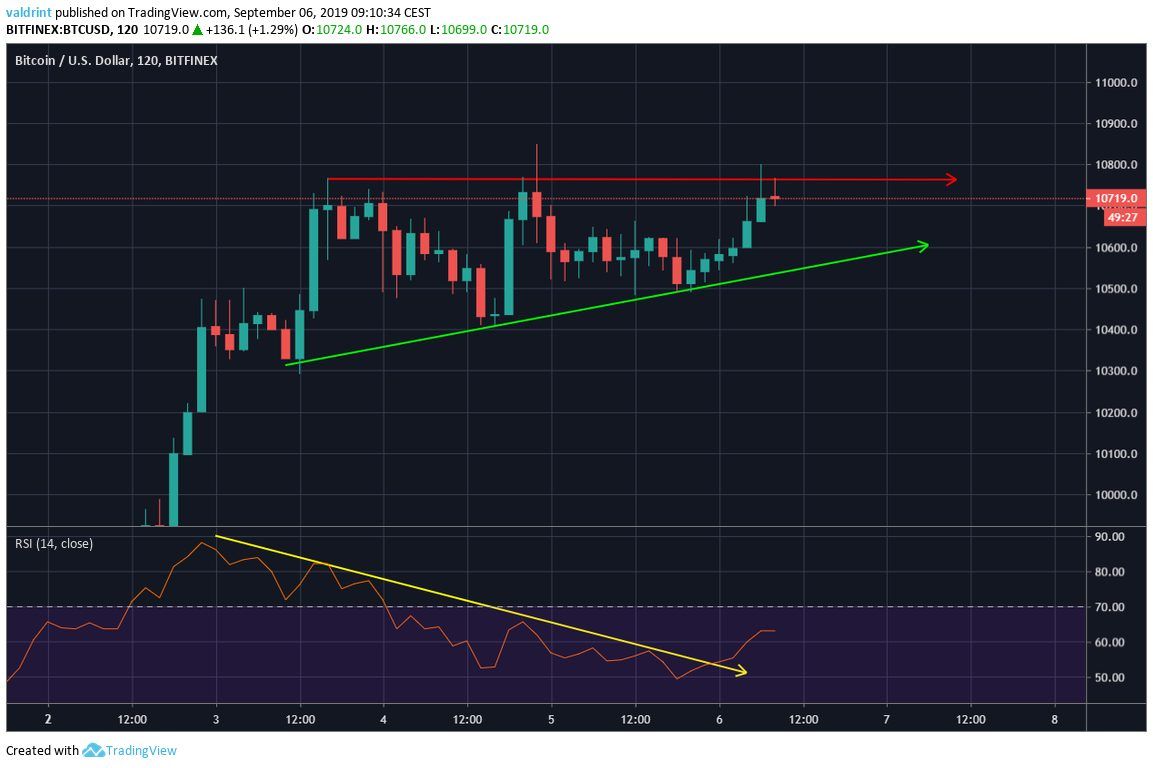
This could mean invalidation of the bearish implications of this divergence.
Additionally, it supports the creation of a bullish pattern such as the ascending triangle.
Another bullish sign is visible when we take a look at a longer-term time-frame — such as the six-hour one.
Unlike the previous two highs, which had long upper wicks and proceeded to decrease, the previous six-hour candlestick closed well inside the resistance provided by the upper wicks.
This is often a sign that the resistance has been dissipating and the price is ready to move higher. Our final sign is given when we take a look at the daily time-frame — revealing the current long-term pattern.
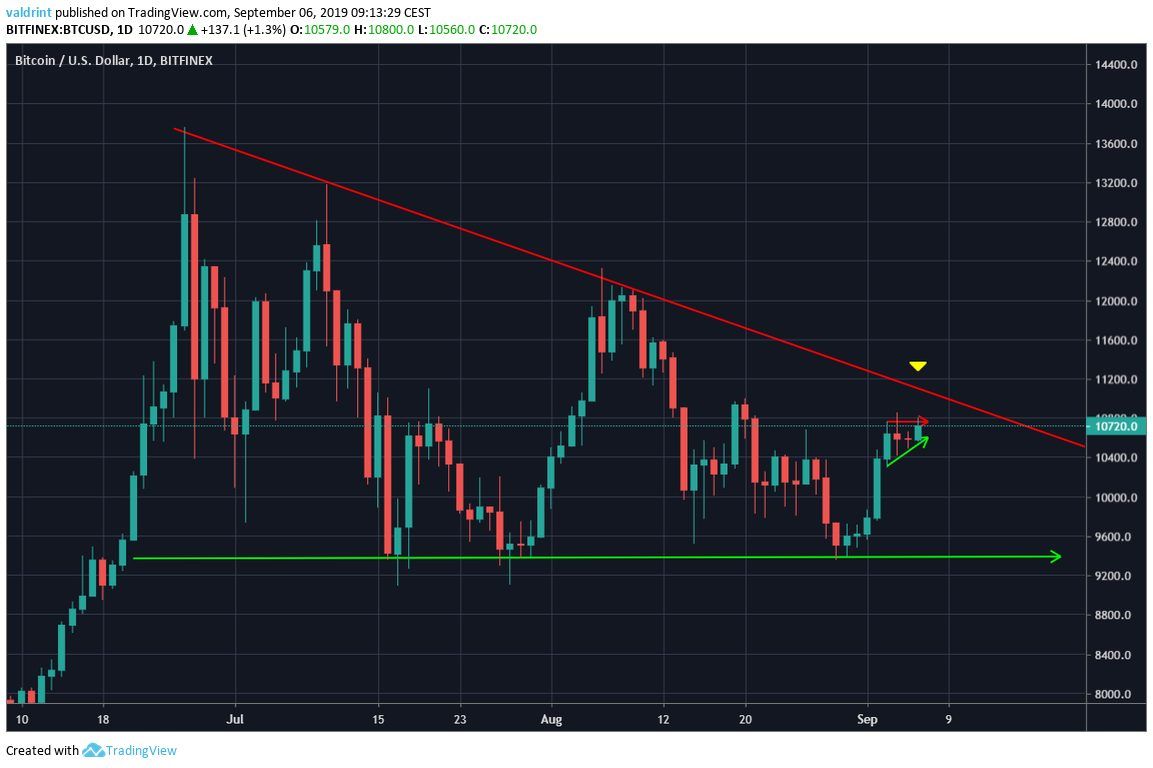
We can see that the Bitcoin price has been trading inside a descending triangle since the end of June.
The price is slightly below the descending resistance line of the triangle. A breakout from the current pattern would take us to it.
Let’s analyze a possible trade setup to see how we can profit from it.
Trade Setup and Summary
Our proposed trade hinges on the Bitcoin price decreasing to validate the support line once more.
That would allow for a suitable position for initiating a long trade.
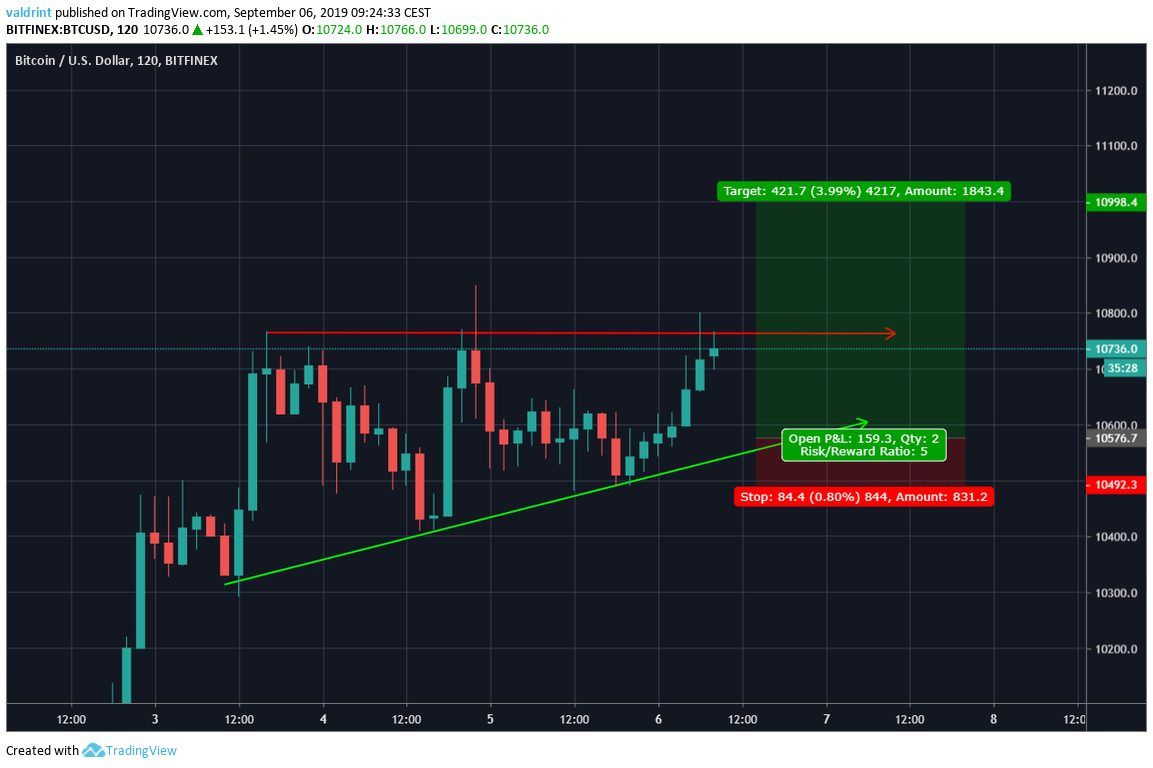
Our entry point would be at $10,550 and stop-loss slightly below $10,500.
A target slightly below $11,000 would give us a Risk:Reward ratio of five — which is profitable enough to initiate a trade.
However, our main and more lucrative trade would be initiated after the breakout.
We would propose shorting BTC once it reaches our target of near $11,000.
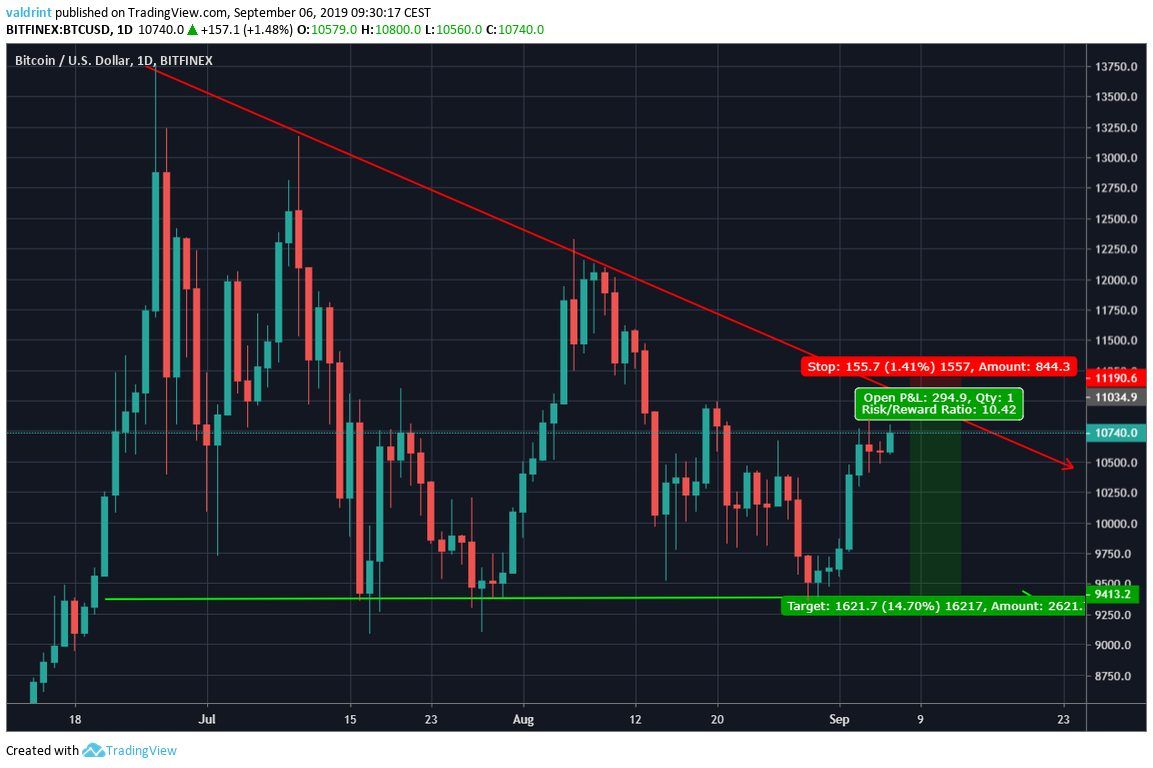
Placing a stop loss above the descending resistance line of the triangle at $11,200 and a target of $9400 gives us an R:R ratio of more than 10.
However, the second trade is just an outline of a possible trade.
If the price breaks out from the short-term triangle, we will analyze the strength of the breakout and price movement before adjusting our entry, exit, and stop-loss levels.
To conclude, we believe that BTC is trading in a short-term bullish pattern and long-term bearish one.
We believe it is possible to profit both these moves and have outlined a possible trade for each.
The details of both trades are presented in the table below.
Where do you think the Bitcoin price will go next? Let us know your thoughts in the comments below.
Disclaimer: This article is not trading advice and should not be construed as such. It is for educational purposes only and represents the typical trades the author would make himself. Always consult a trained financial professional before investing in cryptocurrencies, as the market is particularly volatile.


