


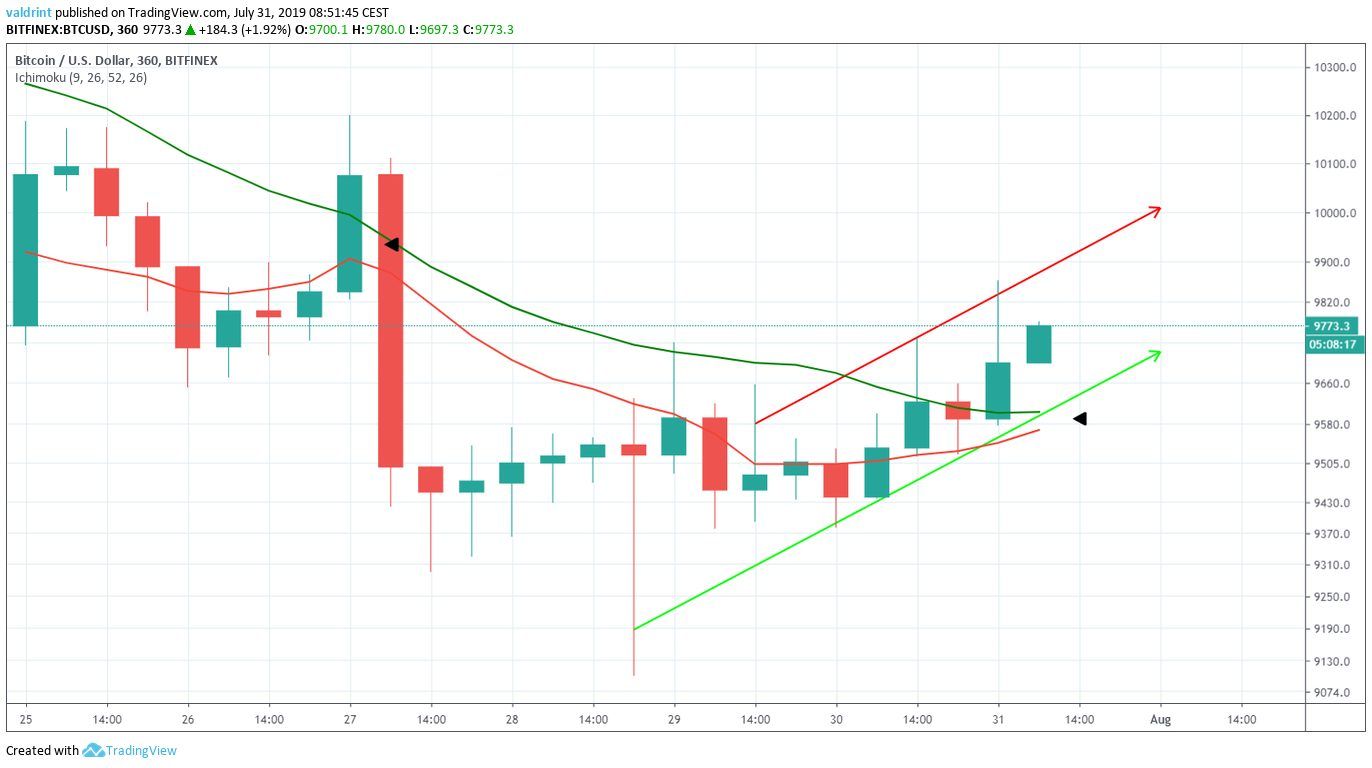
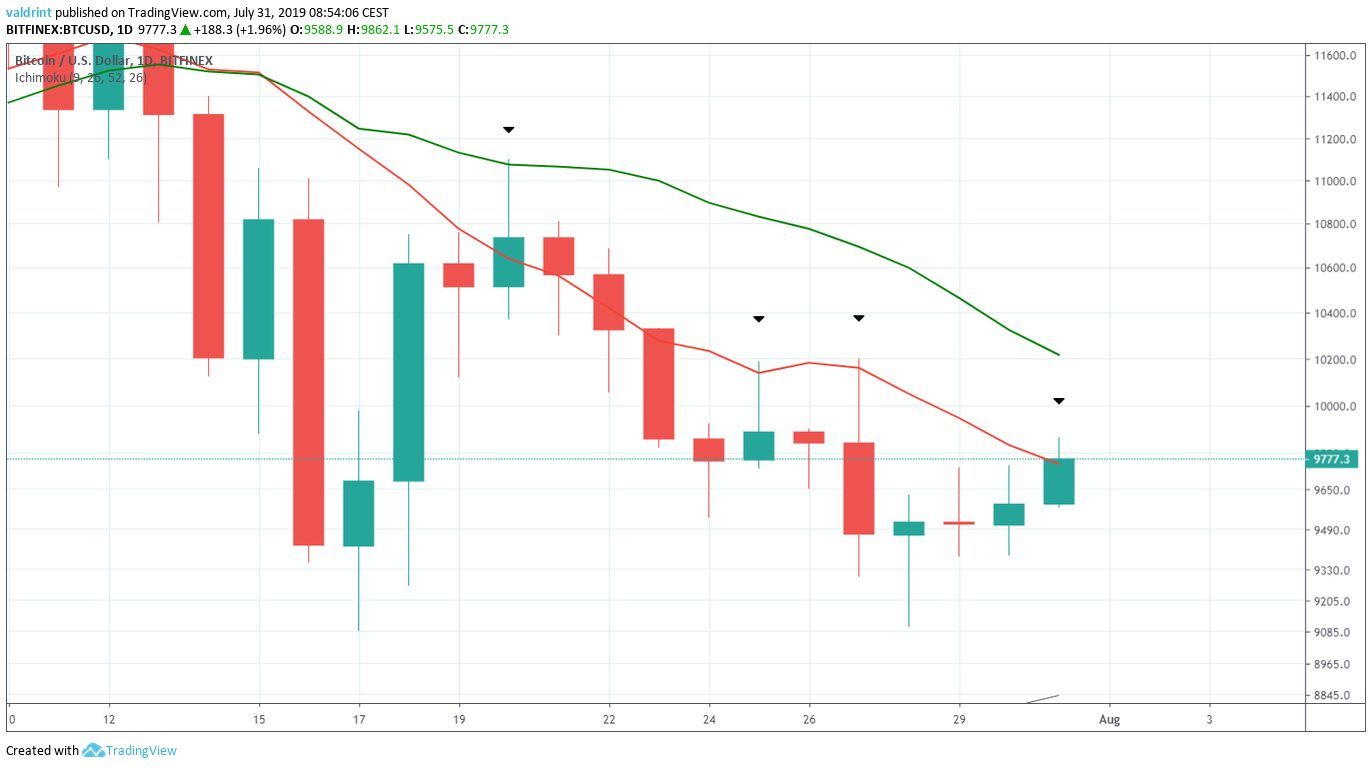
On July 27, 2019, the Bitcoin (BTC) price reached a high of $10,111. A rapid decrease ensued. On July 29, the price had dropped to a low of $9101. Since then, it has been increasing.
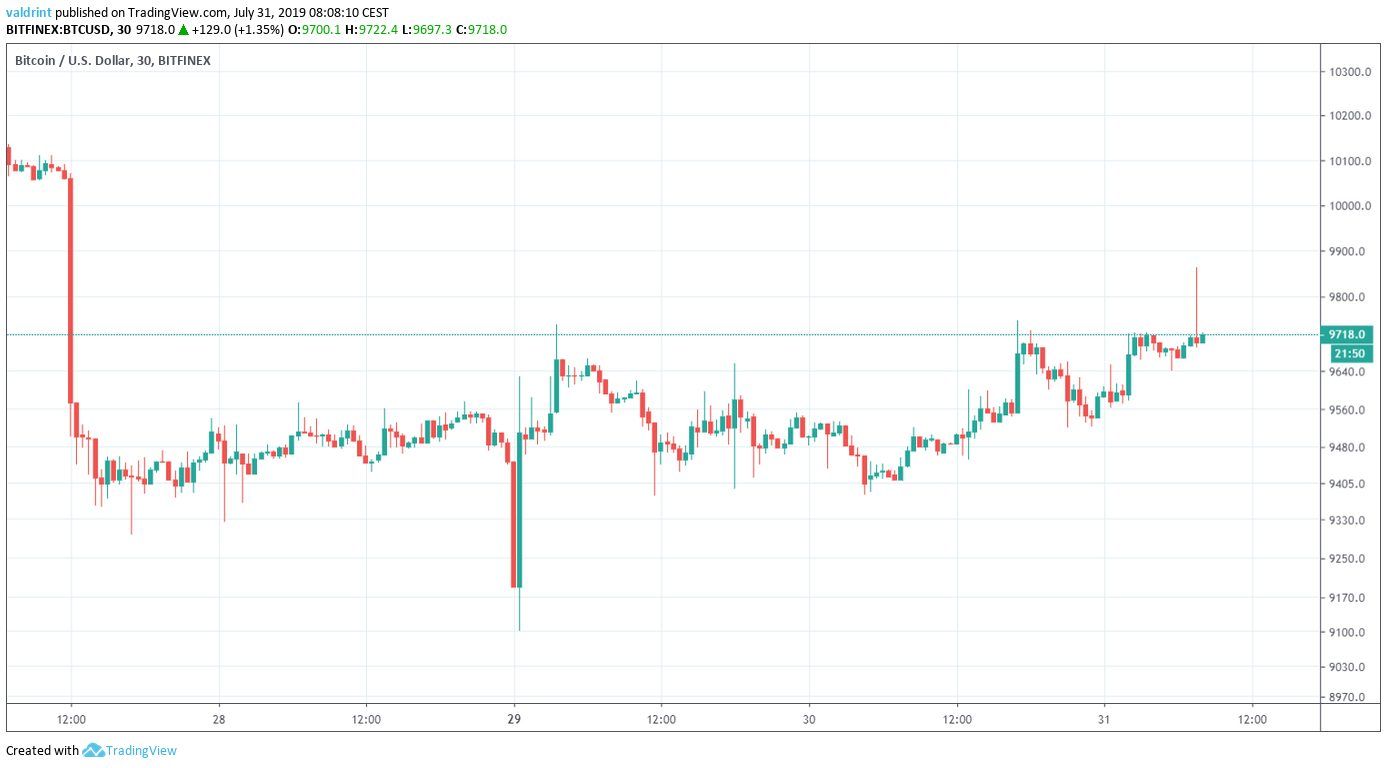
At the time of writing, BTC was trading close to $9700.
How long will it continue to increase? Keep reading below in order to find out.
For our previous analysis, click here.
If you are interested in trading Bitcoin (BTC) with a multiplier of up to 100x on our new partner exchange with the lowest fees, follow this link to get a free StormGain account!
Bitcoin Price: Trends and Highlights for July 31
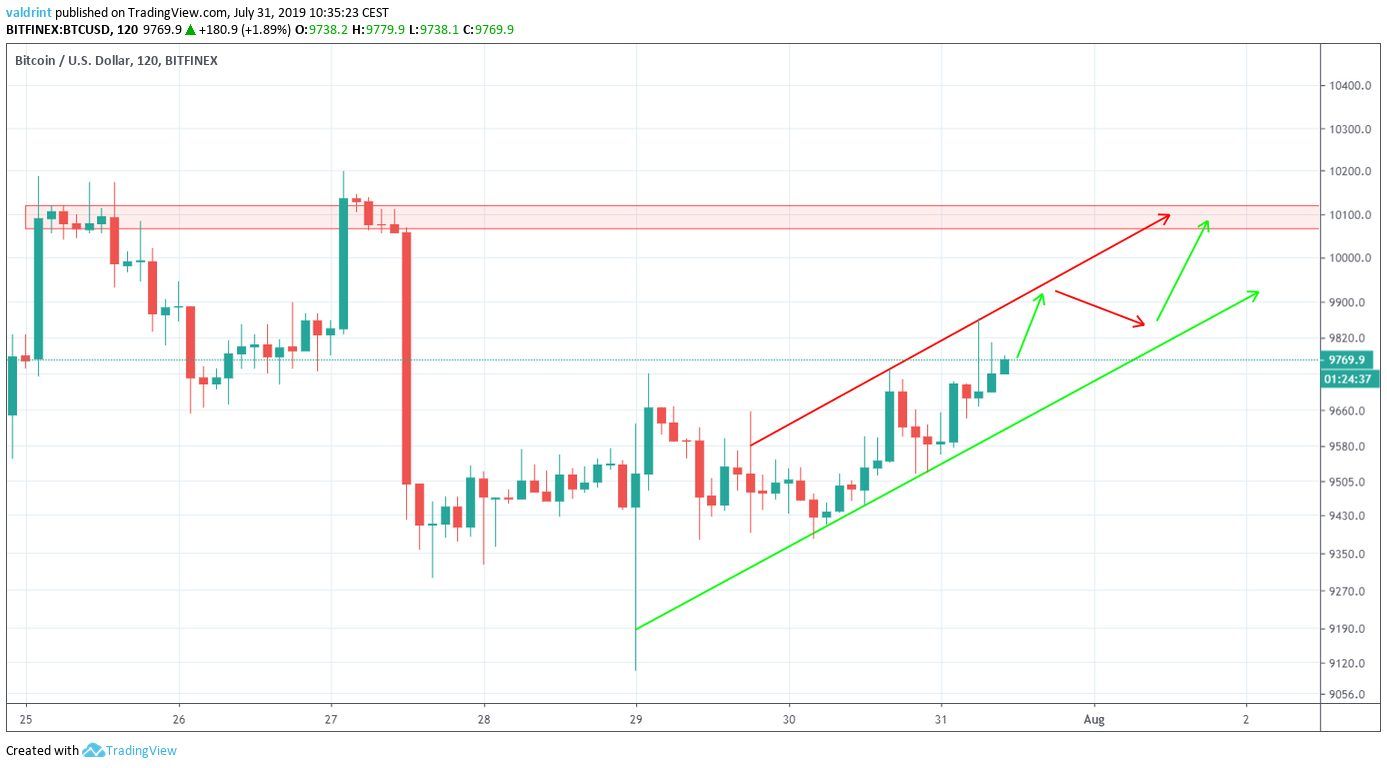
- BTC/USD is trading inside a short-term ascending channel.
- BTC is trading above its short-term moving averages.
- The 10-day moving average is providing resistance to the price.
- There is resistance at $10,100.
Current Pattern
Since reaching a low on July 29, the BTC price has been increasing, creating the ascending channel outlined below.
The ascending channel is considered a neutral pattern.
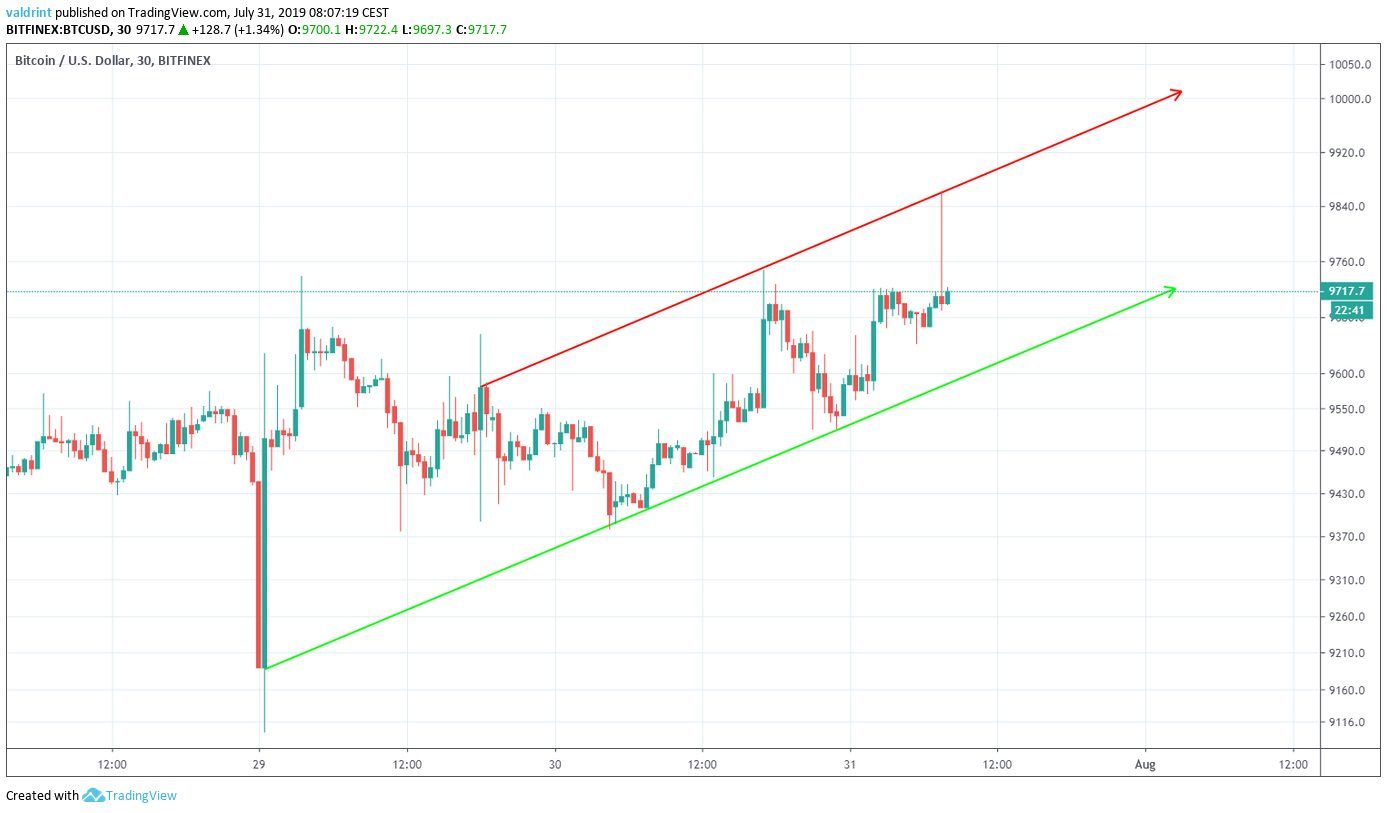
At the time of writing, BTC was trading in the middle of the channel.
Both the resistance and support lines have been touched three times.
Signs Of Resistance
Using a fibonacci retracement tool from the initiation of the rapid decrease, we can see that there are several resistance levels left for the BTC price to clear.
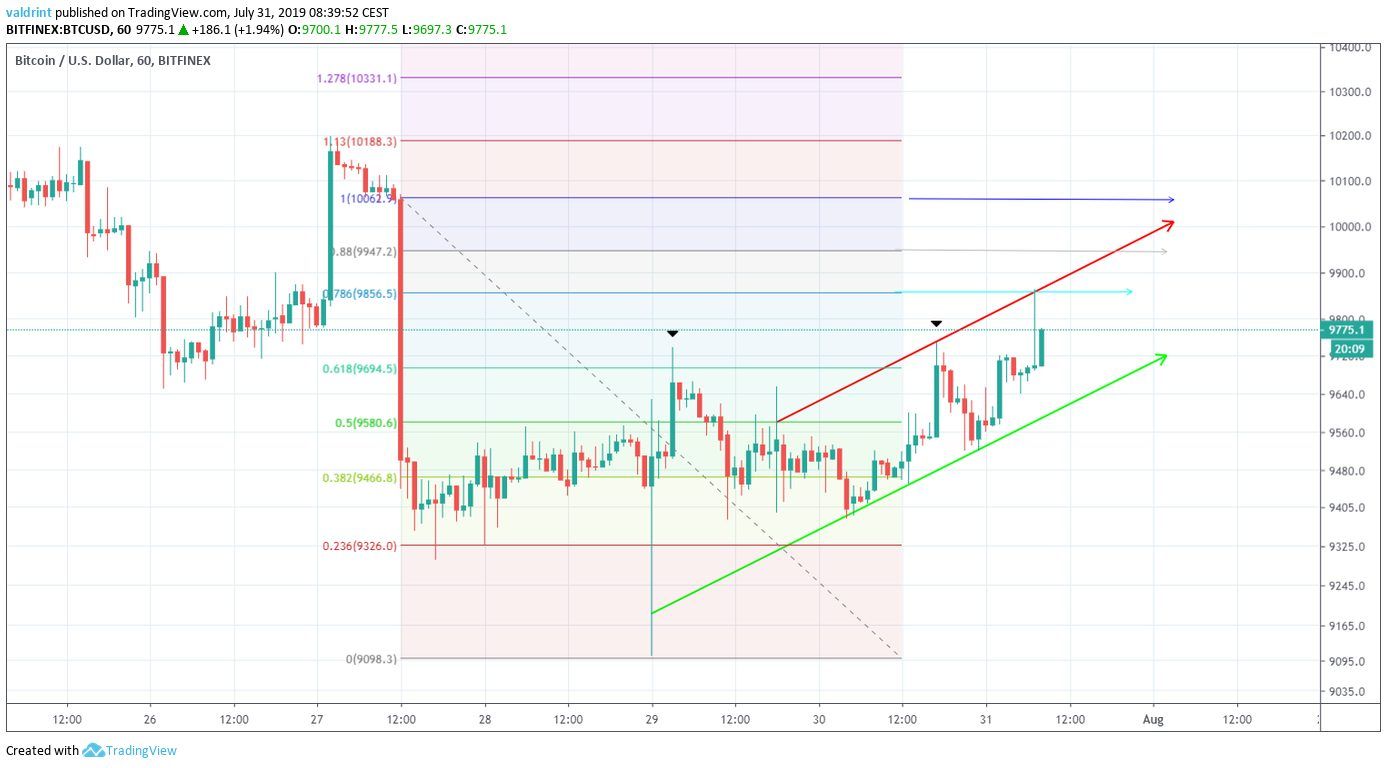
BTC found resistance twice at the 0.618 fib level at $9700.
Afterward, there will be resistance at $9850, $9950 and $10,050
A look at the RSI also shows signs of weakness.
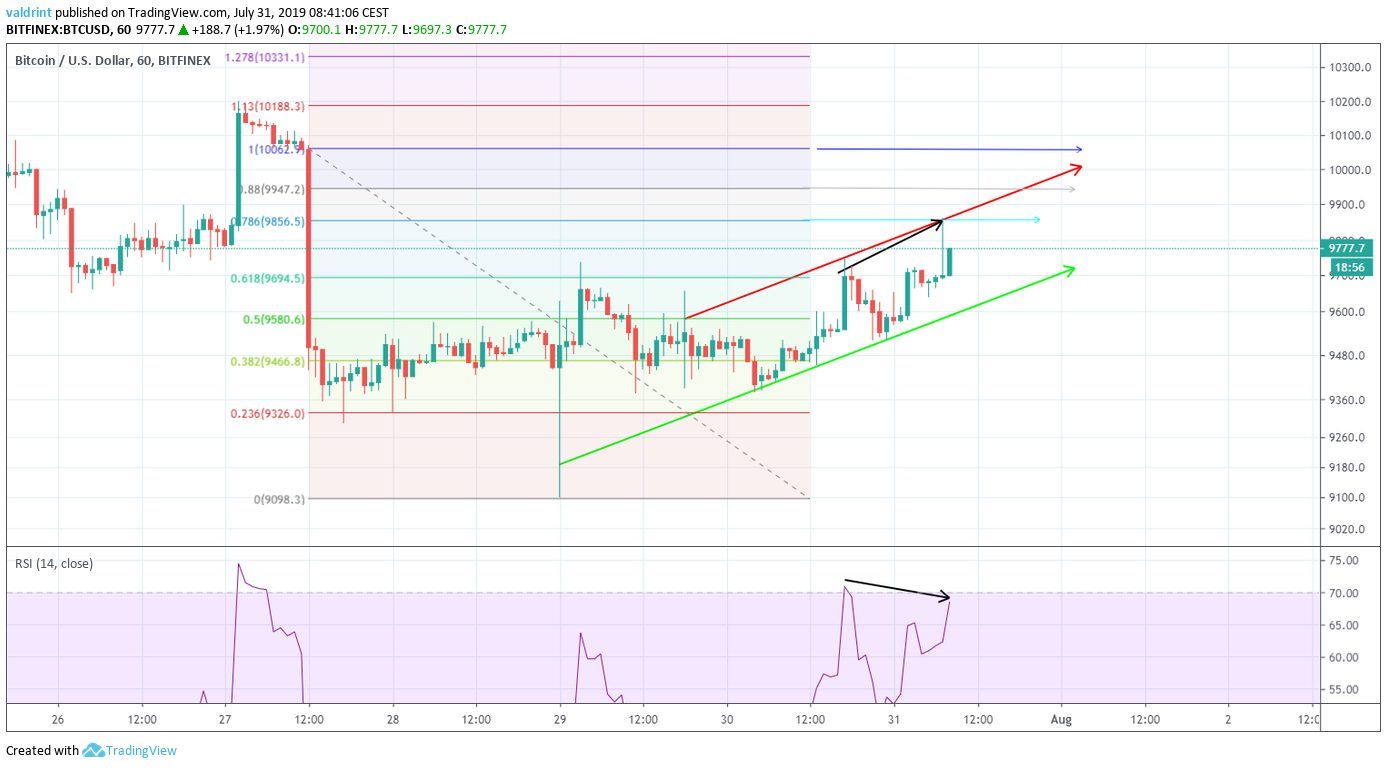
A bearish divergence has been developing since.
The divergence, however, is not very significant and only present in short-term time-frames.
While it is not nearly enough to confidently predict a reversal, it at least makes a breakout unlikely.
Technical Indicators
The price is trading above the 10- and 20-period MAs.
However, they have yet to make a bullish cross.
The previous time this occurred was on July 26.
At that time, the MAs rejected a bearish cross and a rapid decrease occurred.
Likewise, a look at the daily moving averages shows that the price is at a critical point in time.
It has reached the 10-day MA but has failed to break out above it.
Previously, unsuccessful attempts at a breakout were made on July 25 and 27.
Furthermore, the 20-day MA provided resistance on July 20.
At the time of writing, it is at $10,200.
Future Movement
A possible outline of future movement is shown below.
The BTC price is likely to increase along the confines of the channel.
While it should meet short-term resistance at the fib levels outlined in the first section, we believe it will eventually reach pre-breakdown levels.
The most significant resistance area is found near $10,100.
Bitcoin Price Summary
The Bitcoin price is trading inside a short-term ascending channel.
According to our analysis, it is likely to increase inside the confines of this channel.
Both a breakout and breakdown do not seem likely.
Do you think BTC will continue to increase? Let us know in the comments below.
Disclaimer: This article is not trading advice and should not be construed as such. Always consult a trained financial professional before investing in cryptocurrencies, as the market is particularly volatile.
Images are courtesy of TradingView and Shutterstock.


