


In the period from June 22 to June 25, the price of Bitcoin (BTC) was trading between $10,500 and $11,000. An upward move began on June 25, and the price reached highs of $13,880 the next day.
Since then, however, the Bitcoin price has been decreasing. It reached the support area near $10,600 again on June 27 and 30.
Will it break down or is there a reversal in store? Keep reading below in order to find out.
For our previous analysis, click here.
If you are interested in trading Bitcoin (BTC) on our partner exchange, you can get set up on XCOEX by following this link.
Bitcoin Price: Trends and Highlights for July 1
- The Bitcoin price has been trading inside a descending wedge
- It is likely in the A wave of an A-B-C correction.
- A less likely possibility is that it is in the fourth wave of a five-wave Elliott formation.
- There is bearish divergence developing in the RSI in the daily and 3-day time-frames.
- In a weekly time-frame, it is possibly creating an evening star pattern.
Bitcoin Price in a Descending Wedge
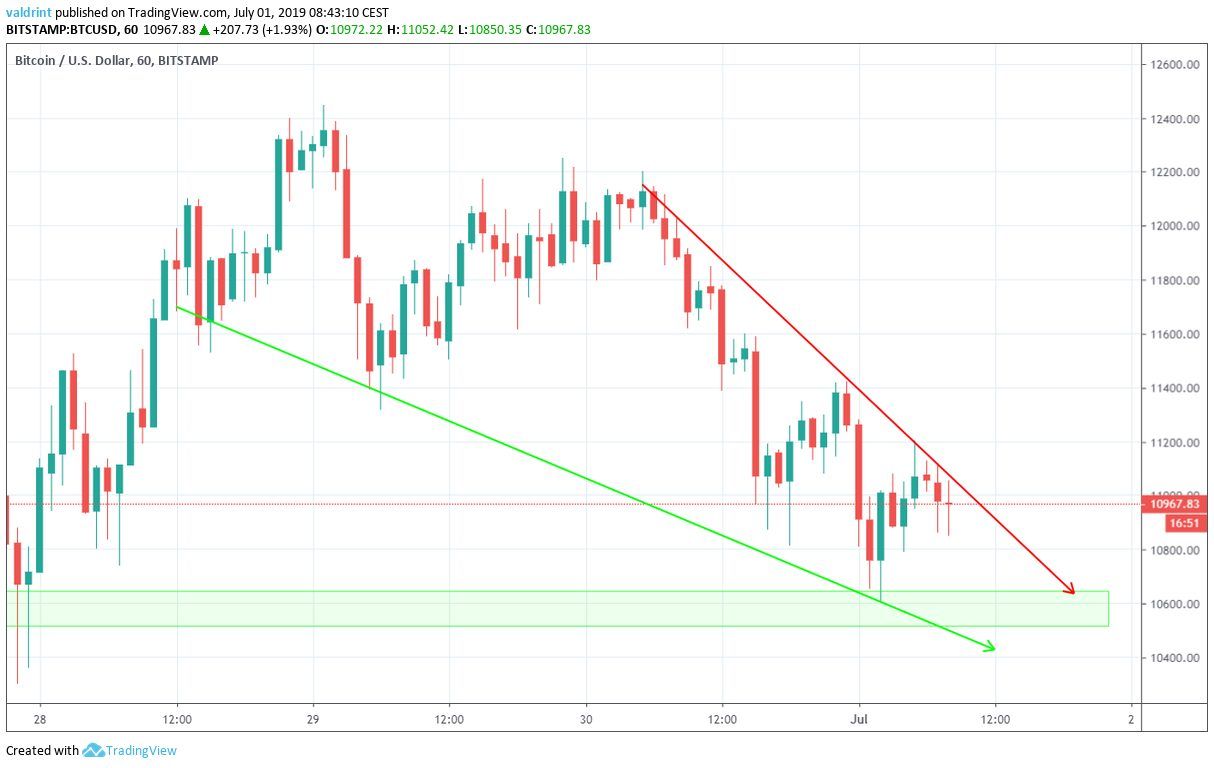
The wedge is a bullish pattern, making a price breakout more likely. Furthermore, it is trading slightly above the major support area near $10,600.
Will the Bitcoin price break out? Let’s take a step back and analyze a longer-term time-frame.
Bitcoin Price: Wave Analysis
A look at the daily time-frame shows that the price has currently retraced to the 0.236 fib level of the entire upward move beginning at $4100.
It seems unusual that after such a long rally, the price will continue to increase after a very short retracement.
A more customary development would be a drop to the 0.382 or even the 0.5 fib level.
With that in mind, the first outline we are going to analyze is where we just finished a five-wave Elliott Formation.
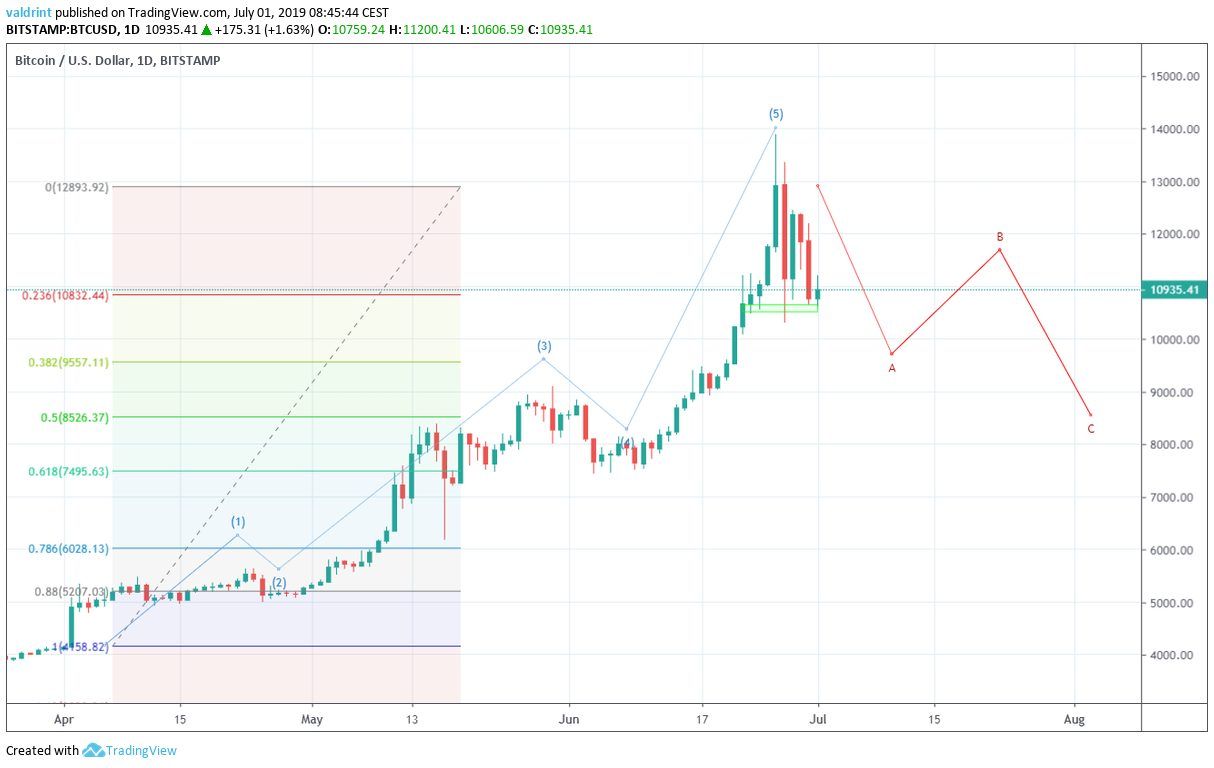
In this outline, we are now in the A wave of an A-B-C correction. Using fib levels, it is likely that the A wave will make a low near $10,000, above the highs on wave 3.
Afterward, wave B should initiate a small bull run up to $12,000, before we have a final C wave which could take us down to around $8000.
The uptrend should continue after that.
The second possibility is that we just finished an extended wave 3. We are now in bearish wave 4 before another leg up is initiated.
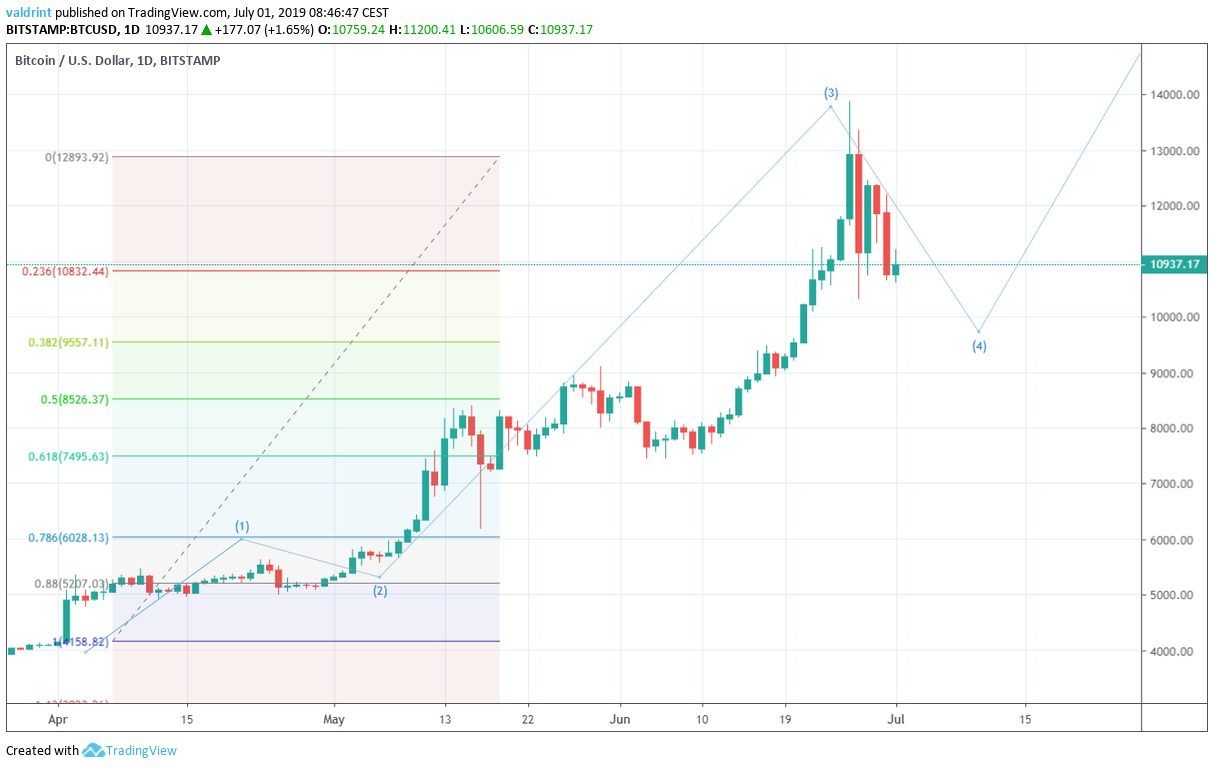
In this possibility, wave five should become even more parabolic than wave 3, and would likely take us close to $20,000.
However, even if the price follows the second outline, I would still expect a sharper retracement for the low of wave 4.
Evening Star Pattern
After reaching a high of close to $14,000 on June 26, the Bitcoin price immediately decreased and closed near $13,000.
The next day, a massive bearish engulfing candle was created with significant volume.
It closed well below the opening of the prior day’s candle.
Furthermore, yesterday’s candle closed below the opening prices of the bearish engulfing candle of June 27. A close below the low of that candle at $10,400 would likely initiate a rapid decrease.
These candlesticks are shown in the left-side graph.
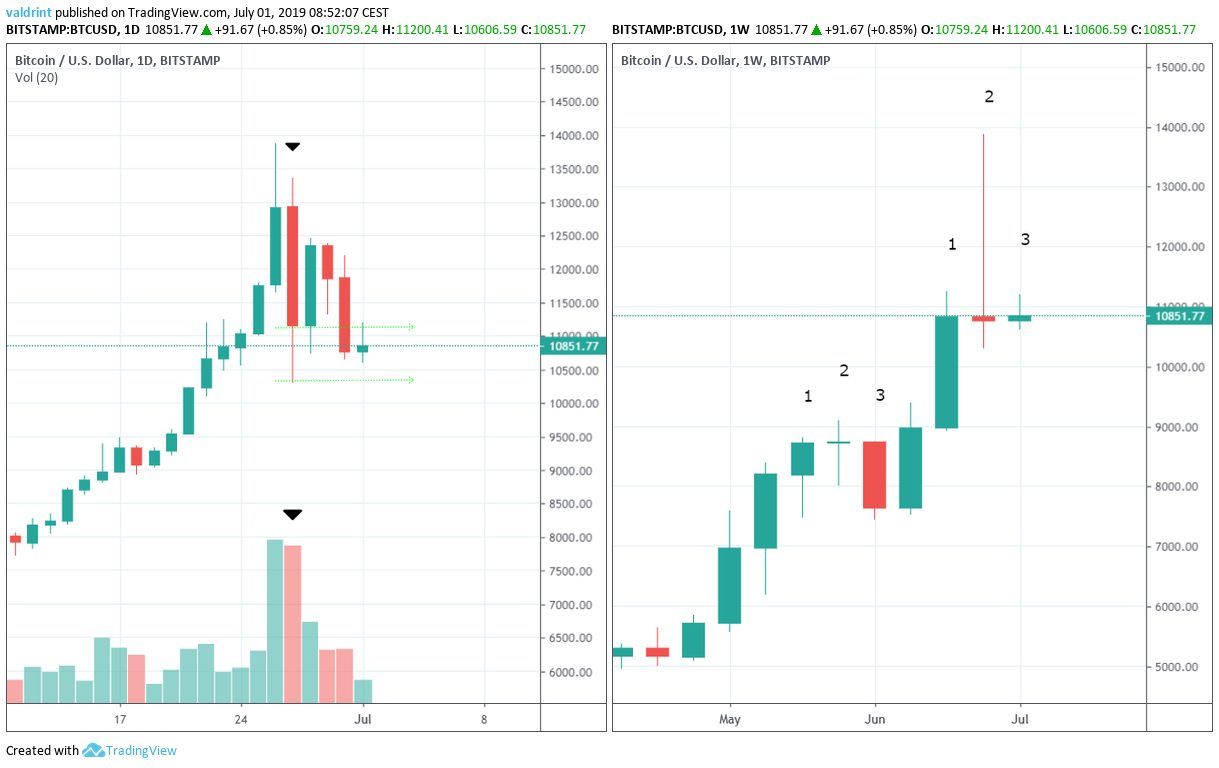
This pattern is formed by a bullish candle (1), followed by a doji (2) and another bearish engulfing candle (3).
Last week’s candlestick was a bearish doji that resembled a bearish shooting star. This is a likely reversal candle.
If the pattern proves to be correct, this week’s candle should be bearish engulfing and take us to between $8000 – $9000.
A similar pattern occurred in the final weeks of May. It was, however, different since the doji was bullish and preceded by a bullish hammer. After the final candle, the price began an even stronger uptrend.
At the current time, we cannot say for certain whether the price will act in the same manner.
We will revisit this if/once the price creates or rejects the evening star pattern.
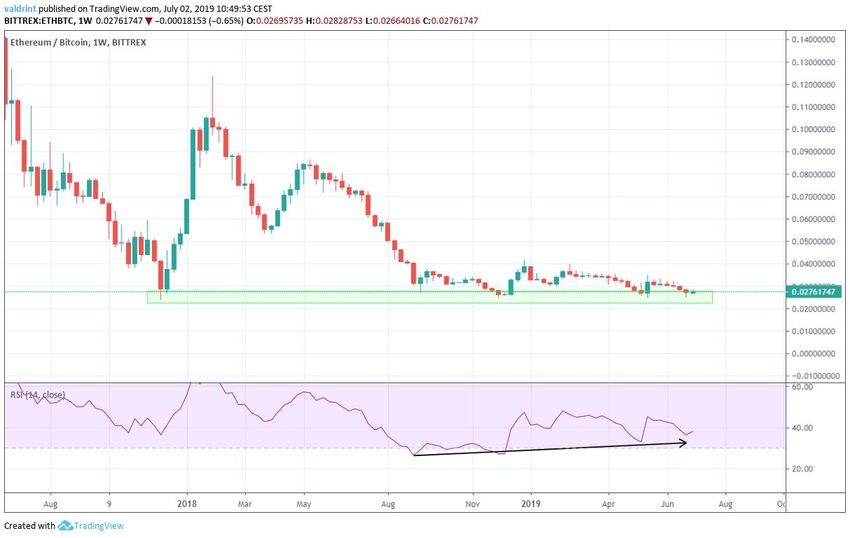
Divergence
A look at the RSI shows that the price has been creating a significant bearish divergence in several time-frames.
In the daily time-frame, this divergence has been present in the form of a triple top since the beginning of the upward move in April.
The 3-day time-frame has been present since May 13.
The divergence is significant in value. However, it is only present in the RSI and not in the MACD.
Summary
According to our analysis, the price of BTC is likely in a correction, either a short one as a part of wave 4 or a longer A-B-C correction.
Whichever the case, we would expect the price to drop to around $9500 before it reveals more information about its future movement.
In the short-term, it is likely that it reached the support area outlined in the first section and then breaks out from the descending wedge.
What do you think will happen to the price of BTC? Let us know in the comments below!
Disclaimer: This article is not trading advice and should not be construed as such. Always consult a trained financial professional before investing in cryptocurrencies, as the market is particularly volatile.
Images are courtesy of Shutterstock, TradingView.


