
On Tuesday, Bitcoin exchange-traded funds (ETFs) logged their fourth consecutive day of net outflows, marking the longest streak of withdrawals since April.
This sustained capital exit reflects the downturn in market sentiment, which could push BTC’s price lower in the near term.
Bitcoin ETF Outflows Top $1 Billion in 4 Days as Institutional Bulls Retreat
The four-day selloff in ETFs signals a weakening conviction among institutional investors, who now seek to reduce their Bitcoin exposure. Per SosoValue, net outflows from these funds have exceeded $1 billion in the past four days.
For token TA and market updates: Want more token insights like this? Sign up for Editor Harsh Notariya’s Daily Crypto Newsletter here.
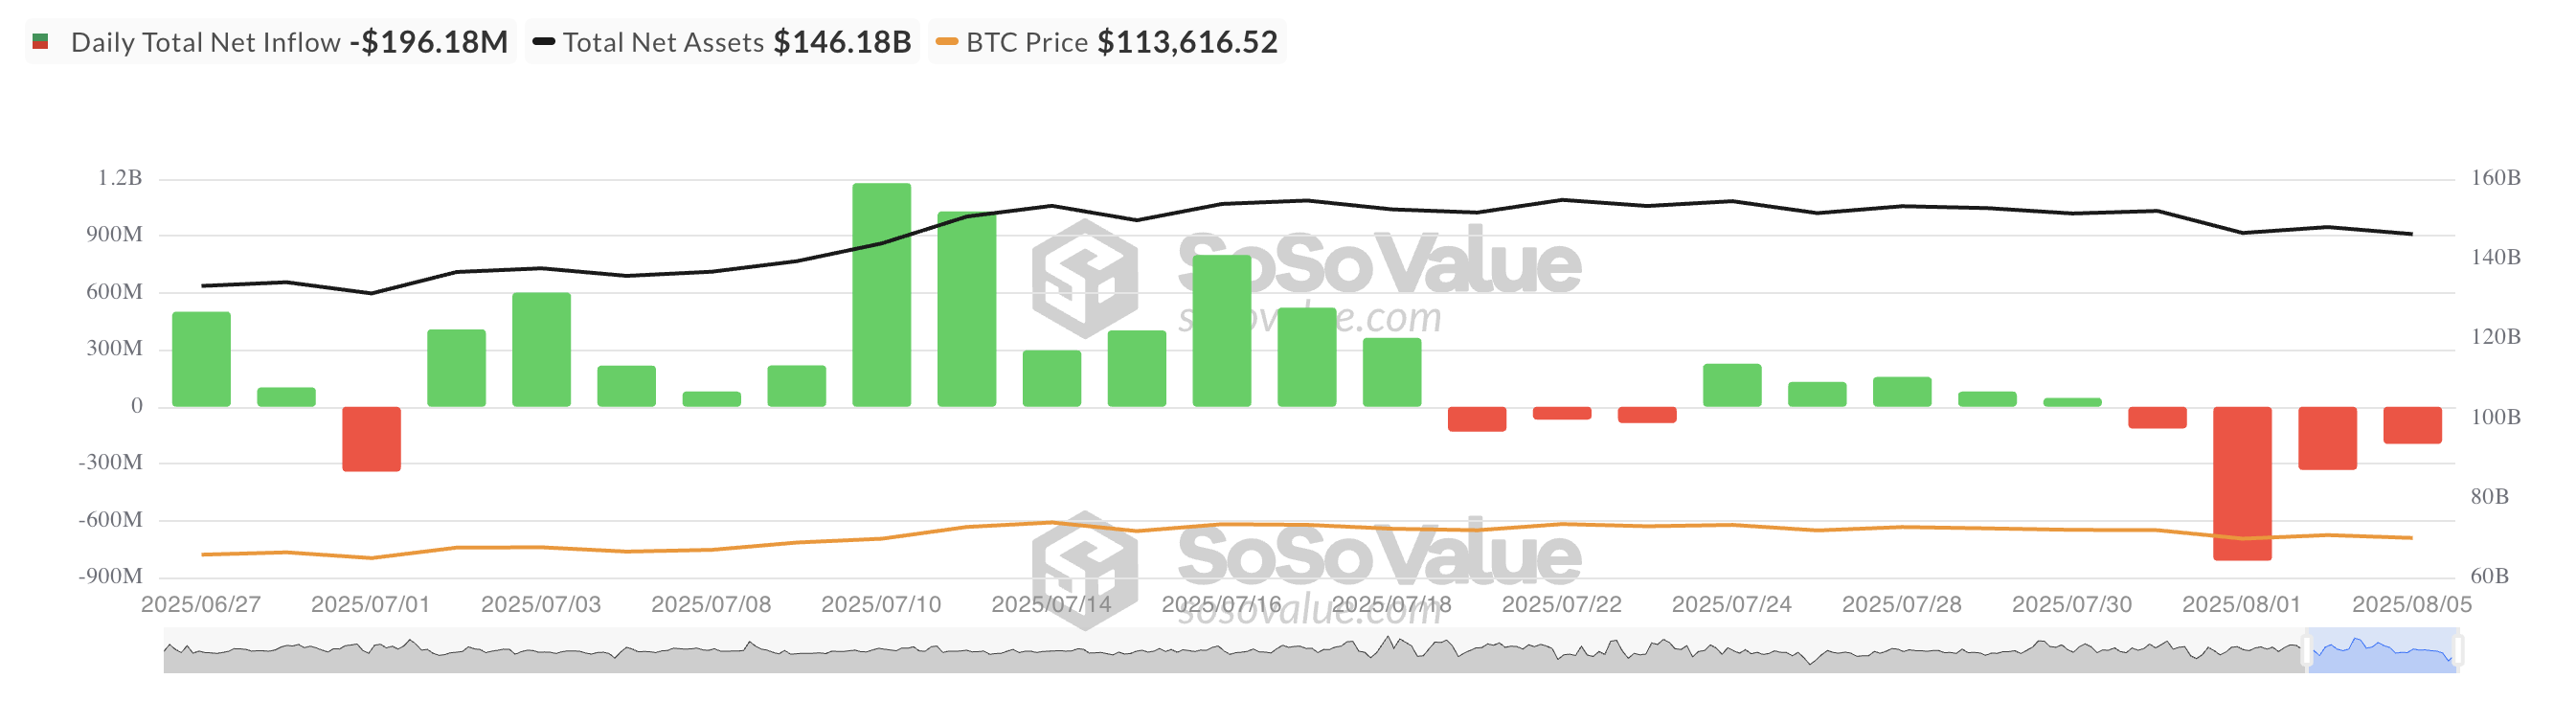
This is a significant development because BTC’s recent rally to a new all-time high of around $122,054 was fueled largely by the activity of these same investors.
In July alone, spot BTC ETFs brought in over $6 billion in capital inflows, helping drive prices higher. Their pullback now suggests a lack of institutional support, a shift that could weigh heavily on the cryptocurrency’s value in the near term.
Moreover, on-chain data also highlights the bearish turn. This is reflected by the coin’s long/short ratio, which sits at 0.93 at press time.
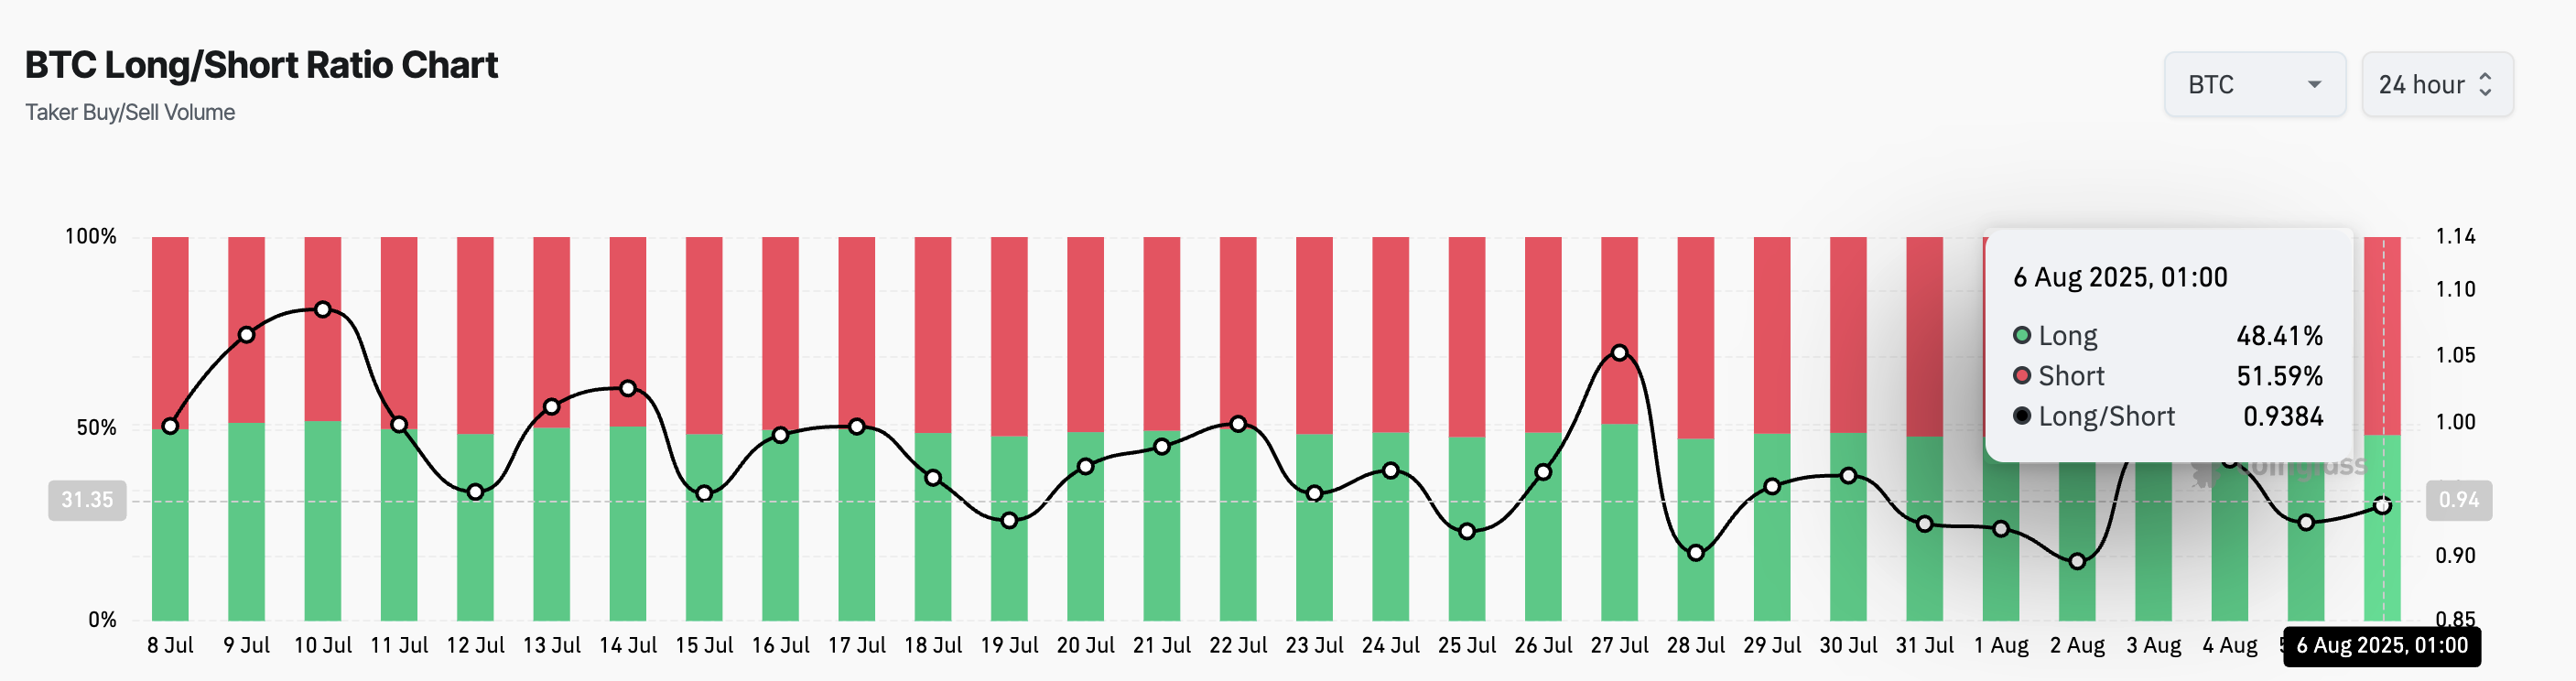
The long/short metric measures the proportion of long bets to short ones in an asset’s futures market. A ratio above one signals more long positions than short ones. This indicates a bullish sentiment, as most traders expect the asset’s value to rise.
On the other hand, as with the leading coin, a long/short ratio below one means that more traders are betting on the asset’s price to decline than those expecting it to rise.
BTC Bears Eye $111,000 Target
Readings from the daily chart show BTC’s price stationed below its Parabolic Stop and Reverse (SAR) indicator. Currently, the dots that comprise the indicator form dynamic resistance above BTC’s price at $118,086.
An asset’s Parabolic SAR indicator tracks potential trend direction and reversals. When its dots are under an asset’s price, the market is witnessing bullish momentum, and its value could continue to grow if buying activity continues.
Conversely, when it rests above an asset’s price, it signals a potential downtrend amid climbing selling pressure. If this continues, BTC’s price could drop to $111,855.
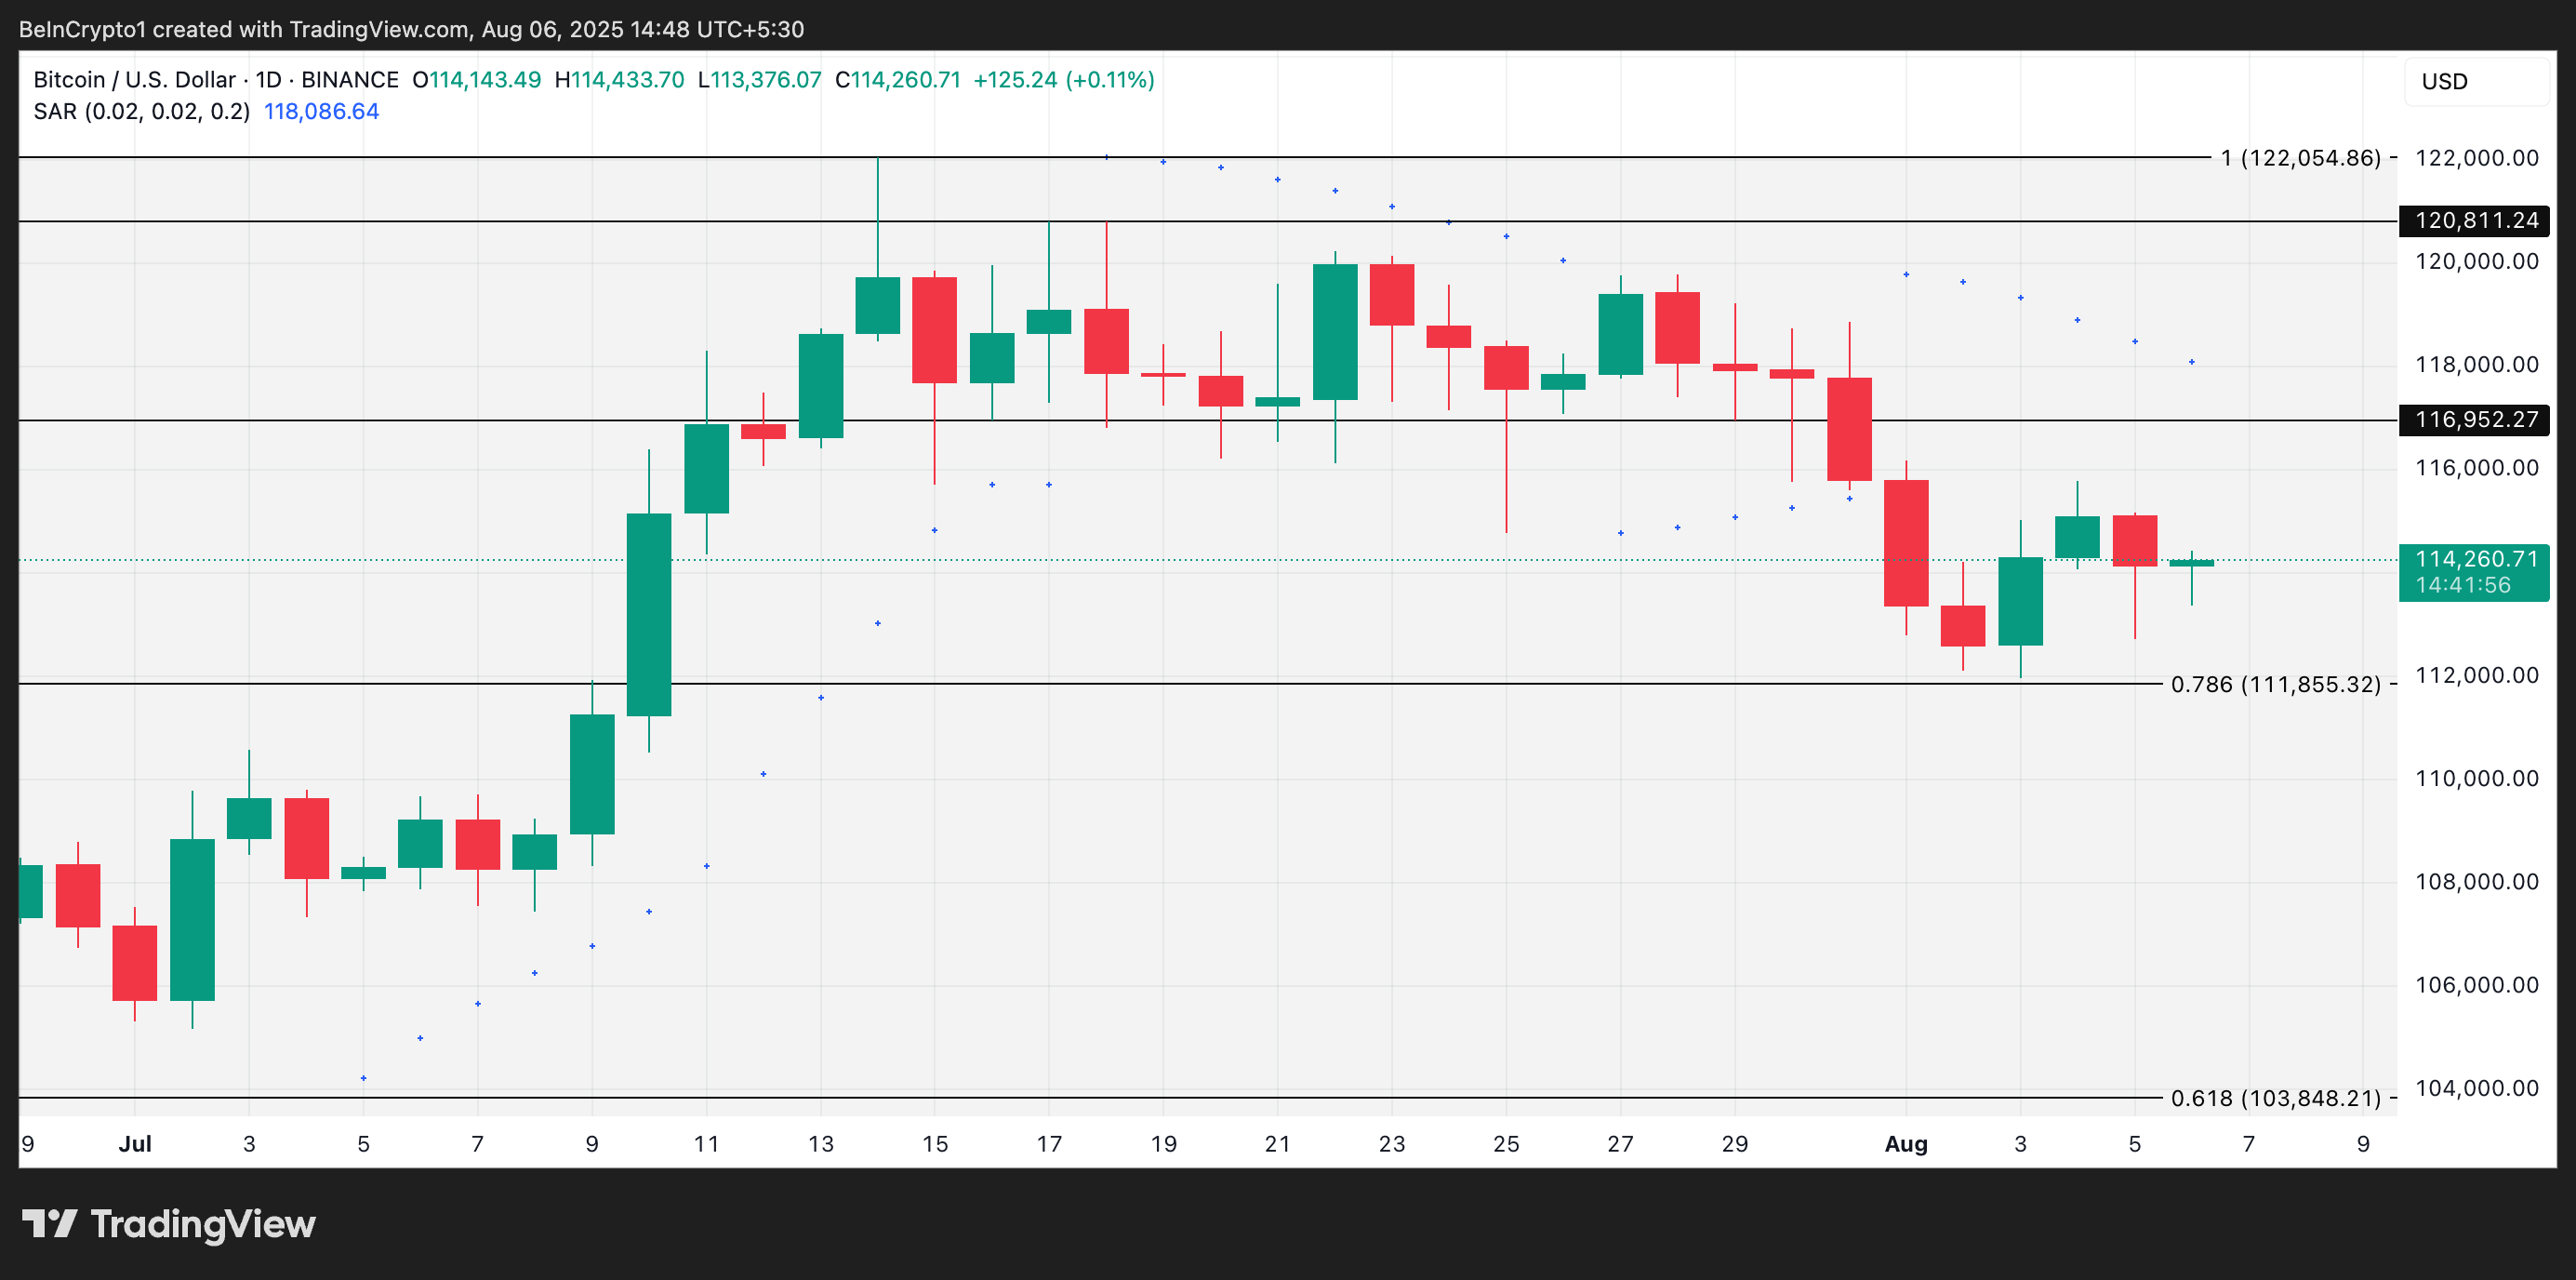
However, if new demand enters the market, it could push the king coin toward $116,952.
