


The bitcoin dominance rate (BTCD) has decreased for the entirety of 2021 and is approaching a long-term support level.
Both technical indicators and the price movement support a continuation of the drop in bitcoin dominance.
Long-Term BTCD Drop
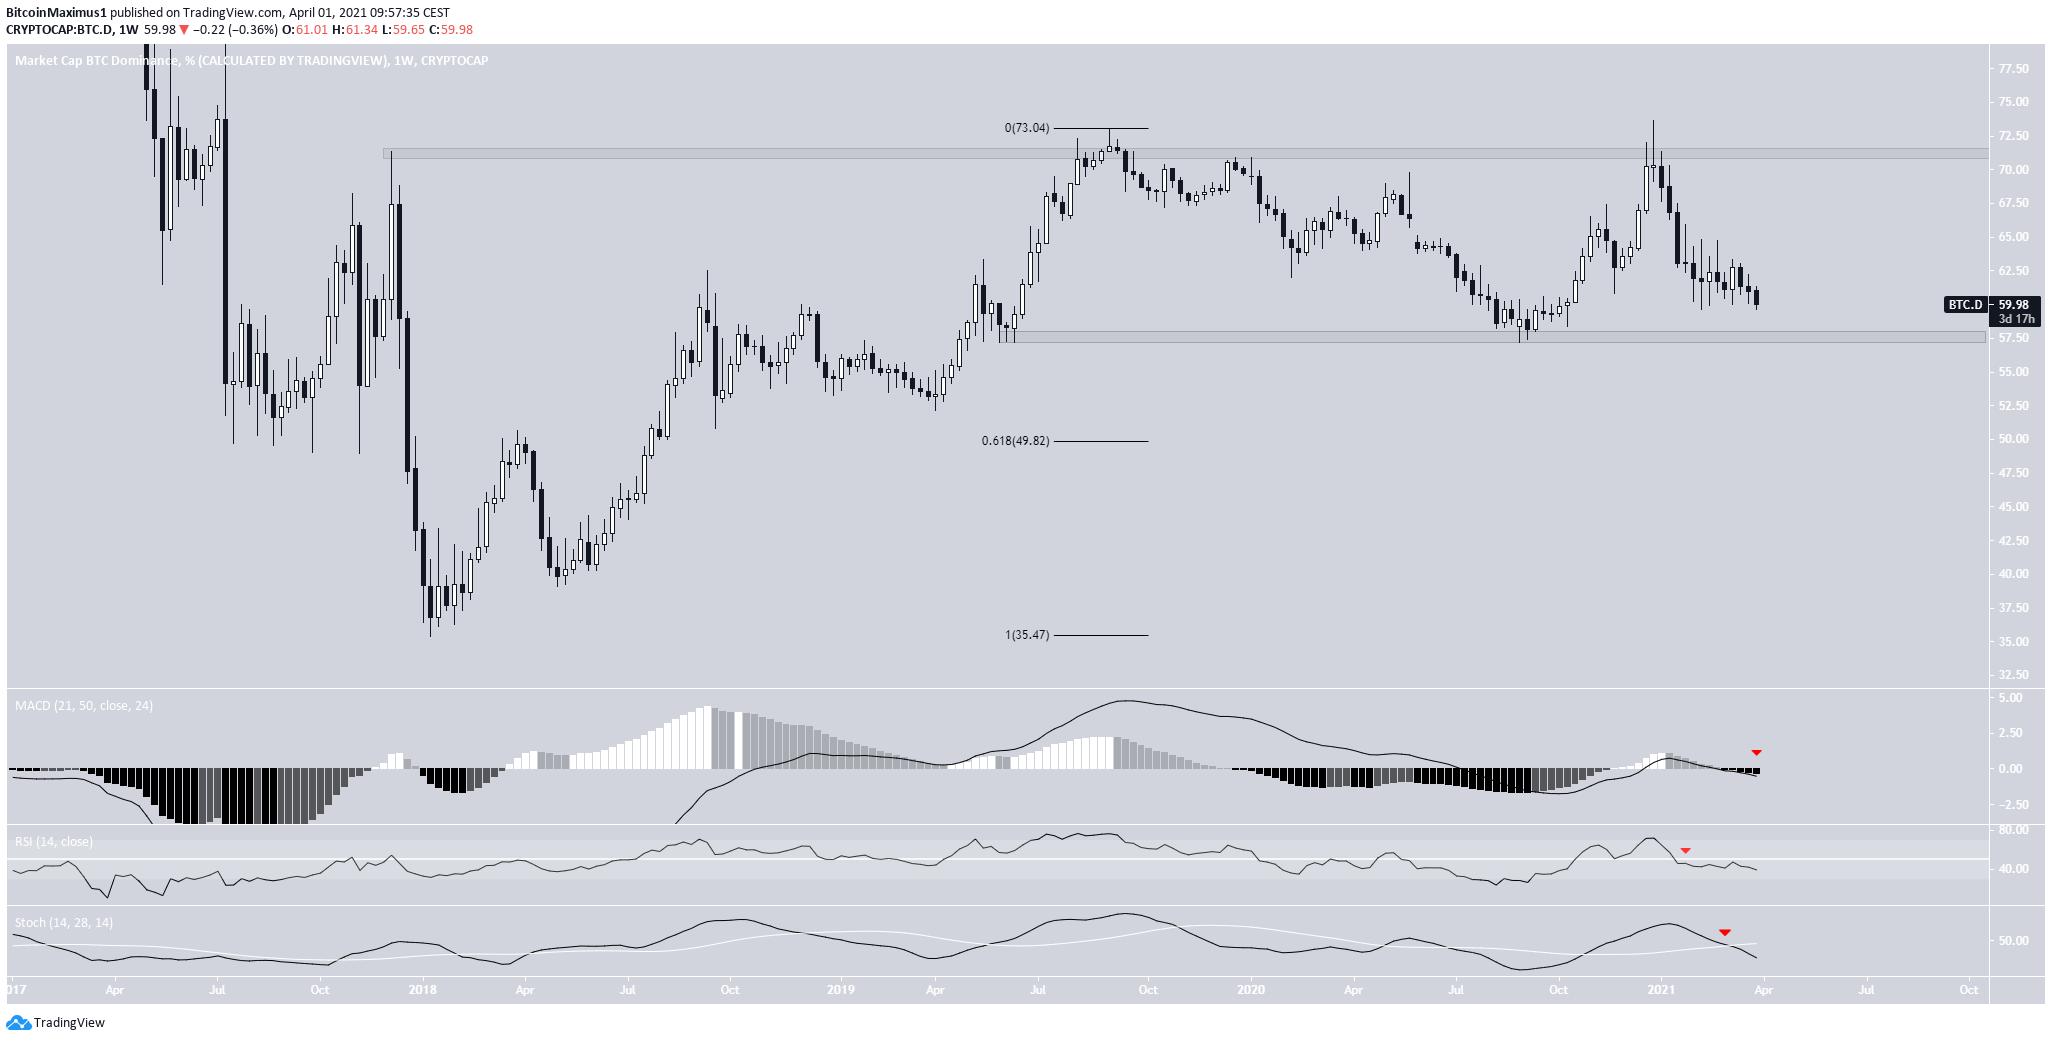
The BTCD has been moving downwards since December 2020 when it was rejected by the long-term 71.30% resistance area.
It has been moving downwards since and has nearly reached the long-term 57.60% support area.
It has not traded below this level since April 2019. A breakdown below here could trigger a sharp drop towards 49.80%.
Technical indicators in the weekly time-frame are bearish. The MACD is negative and decreasing. The RSI is also below 50 and decreasing and the Stochastic oscillator has made a bearish cross.
Therefore, a decrease towards 57.7% is expected, while a drop towards 49.80% is possible.
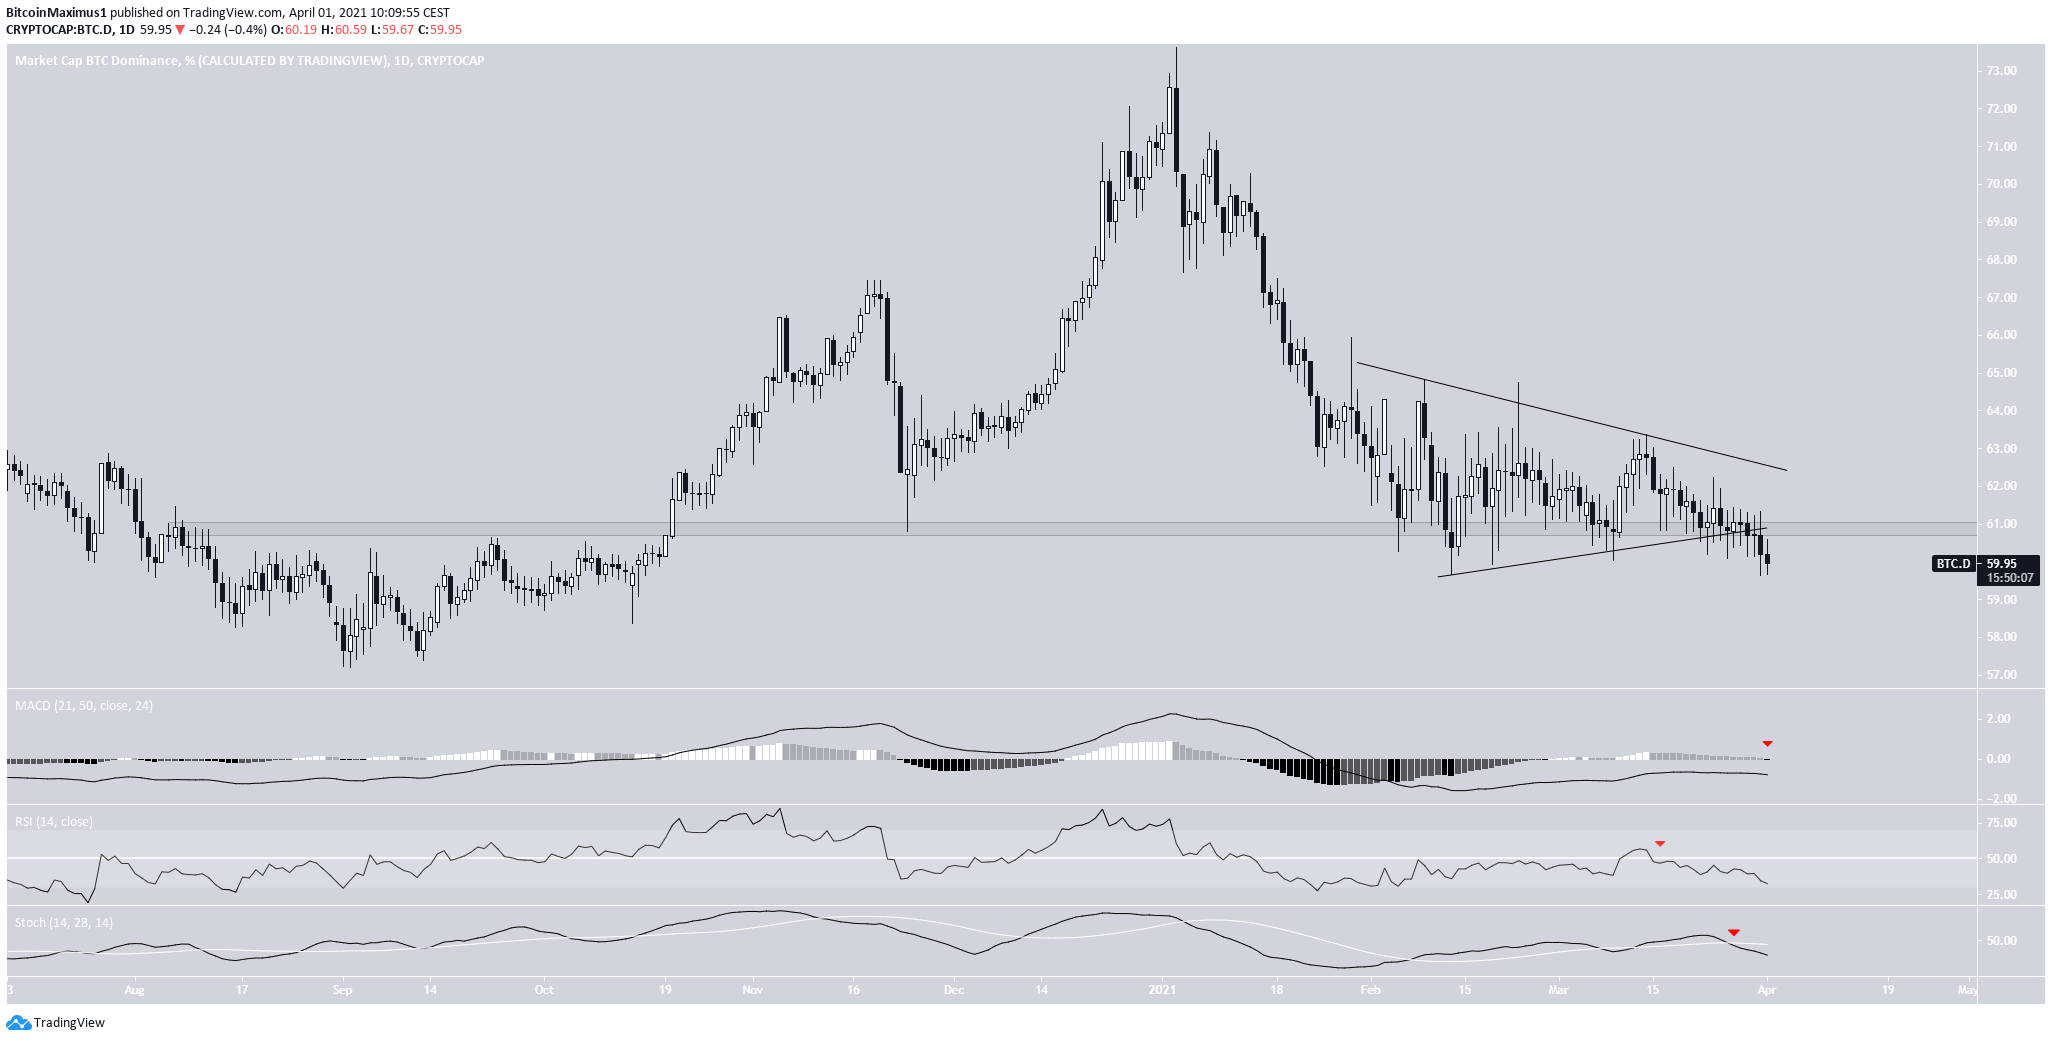
The daily chart supports this possibility. The BTCD just broke down from a symmetrical triangle. In addition, it broke down below a minor support level at 60.80%. This level is now likely to act as resistance.
Similar to the weekly time-frame, technical indicators in the daily time-frame are bearish. These signals support the continuation of the downward movement.
Altcoin Market Cap
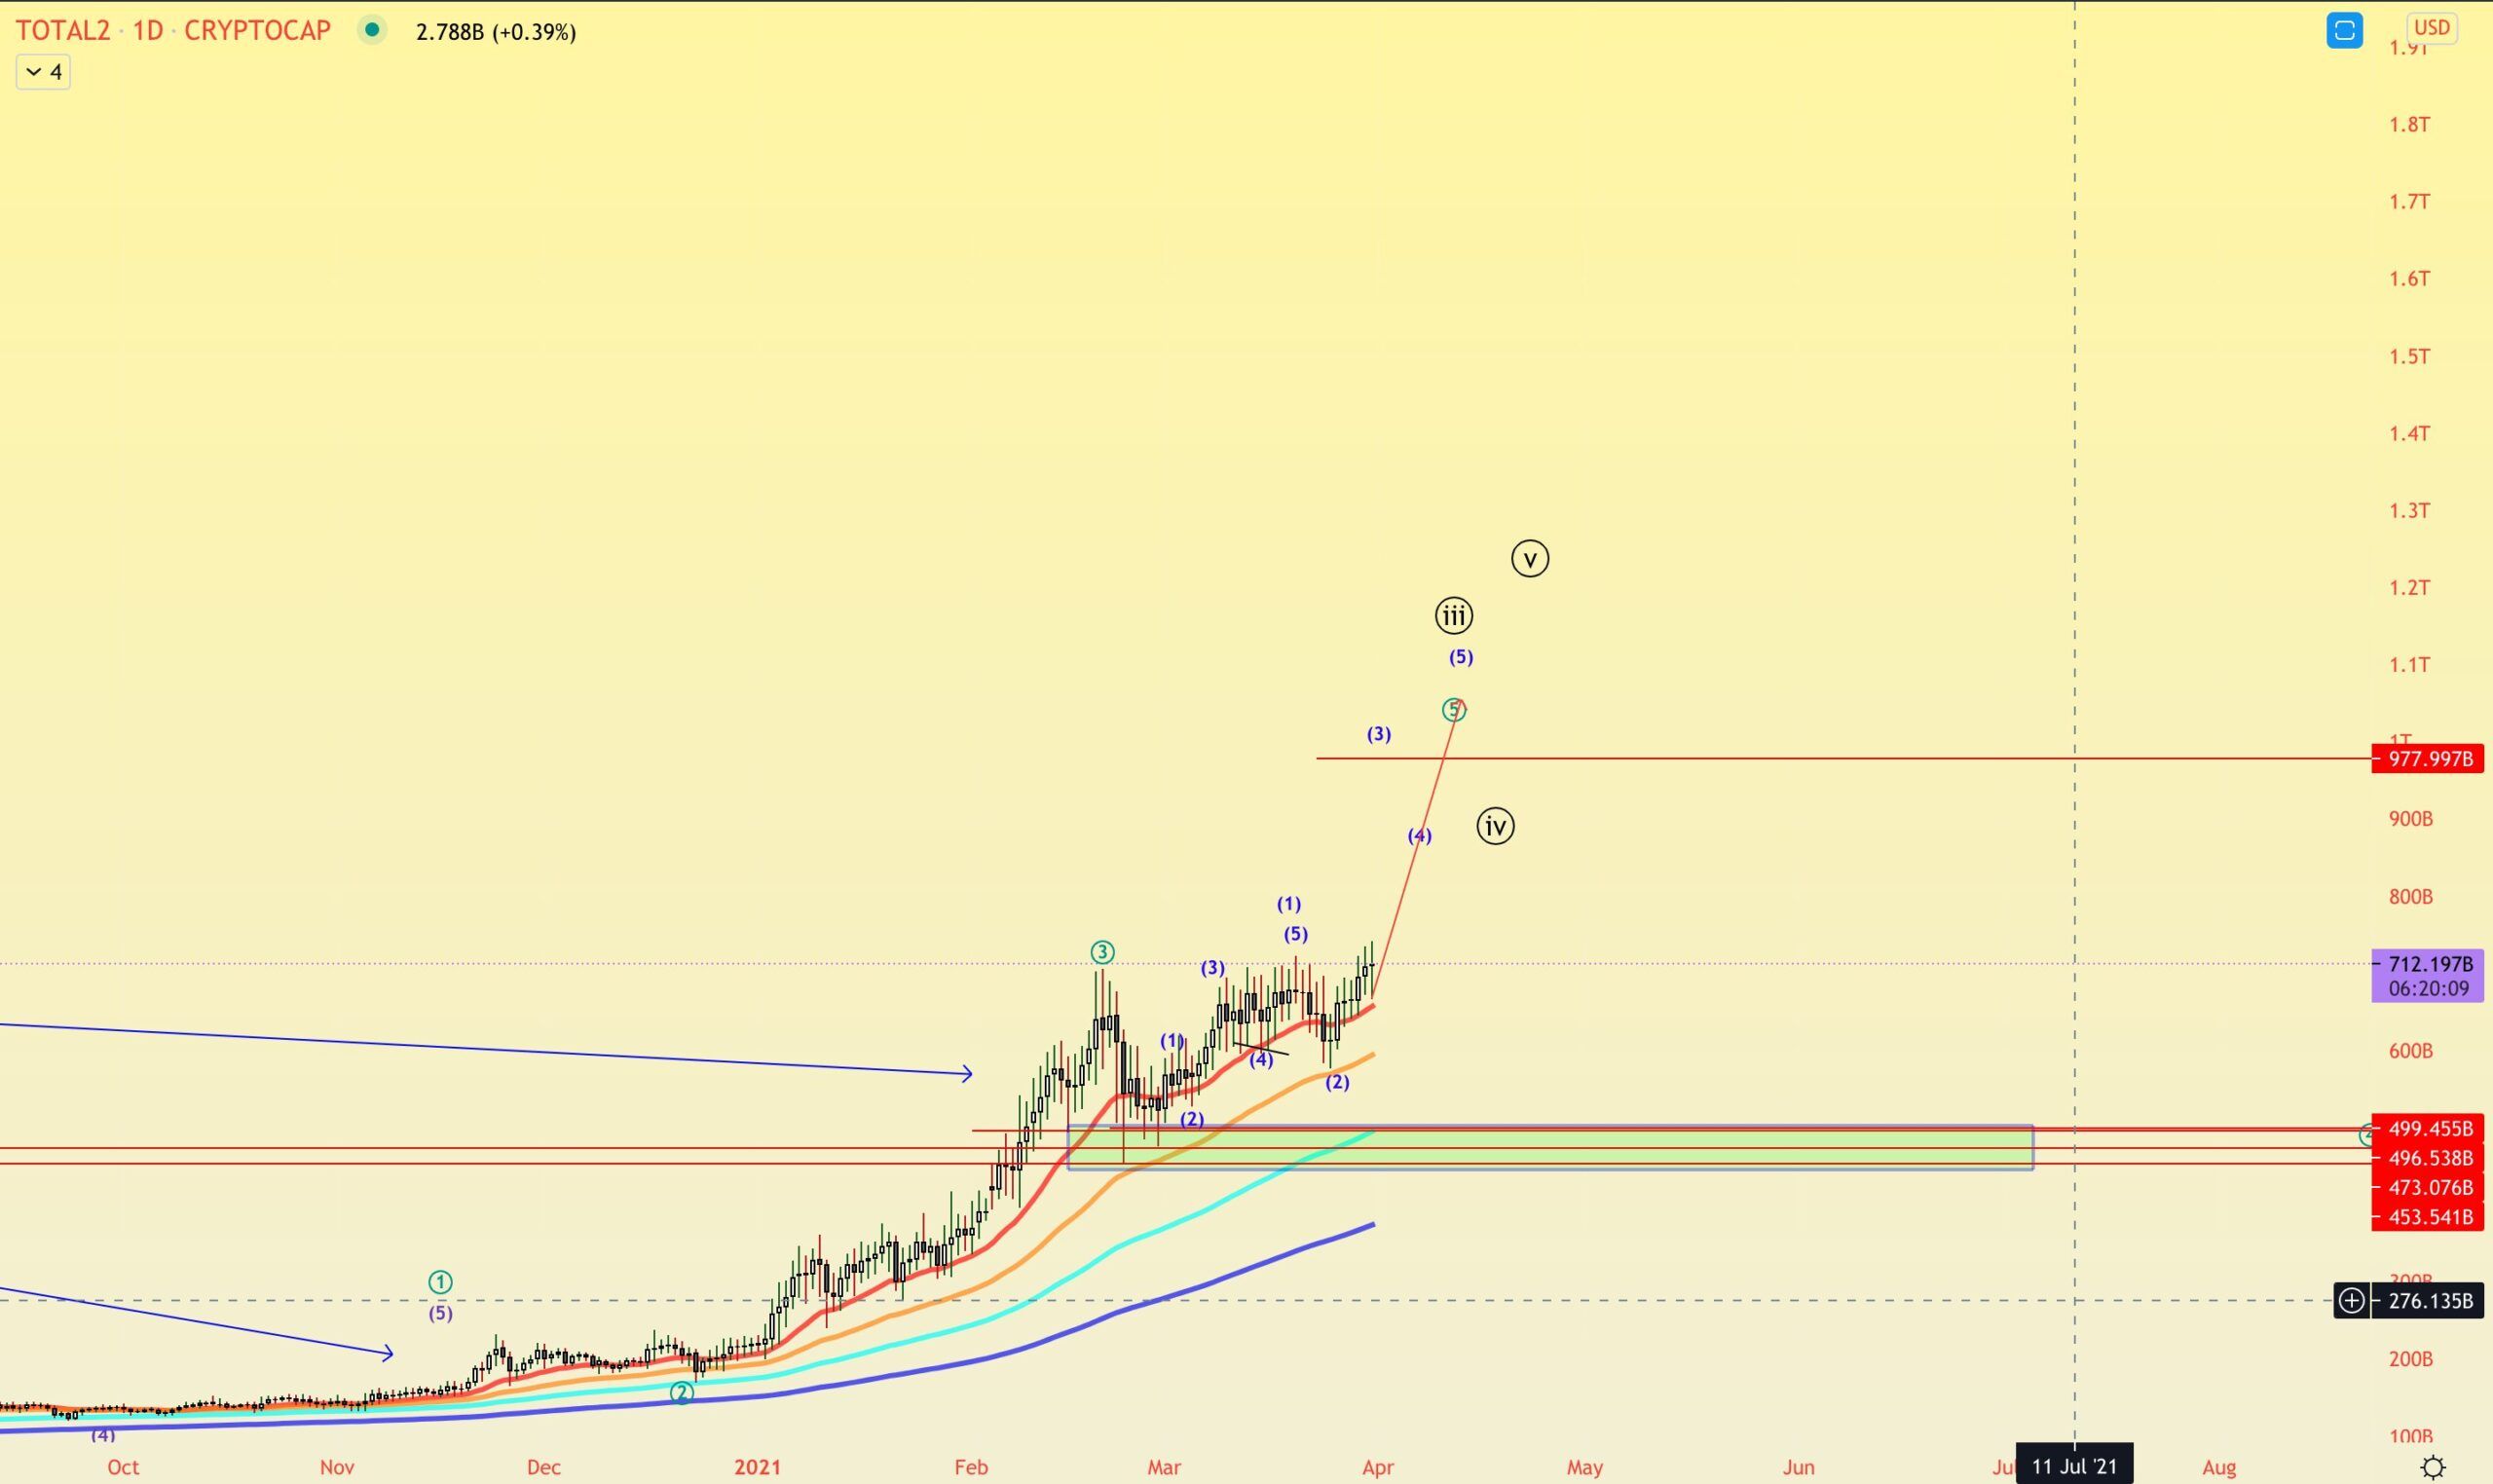
Cryptocurrency trader @altstreetbets outlined an altcoin market cap chart, which shows it moving upwards towards $950 billion.
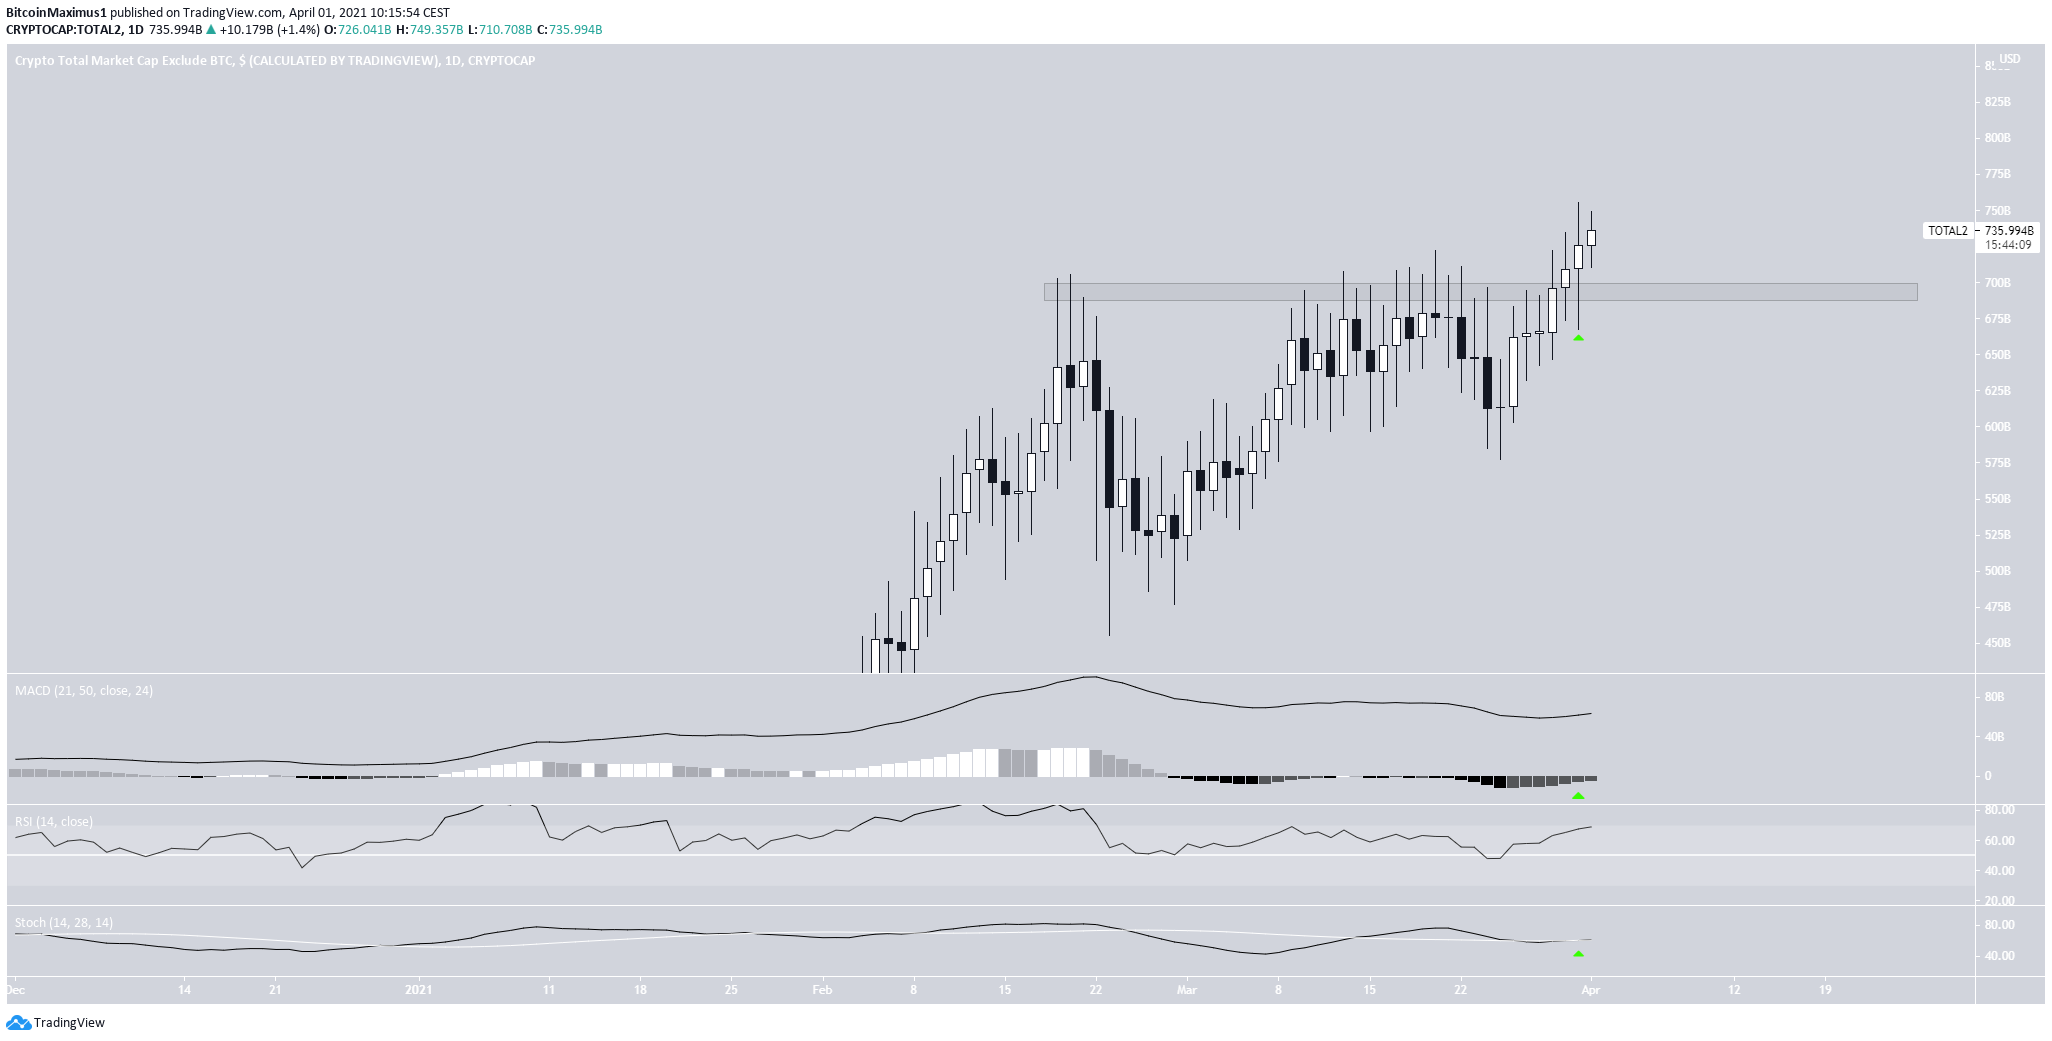
The altcoin market cap has broken out from and validated the previous all-time high resistance area at $700 billion as support.
It reached a new all-time high of $755 billion on March 31.
Technical indicators are bullish. Therefore, the market cap is expected to continue moving upwards.
Conclusion
The bearishness in the bitcoin dominance rate and bullishness in the altcoin market cap suggest that altcoins are likely to increase at a faster rate than BTC.
For BeInCrypto’s latest bitcoin (BTC) analysis, click here.


