


The bitcoin dominance rate (BTCD) is in the process of breaking out from a long-term descending resistance line, which could be the catalyst for a significant upward movement.
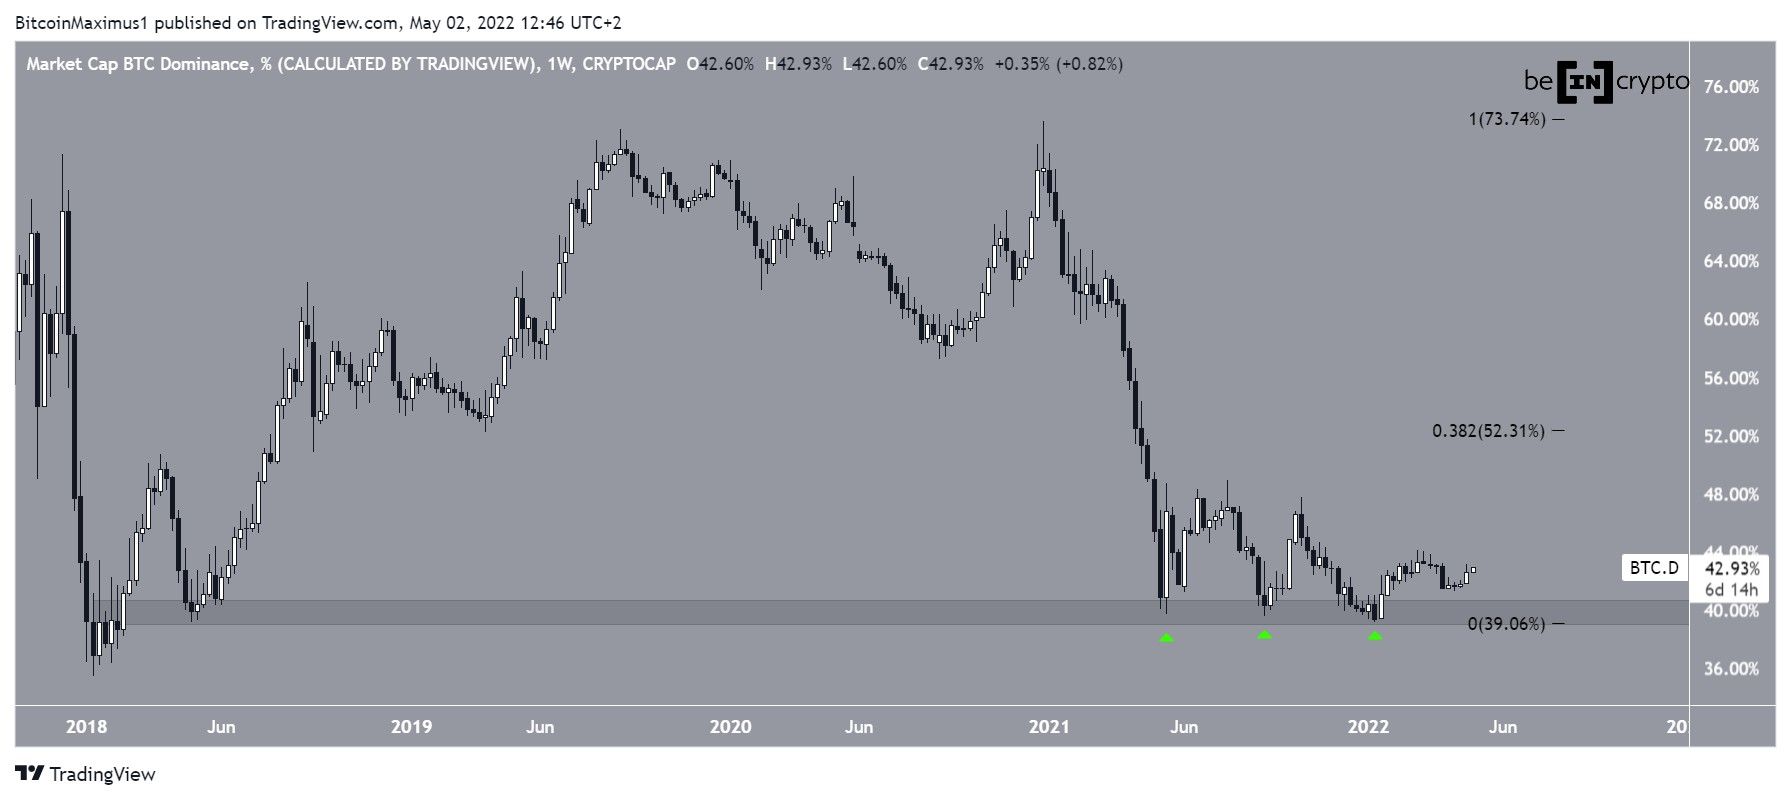
The weekly chart shows that BTCD has bounced thrice (green icons) at the 40% long-term support area. BTCD has not reached a close below this level since Jan 2018. The bounces created a triple bottom pattern.
The triple bottom is considered a bullish pattern, meaning that it leads to upward movements the majority of the time. The fact that it is transpiring inside an important support area increases its significance.
If an upward movement follows, the next closest resistance area would be at 52.30%. This is the 0.382 Fib retracement resistance level.
Future BTCD movement
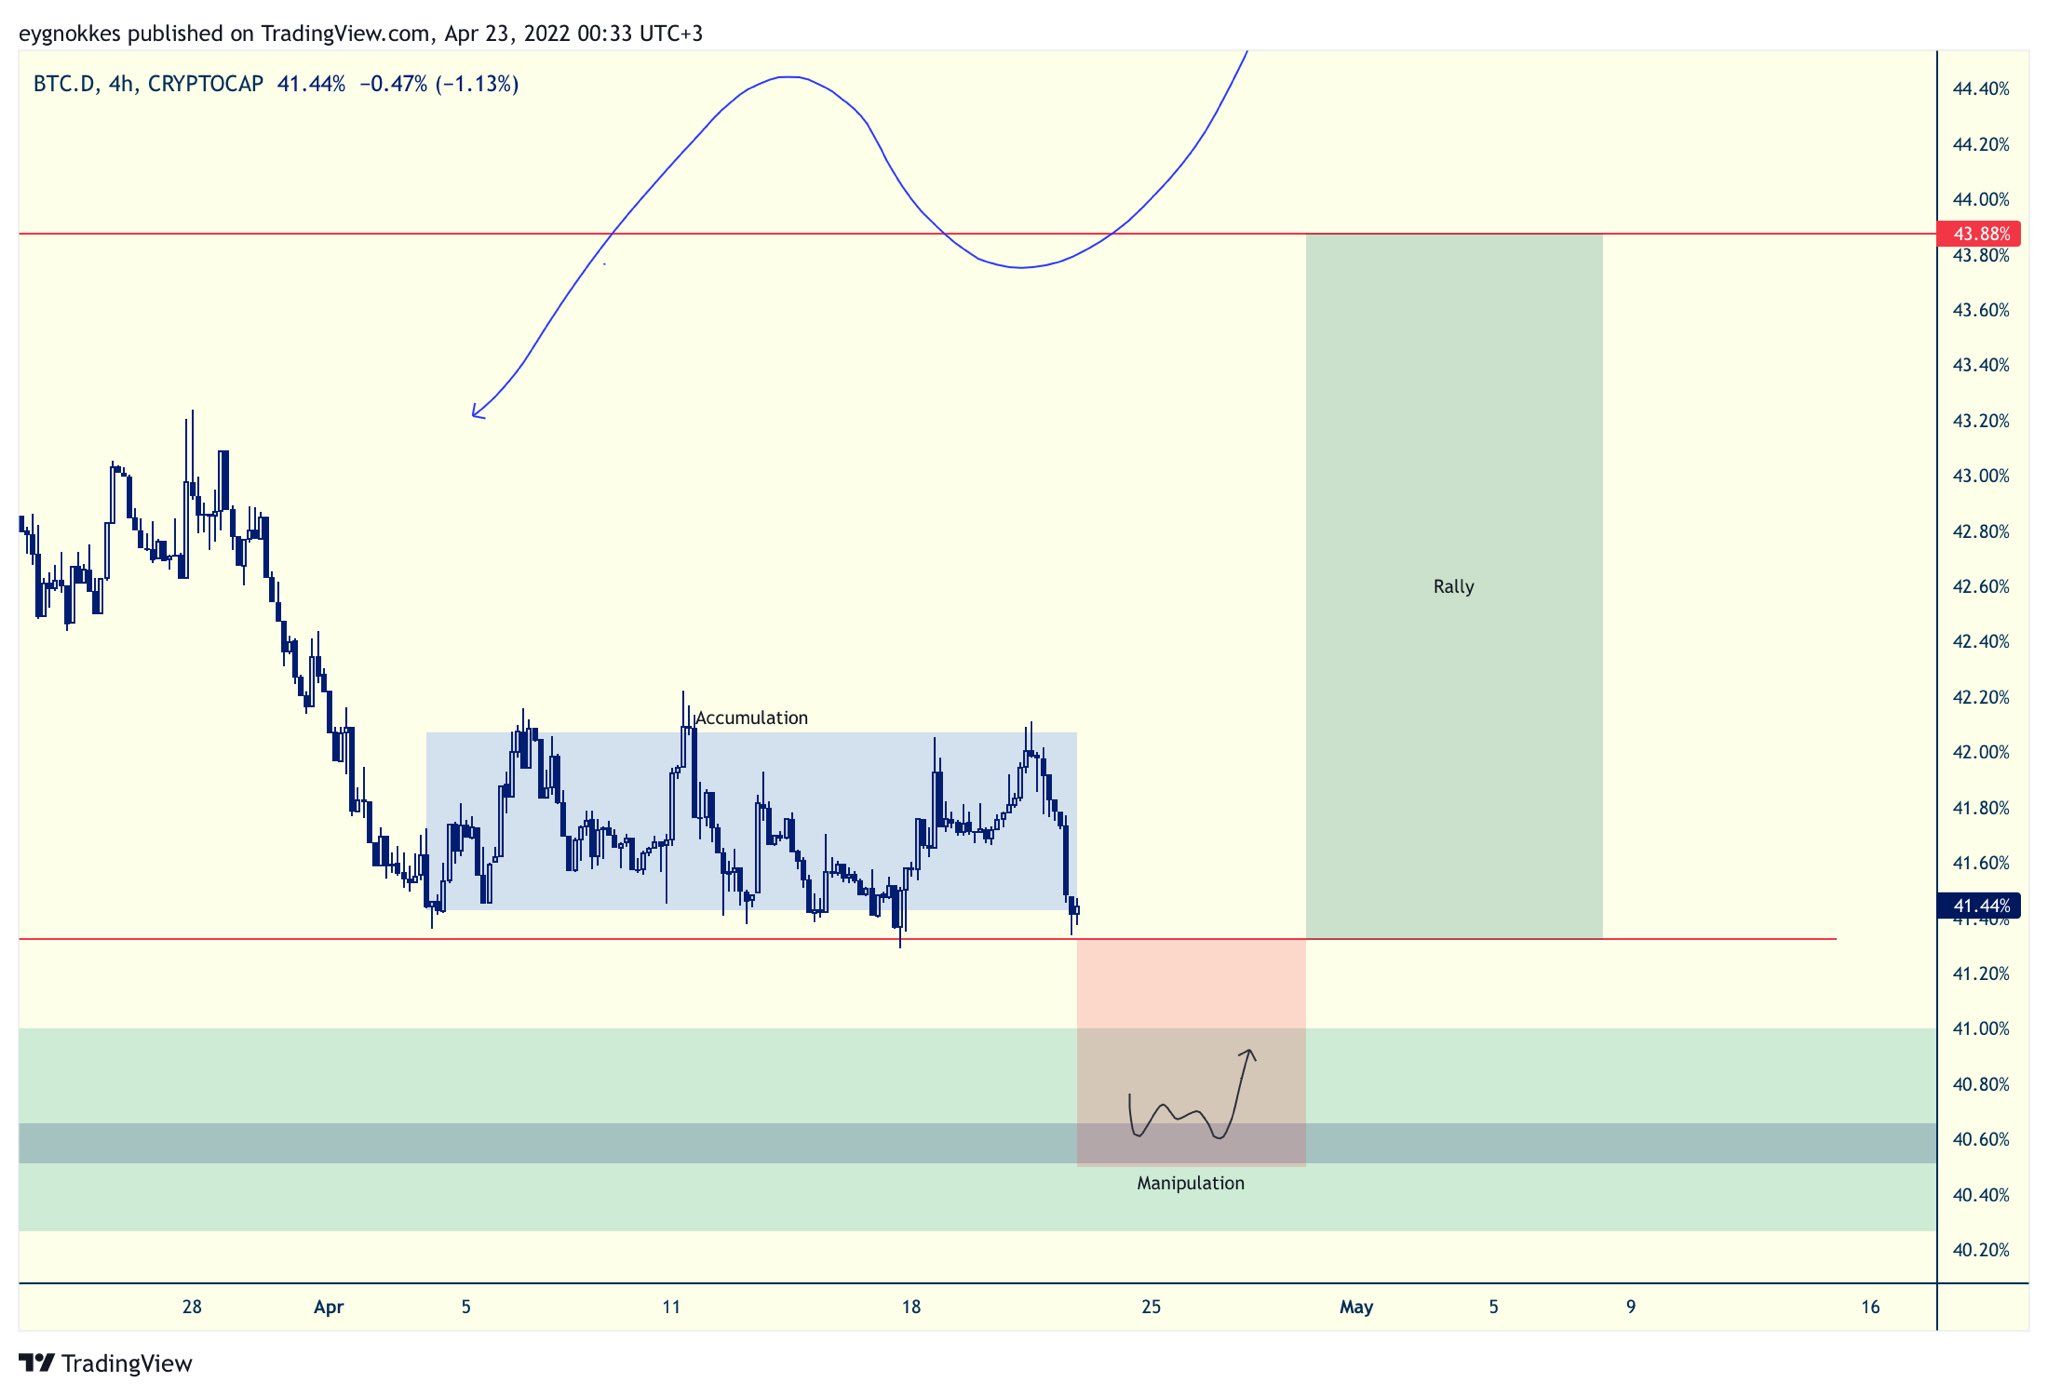
Cryptocurrency trader @eygnthebender tweeted a chart of BTCD, stating that another rally towards 44% is expected.
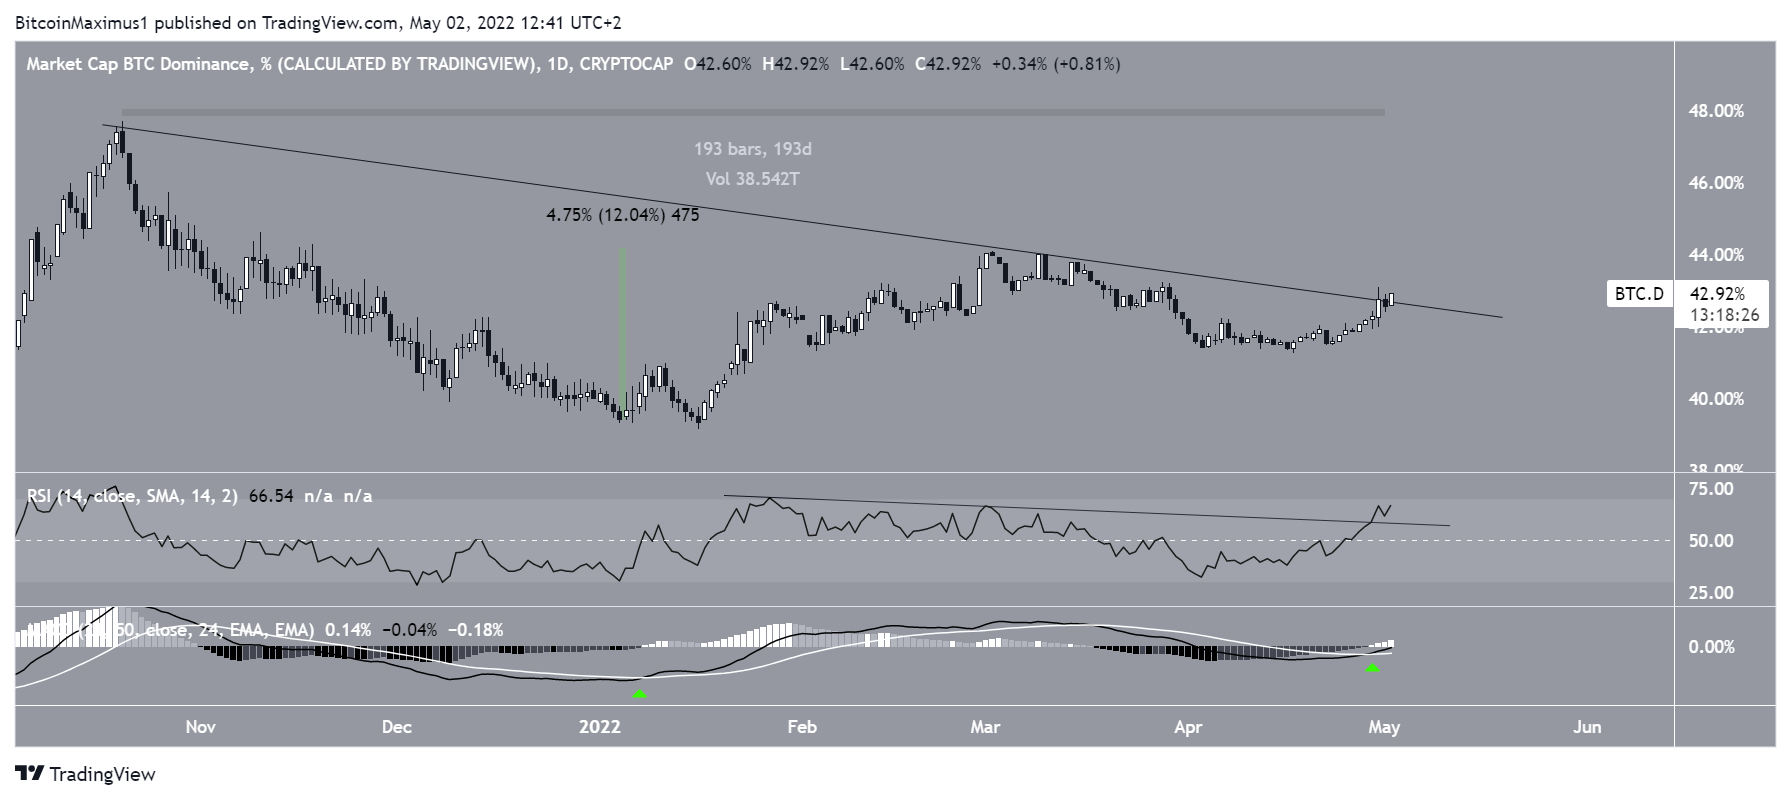
The daily time frame shows that BTCD has been decreasing underneath a descending resistance line since Oct 21. So far, the line has been in place for 193 days. Currently, BTCD is in the process of breaking out.
Technical indicators support the possibility of a breakout. The RSI has already broken out from its bearish trendline and is above 50. The MACD has made a bullish cross (green icon) and is nearly positive. The previous time such a cross occurred, an upward movement of 12% followed.
Therefore, if the breakout is confirmed, an upward movement towards 48% could occur, surpassing the target provided in the tweet.
Relationship to BTC
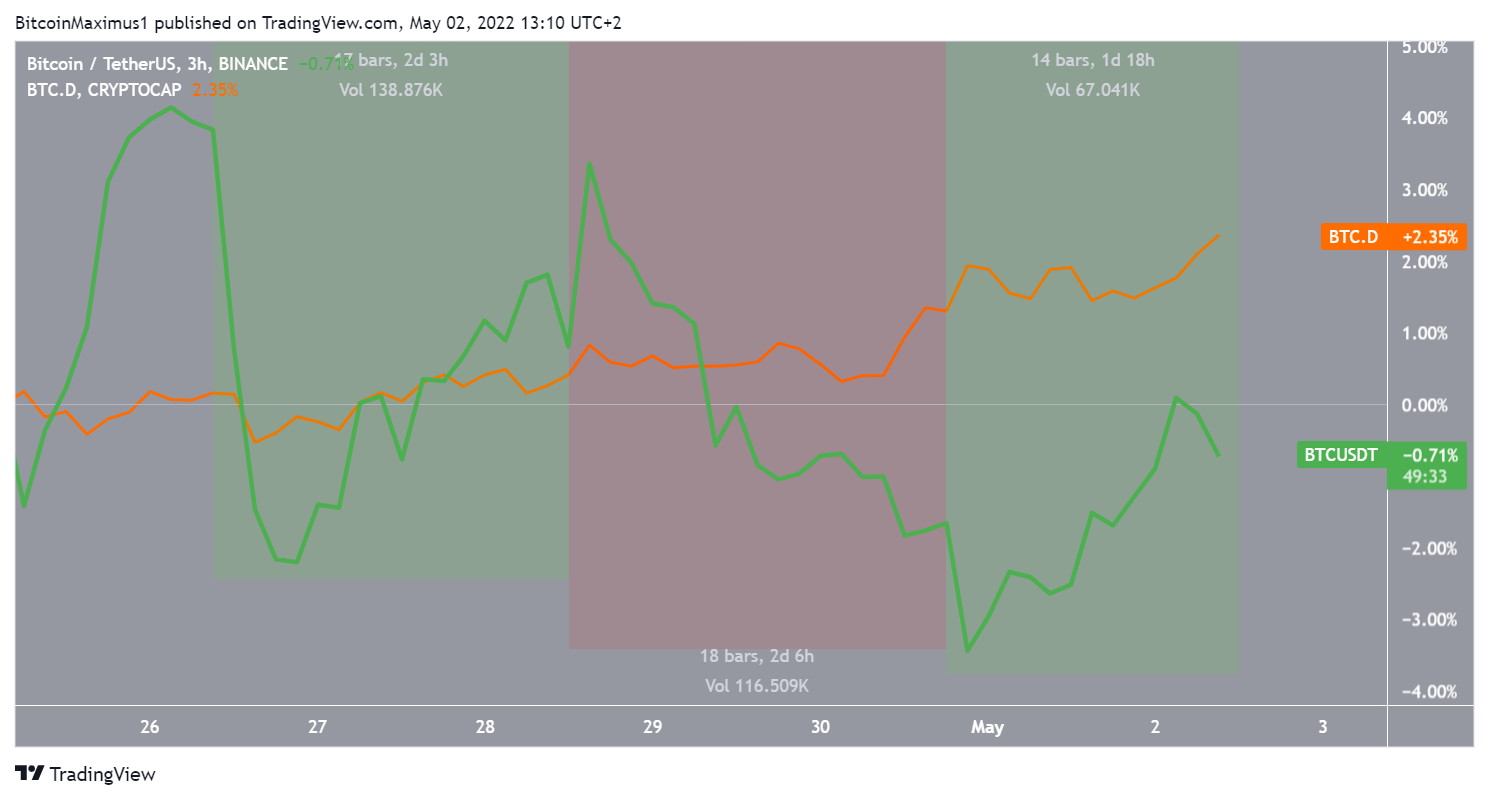
Over the past two weeks, the relationship between BTC (green) and BTCD (orange) has been mostly positive. This means that an increase in the price of the former has also caused an increase in the latter.
Therefore, an increase in the price of BTC would be required in order for the proposed BTCD increase to transpire.
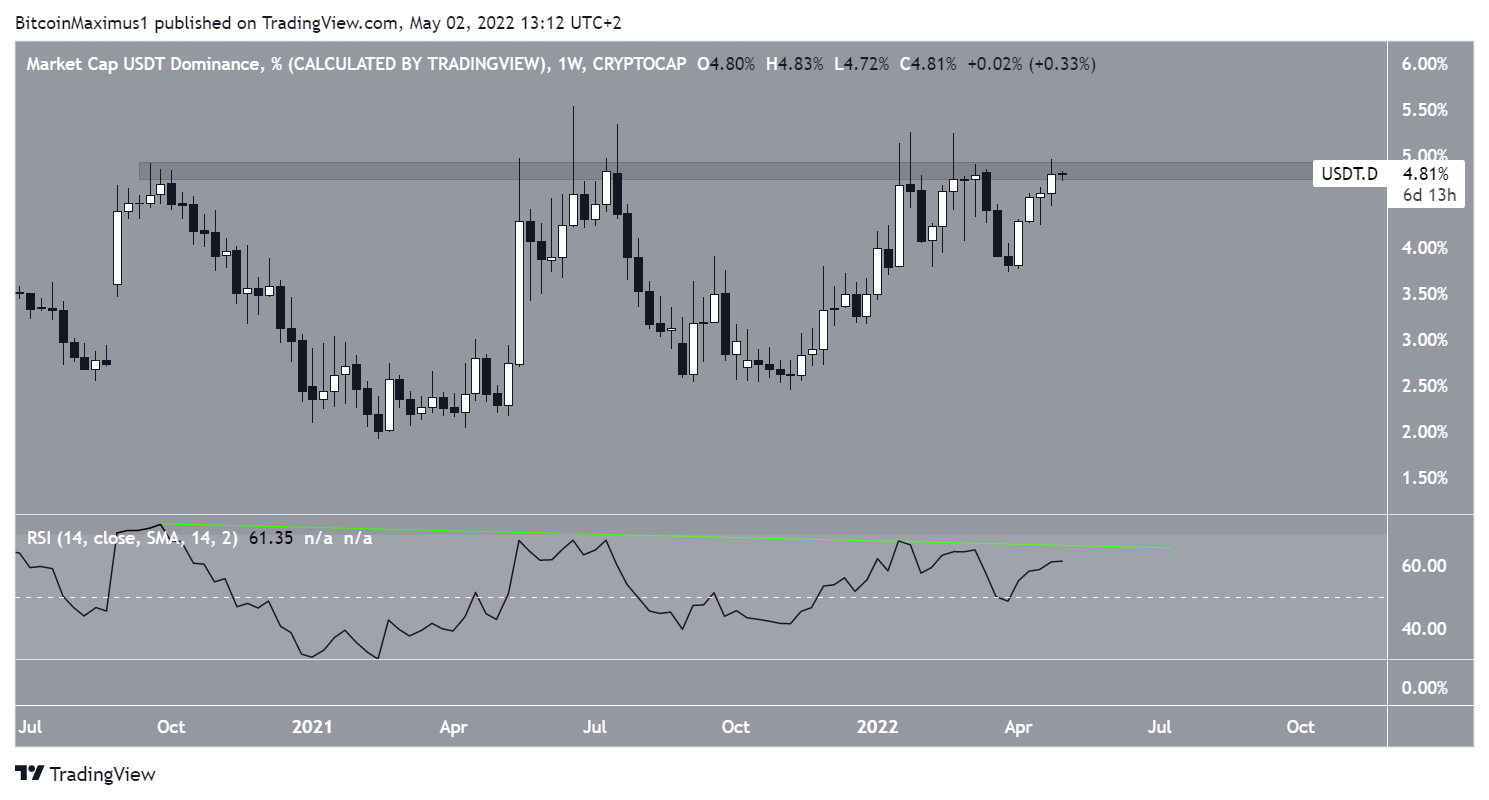
Finally, the USDT dominance seems to be creating a triple top pattern, which has been combined with a bearish divergence in the RSI (green line).
This is a bearish pattern that suggests a downward movement is likely.
So, to conclude, an analysis of BTCD, its relationship to BTC and the USDT dominance suggests that the BTC price will increase and pull up the dominance alongside it.
For Be[in]Crypto’s latest Bitcoin (BTC) analysis, click here


