


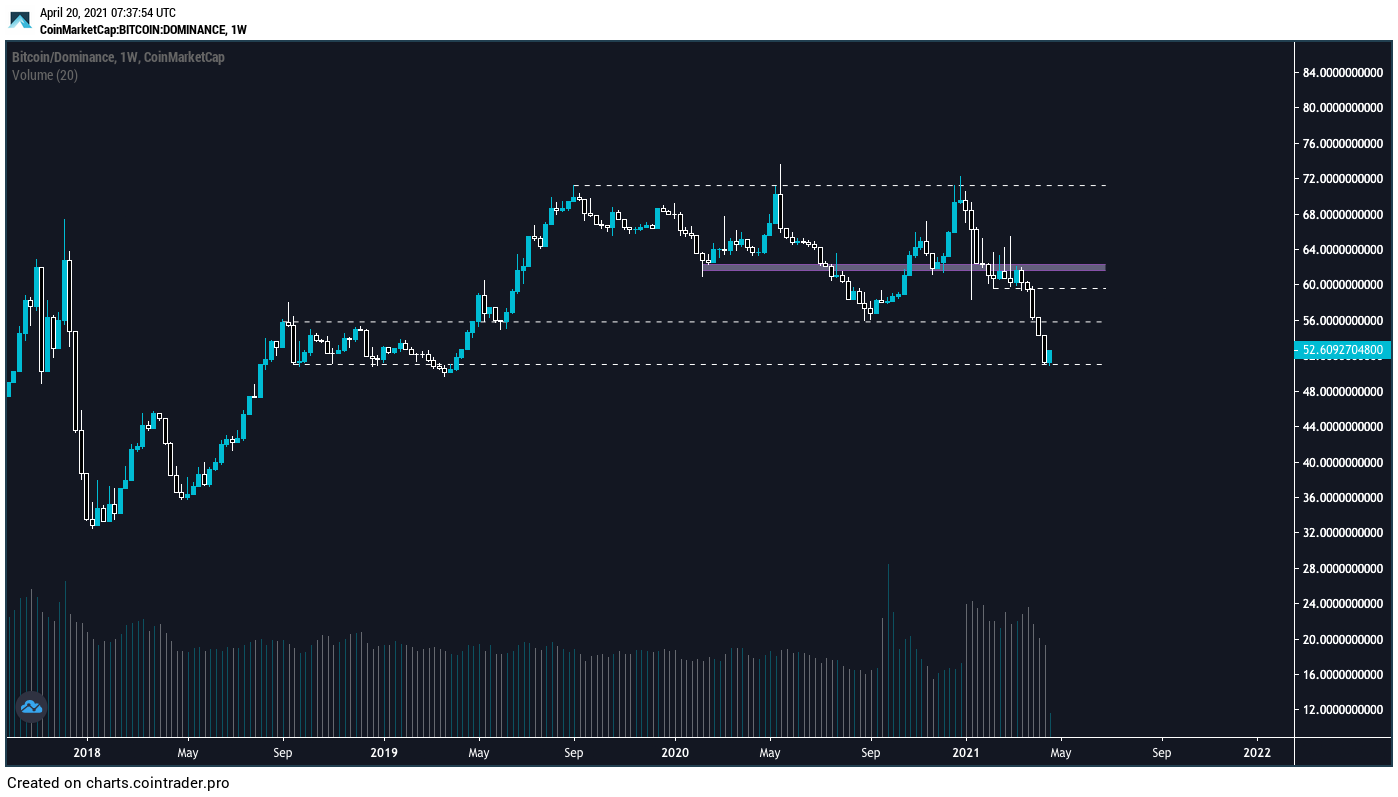
The bitcoin dominance rate (BTCD) has broken down from a long-term support area and reached levels not seen since 2018.
Despite some bullish signs in the short term, the BTCD is likely still mired in a bearish long-term trend. A continued decrease is likely.
Long-term BTCD levels
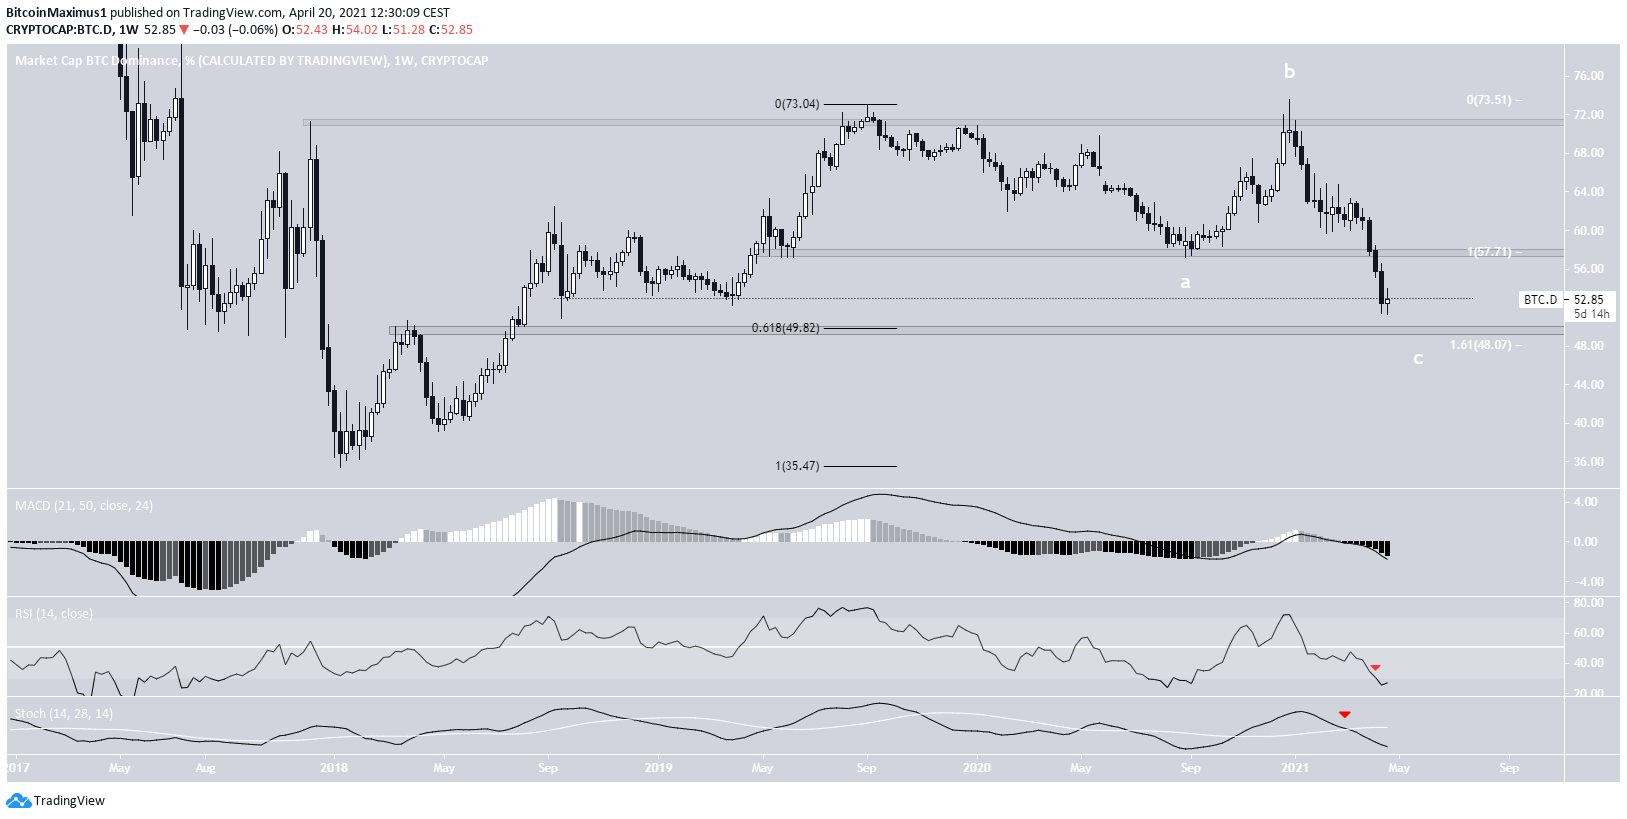
The BTCD has been decreasing since December 2020, when it reached a local high of 71.30%.
At the beginning of April, it fell below the 57.75% area. This is a level that previously acted as support since April 2019. Now, it’s likely to act as resistance.
While there appeared to be support at 53% (dashed line), the BTCD has fallen below it. When looking at closing percentages, the lowest close in 2018 was 53.35%. On the other hand, last week’s close was at 52.45%, signifying a breakdown.
The next support level is found at 49.75%. It’s both a horizontal support level and the 0.618 Fib retracement of the entire previous upward movement.
Technical indicators are bearish. The Stochastic oscillator has made a bearish cross, the MACD is negative, and the RSI has decreased below 30.
Therefore, in the long-term, it’s likely that the BTCD falls all the way to 49.80%.
It’s possible that the current drop is a flat A-B-C structure. In this pattern, waves A:C commonly produce a 1:1.61 ratio. This would suggest a bottom at 48%.
Daily BTCD movement
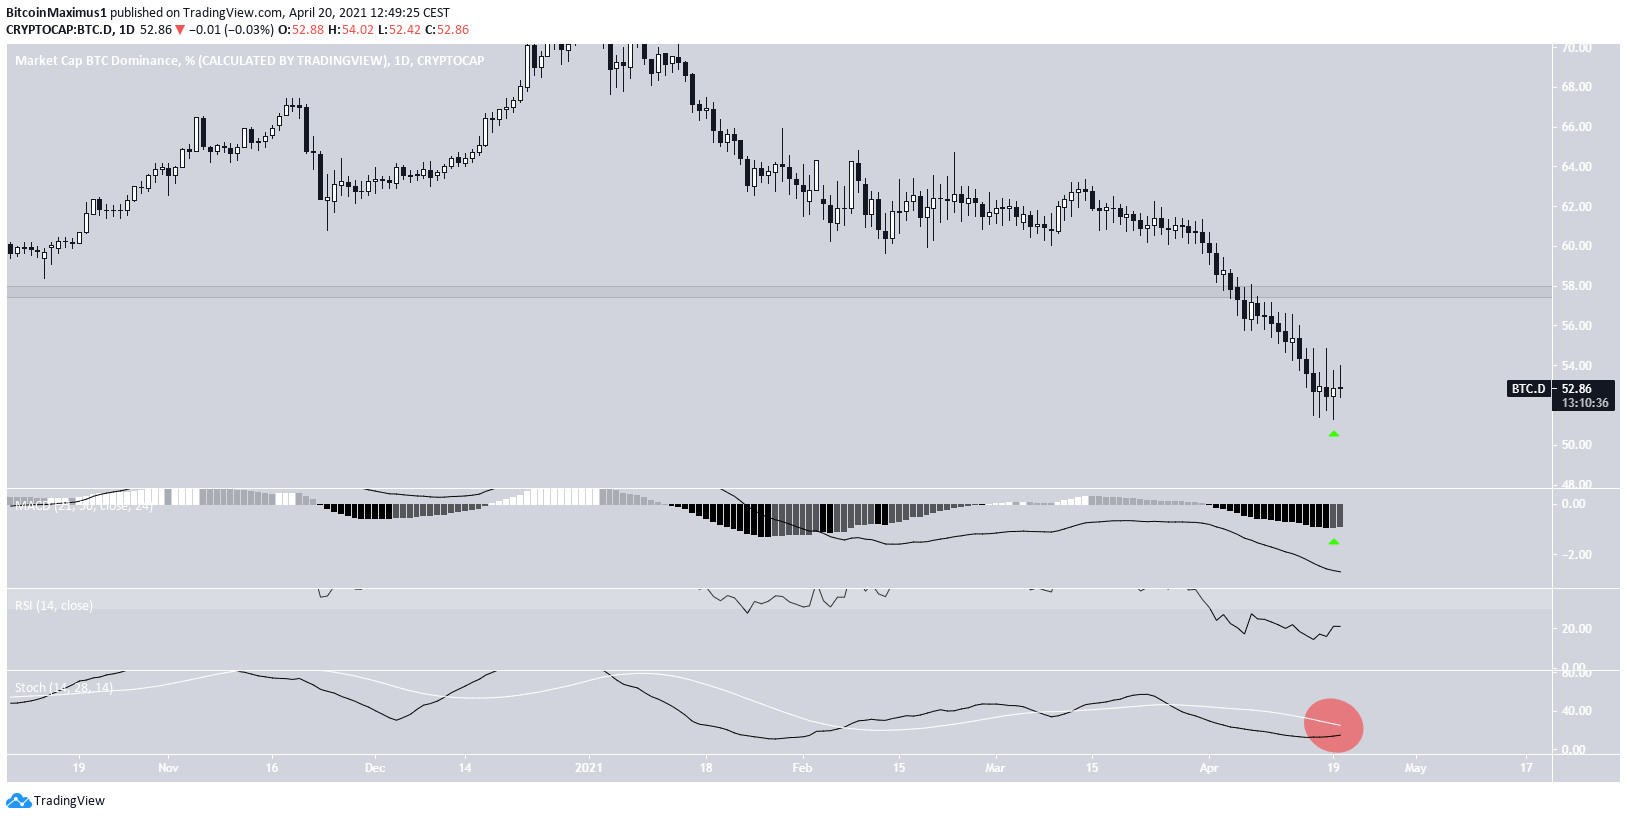
Cryptocurrency trader @PostyXBT outlined a BTCD chart, stating that a short-term relief bounce could occur. However, he believes that the trend is still bearish.
The daily chart is showing some small bullish reversal signs.
Firstly, yesterday’s candlestick had a bullish close (green arrow). Secondly, the MACD has created a higher momentum bar.
The Stochastic oscillator has also begun to move upwards. Despite this, it has yet to make a bullish cross (red circle).
Furthermore, the RSI is deep into oversold territory and has not generated any bullish divergence.
Therefore, until the MACD gives a bullish reversal signal and/or the Stochastic oscillator makes a bullish cross, we cannot confirm a reversal.
Conclusion
The bitcoin dominance rate is likely to continue decreasing towards the long-term 49.75% support area.
While some short-term relief could occur, the chances of a bullish reversal seem slim.
For BeInCrypto’s latest bitcoin (BTC) analysis, click here.


