


The bitcoin dominance rate (BTCD) has been decreasing since July 30 and broke down from an ascending wedge on Aug 11.
Both the trend and wave count seem to be bearish, therefore a continued decrease toward a new all-time low could transpire.
BTCD breaks down
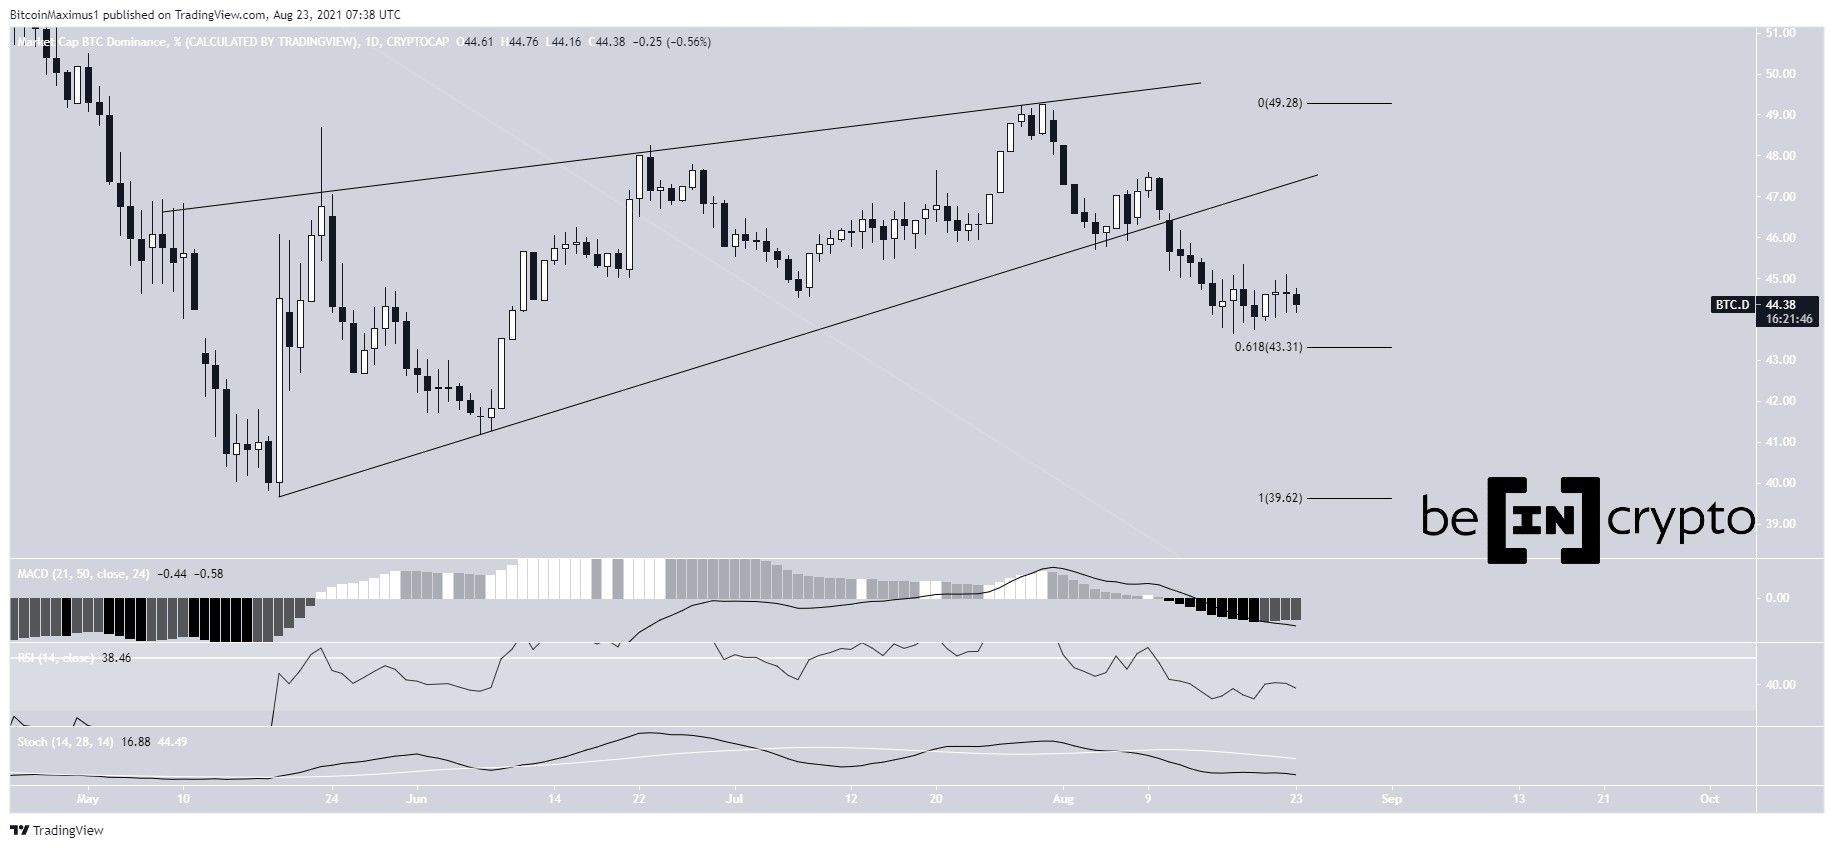
BTCD had been increasing inside an ascending wedge beginning on May 19. It consolidated inside this pattern until it reached a high of 49.24 on July 30. Since then, it has been moving downwards.
It broke down from the wedge on Aug 11 and has been moving downwards at an accelerated rate since. Currently, it’s just above the 0.618 Fib retracement support level at 43.30%. If it breaks down from here, the next support would be found at 39.60%.
Technical indicators are bearish. While the MACD has given a bullish reversal signal, it’s still below 0. The RSI is also below 30 and the Stochastic oscillator has made a bearish cross.
Therefore, it’s likely that the trend as a whole is bearish.
Wave count
Cryptocurrency trader @Jackis_trader outlined a bitcoin dominance chart, stating that another drop towards a new all-time low would be likely.
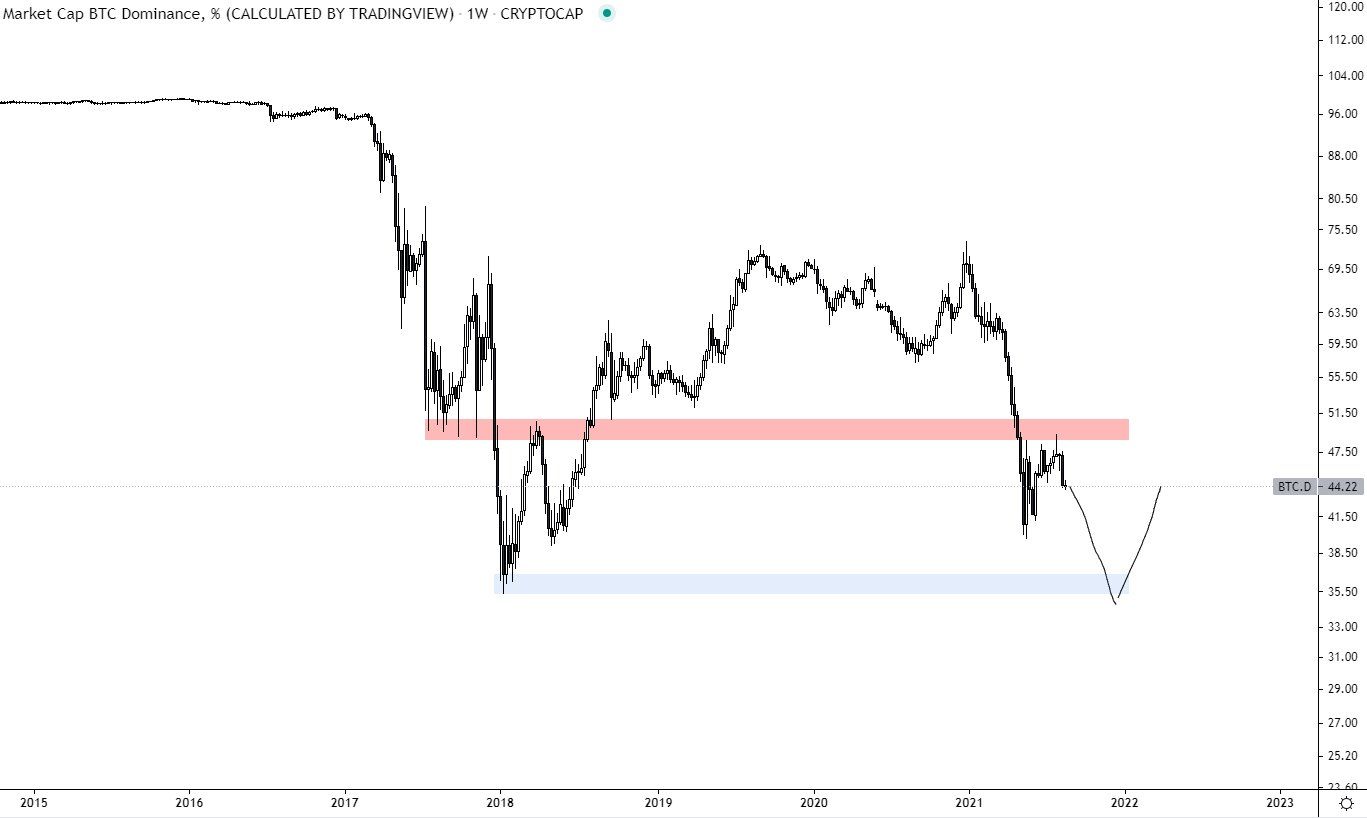
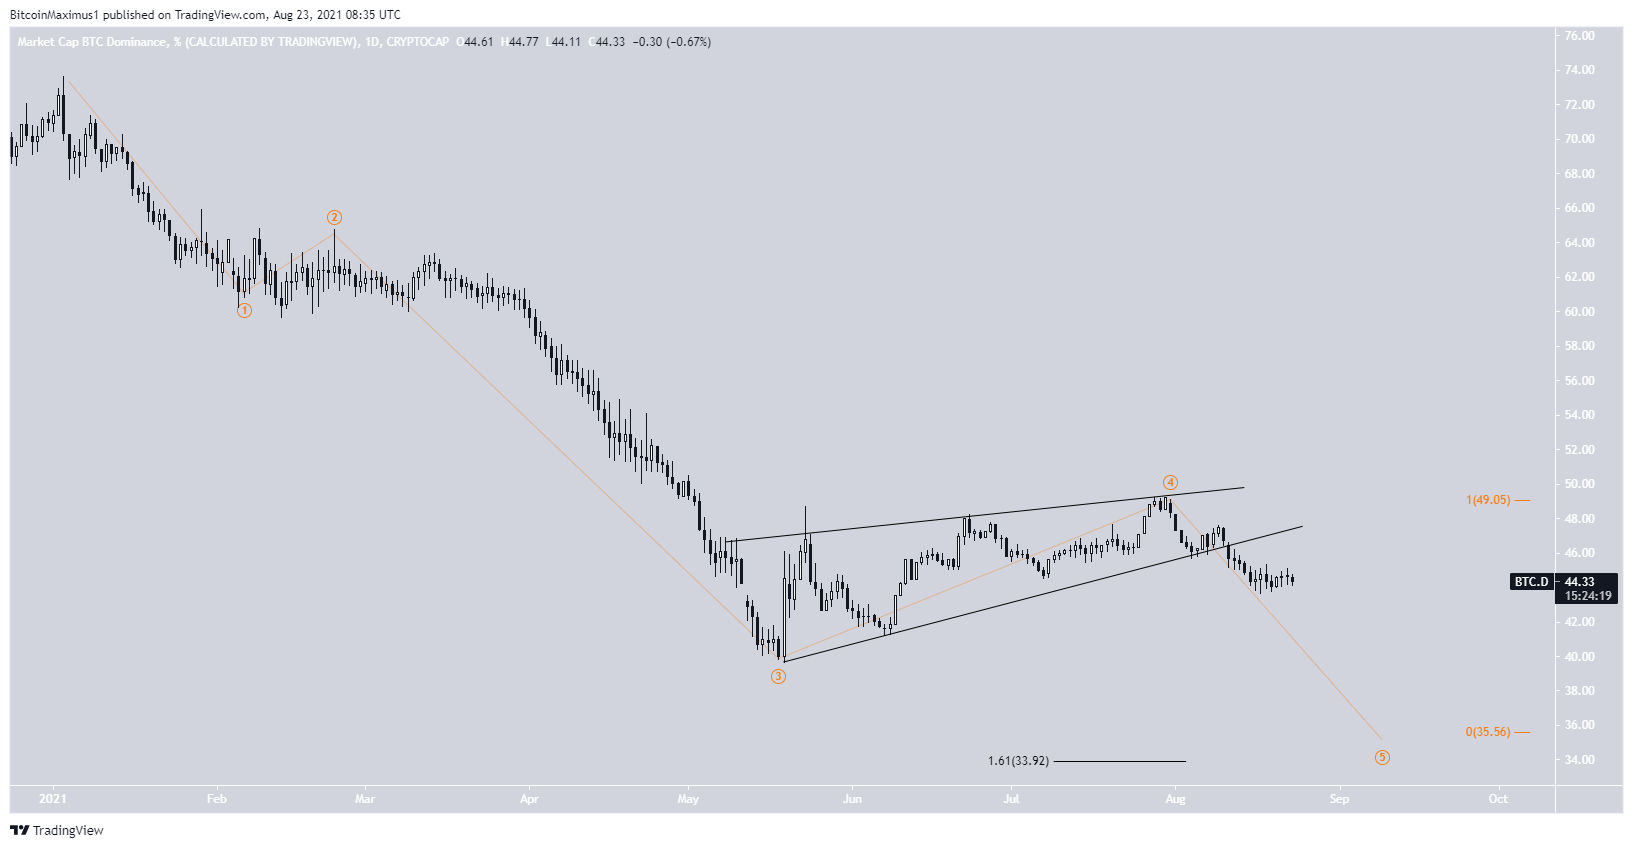
The most likely wave count supports the possibility that BTCD will reach a new all-time low.
If the current rally is part of a fifth wave, the most likely downside target is between 33.9-35.5%. This range is found by using an external Fib retracement on wave four (black) and the length of wave one (orange).
Relationship to BTC
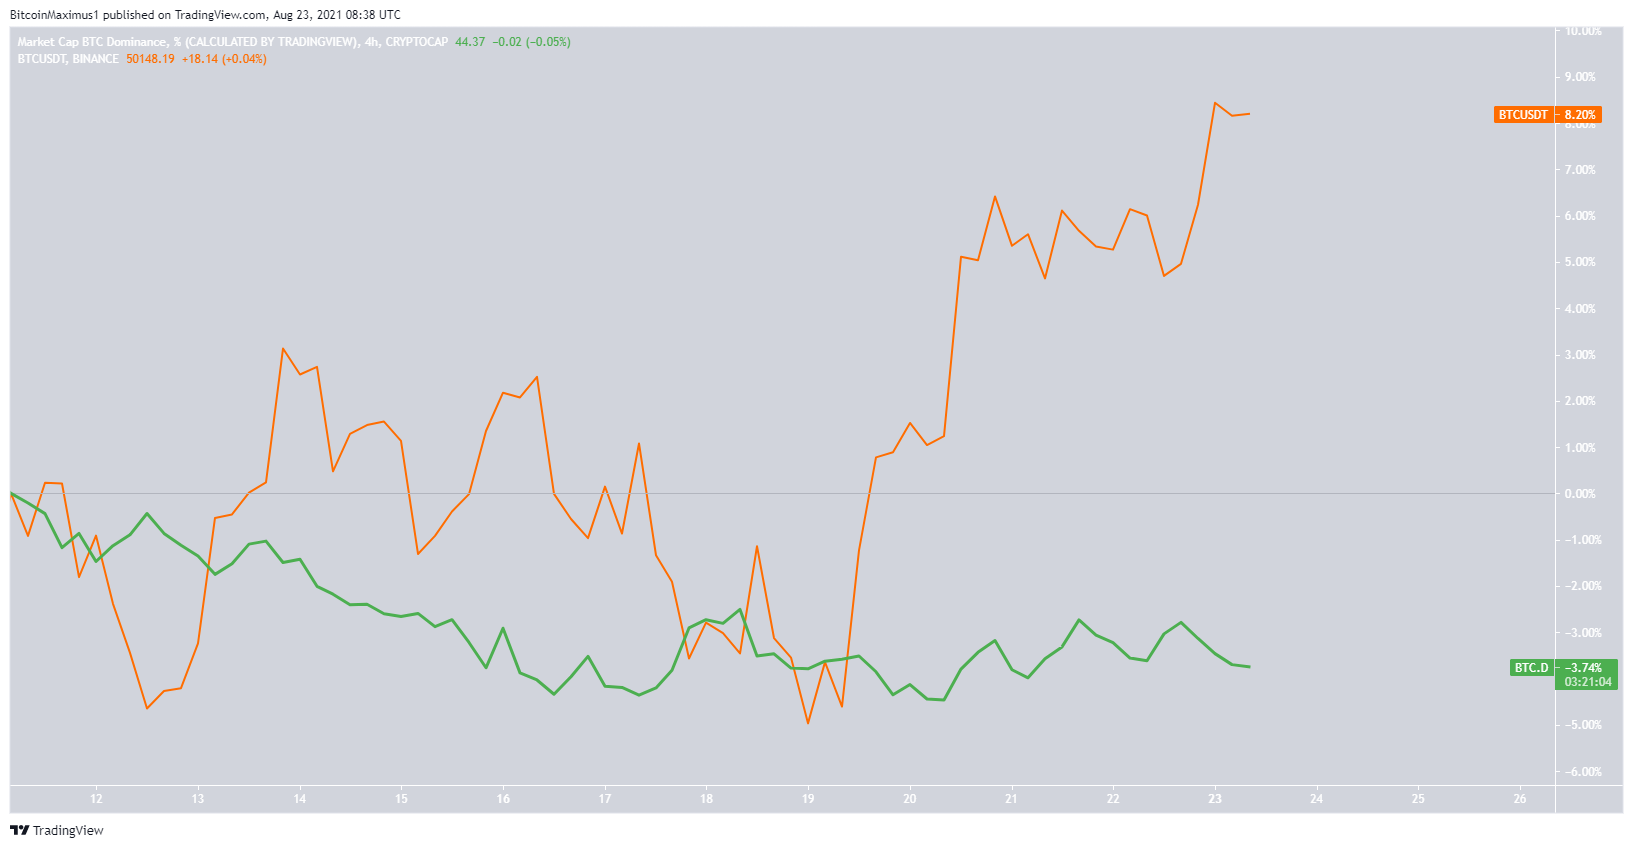
The relationship between BTCD (green) and BTC (orange) has been mostly negative for the past two weeks. This means that an increase in the price of BTC has caused a decrease in the dominance rate.
However, the relationship has not been clear cut. In the short-term, price increases have caused decreases in the BTCD.
A continued medium-term increase in the price of bitcoin could actually cause the dominance fall to a new all-time low.
For BeInCrypto’s latest Bitcoin (BTC) analysis, click here.


