


On August 9, 2019, the Bitcoin Cash price reached a low of ₿0.026. A rapid upward move followed shortly after and BCH reached a high of ₿0.033 on August 14. It has been gradually decreasing since.
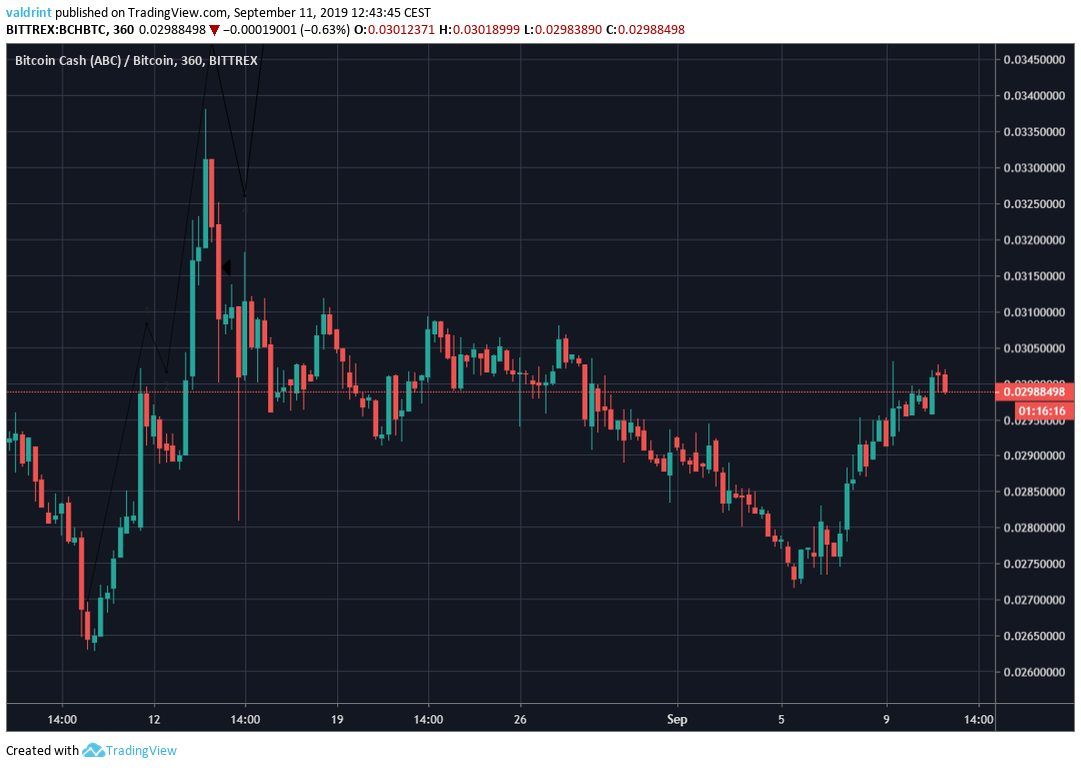
At the time of writing, BCH was trading at ₿0.03. Where will the price go to next? Continue reading below if you want to find out.
For our previous analysis click here.
Bitcoin Cash Price: Trends and Highlights for September 11
- BCH/BTC is trading inside a symmetrical triangle.
- The price is trading above its daily moving averages.
- A short-term bearish divergence has developed in the RSI.
- The 4-hour MACD has made a bearish cross.
- There is support at ₿0.0286.
Symmetrical Triangle
A look at the daily time-frame shows that BCH has been trading inside a symmetrical triangle since July 5.
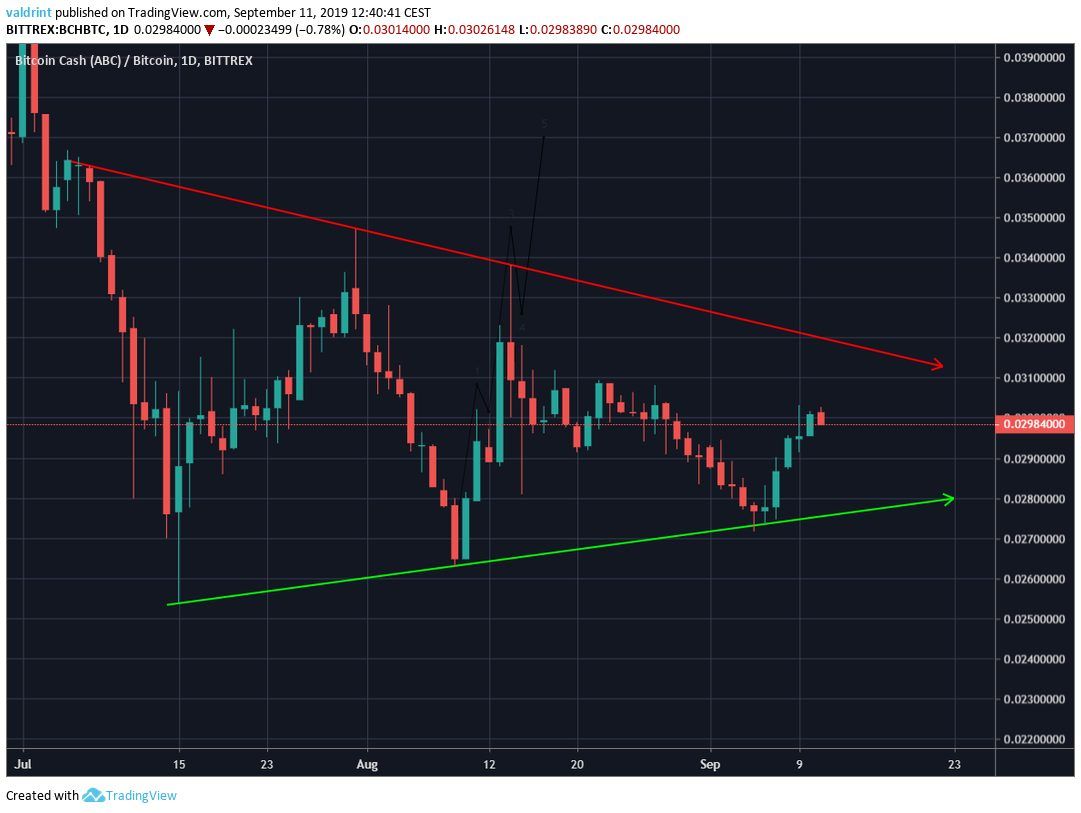
At the time of writing, it was trading in the middle of the triangle.
It is doing so after bouncing from the support line on September 5.
Both the resistance and support lines have been validated three times.
Moving Averages
A look at the daily moving averages (MA) indicates that the relationship between the price and its MAs is at a critical point.
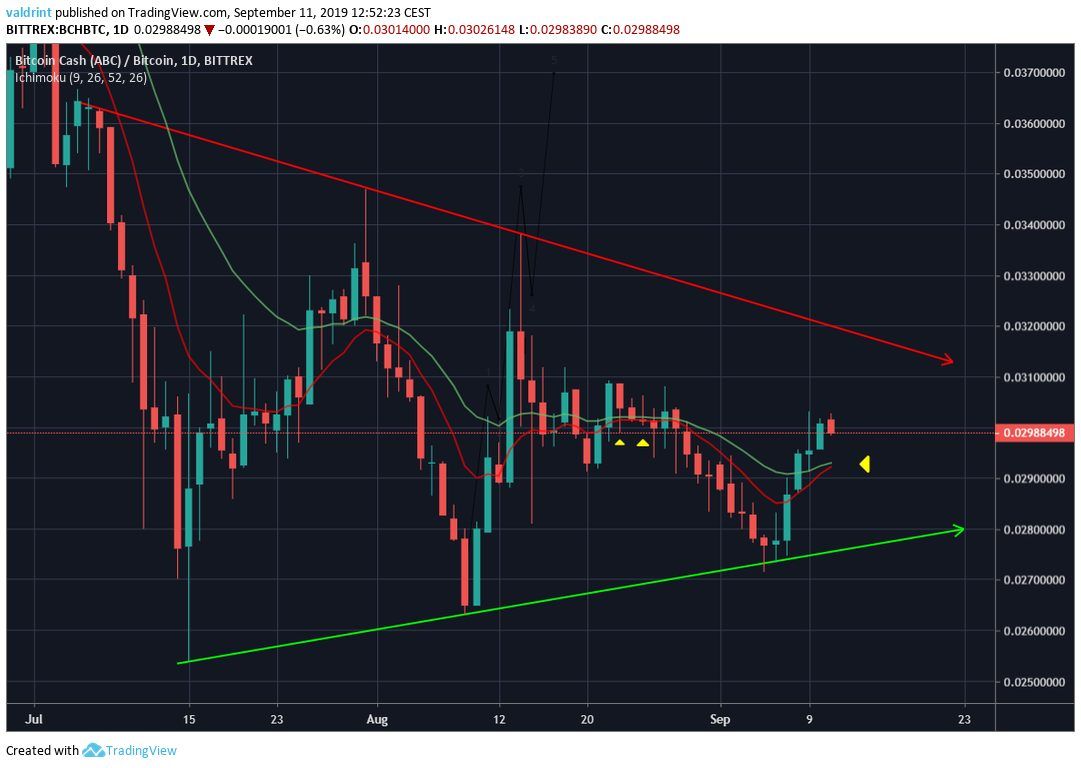
The price is trading above the 10- and 20-day MAs, which are very close to making a bullish cross.
Throughout August, the MAs almost made a cross on several occasions.
However, the efforts ultimately proved to be futile, since the cross was eventually rejected and the price fell to the support line.
Whether the bullish cross is confirmed or rejected will go a long way in determining the direction of the next move.
Let’s take a look at the short-term to see if we can determine where the price will go next.
Short-Term
A look at the 4-hour RSI & MACD reveals that the rally has developed weakness.
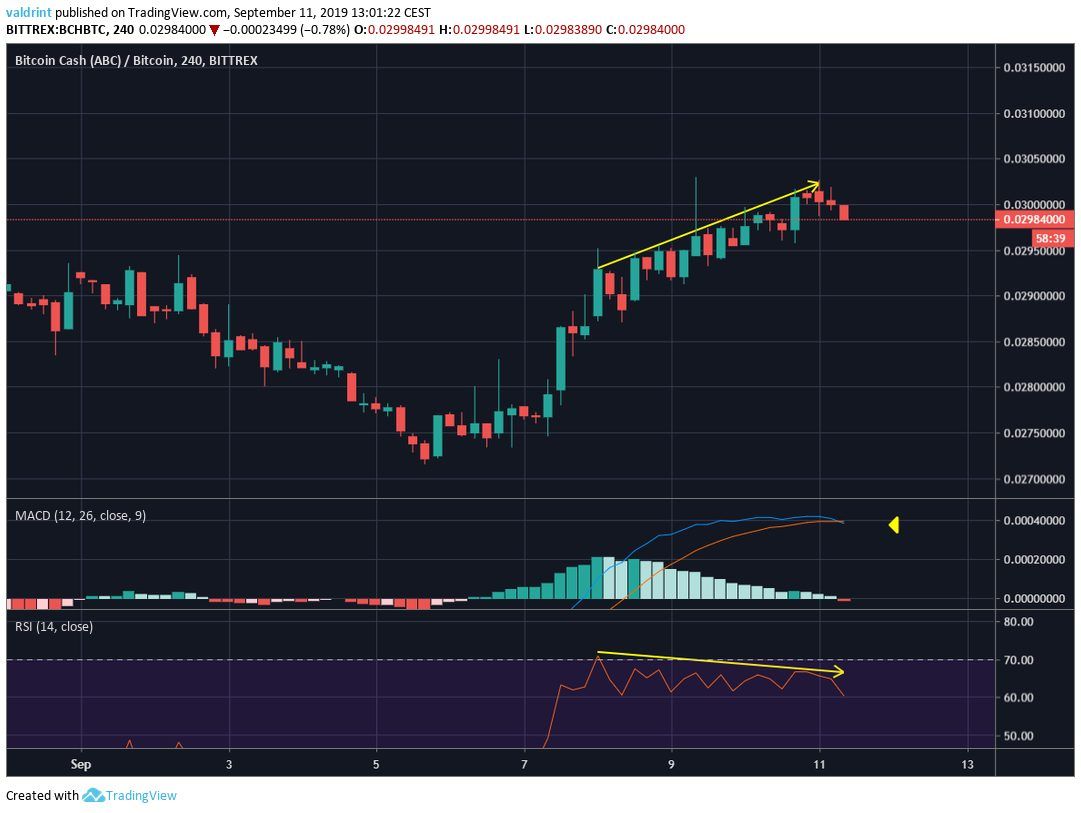
Bearish divergence is present since September 7.
The divergence is significant and visible up until the 4-hour time-frame.
Additionally, the MACD has just made a bearish cross.
Bitcoin Cash Price Future Movement
An outline of a possible price movement is given below.
Additionally, one support area is traced.
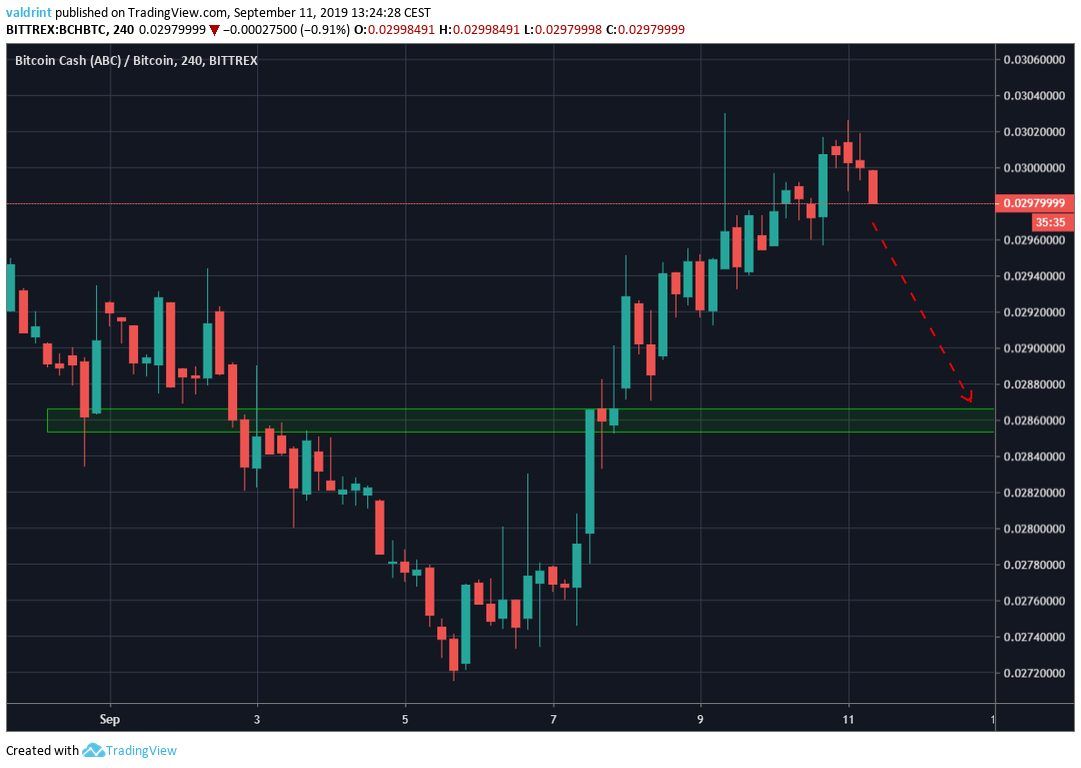
It is found at ₿0.0286.
We believe that the price will reach this area.
Bitcoin Cash Price Summary
The BCH price is trading inside a symmetrical triangle.
According to our analysis, a short-term decrease towards the support area outlined above is likely to occur.
Afterward, the price should resume its upward move towards the resistance of the triangle.
For hypothetical trading purposes, BCH would be considered a buy close to ₿0.0286.
Do you think that BCH will reach the support area? Let us know in the comments below.
Disclaimer: This article is not trading advice and should not be construed as such. Always consult a trained financial professional before investing in cryptocurrencies, as the market is particularly volatile.
Images are courtesy of Shutterstock, TradingView.


