The Bitcoin Cash (BCH) price has been declining since it validated the $275 resistance area on April 8. Until it breaks out above this level, the price action is bearish.
Current Resistance
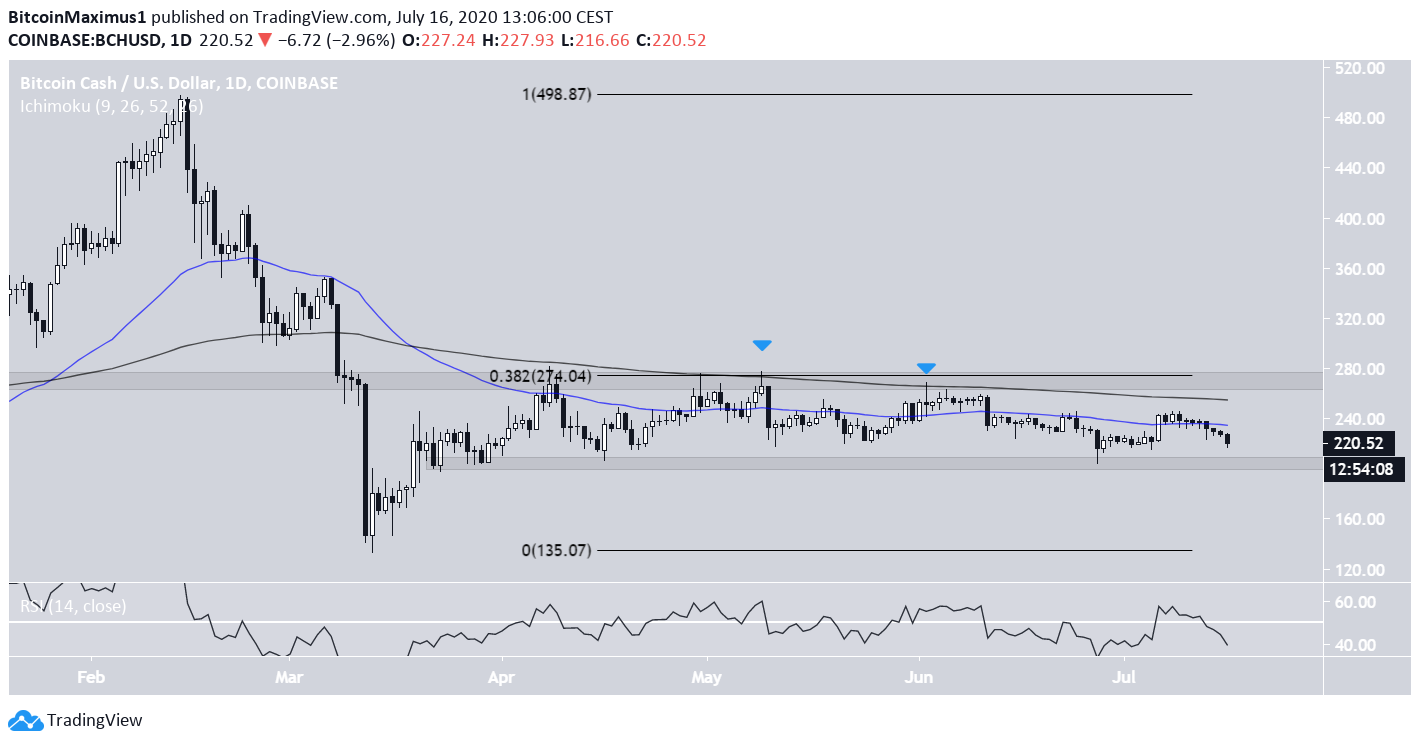
The BCH price has been declining since February 16, when it reached a high of $496. The price reached a bottom on March 13, then began an upward move that took it to $275 on April 8, and has been declining since.
This validated the $275 area as resistance, which is also the 0.382 Fib level of the entire downward move. The price is also facing resistance from both the 50 and 200-day moving averages (MA), which have made a bearish cross.
Until the price breaks out above both these MAs and the $275 resistance area, the price action is bearish. The closest support area is found at $200.
Wave Count
Cryptocurrency trader @TheEWguy outlined a BCH Chart, in which he predicts a final drop towards $170, before a long-term upward move towards $700.
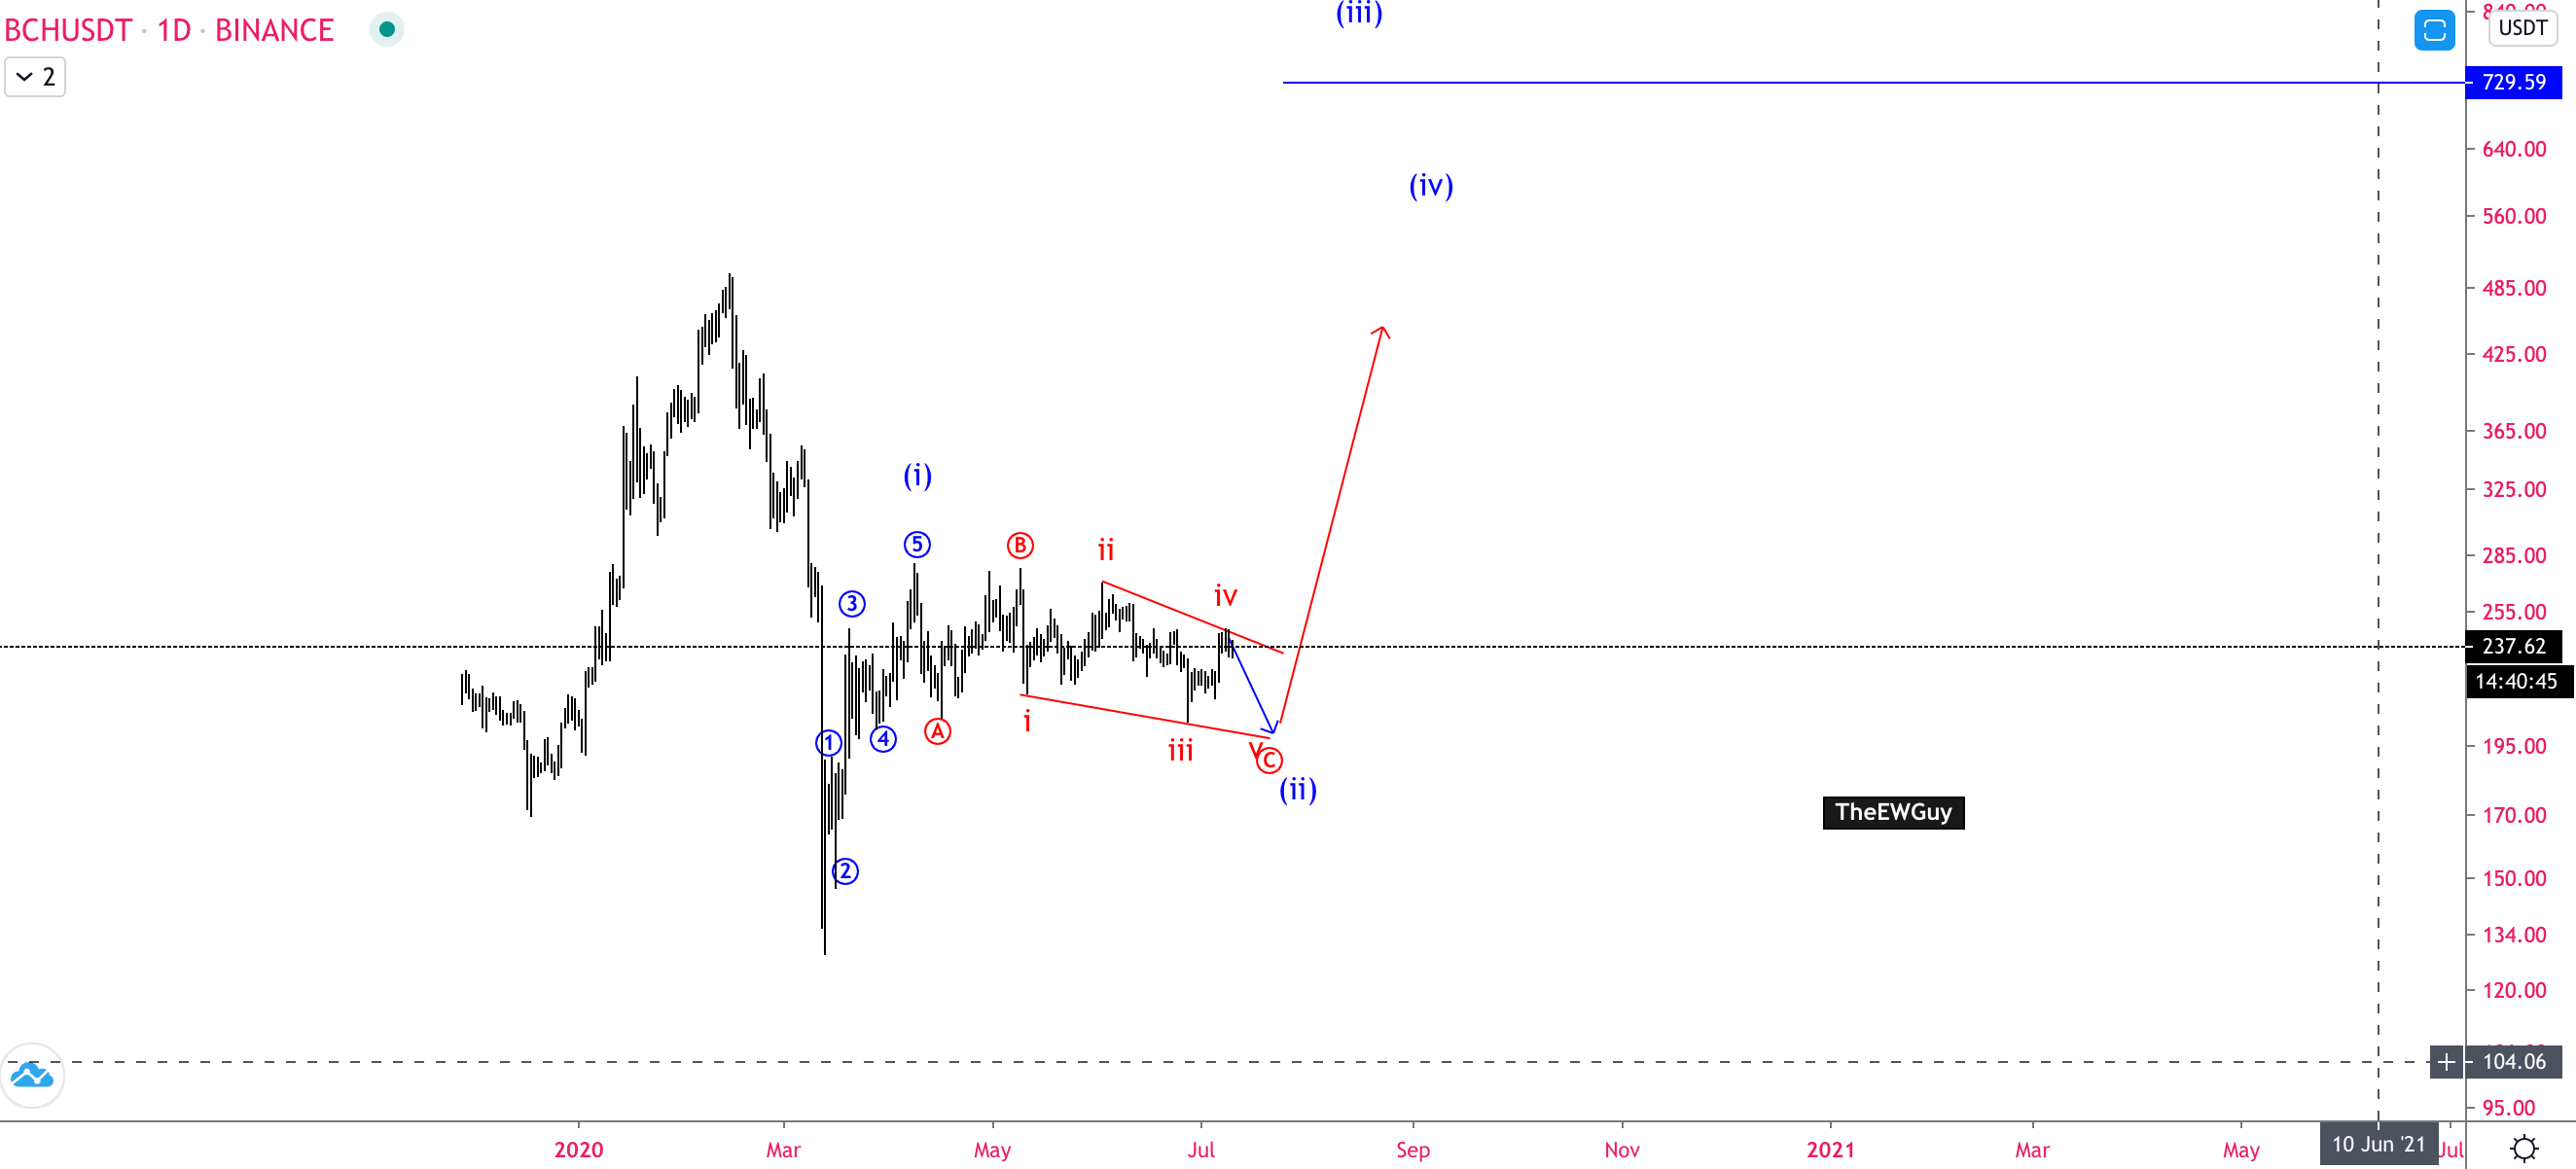
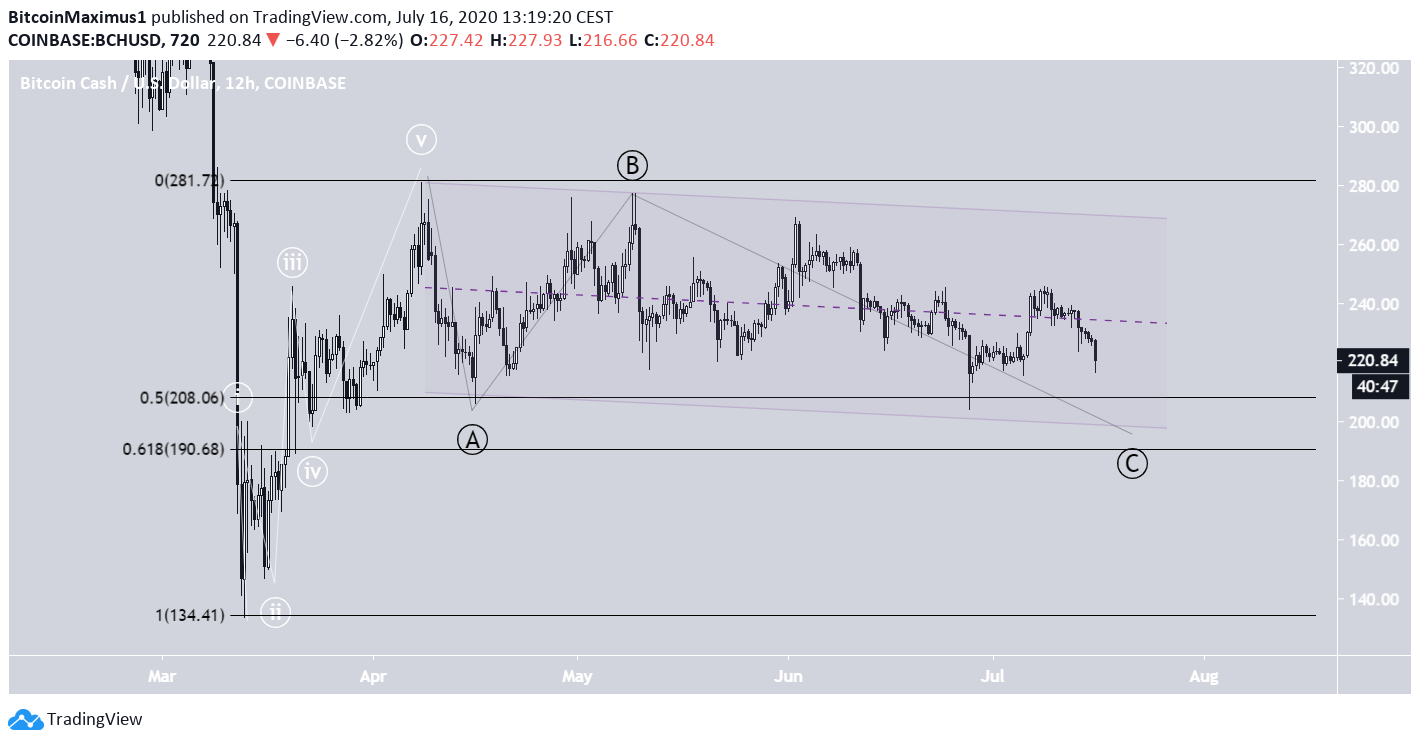
If the wave count is correct, then BCH is in the process of completing the C wave inside an A-B-C correction. Projecting the height of wave A to wave C gives us a target of $200, which is in line with our support area from the previous section.
Furthermore, it coincides with the support line of a parallel channel connecting the beginning of wave A and the top of wave B.
The most likely reversal area would be between the 0.5 – 0.618 Fib levels at $190 and $208. If the price declines below the lower bound, then the wave count could be wrong and BCH may make another lower low.
BCH/BTC
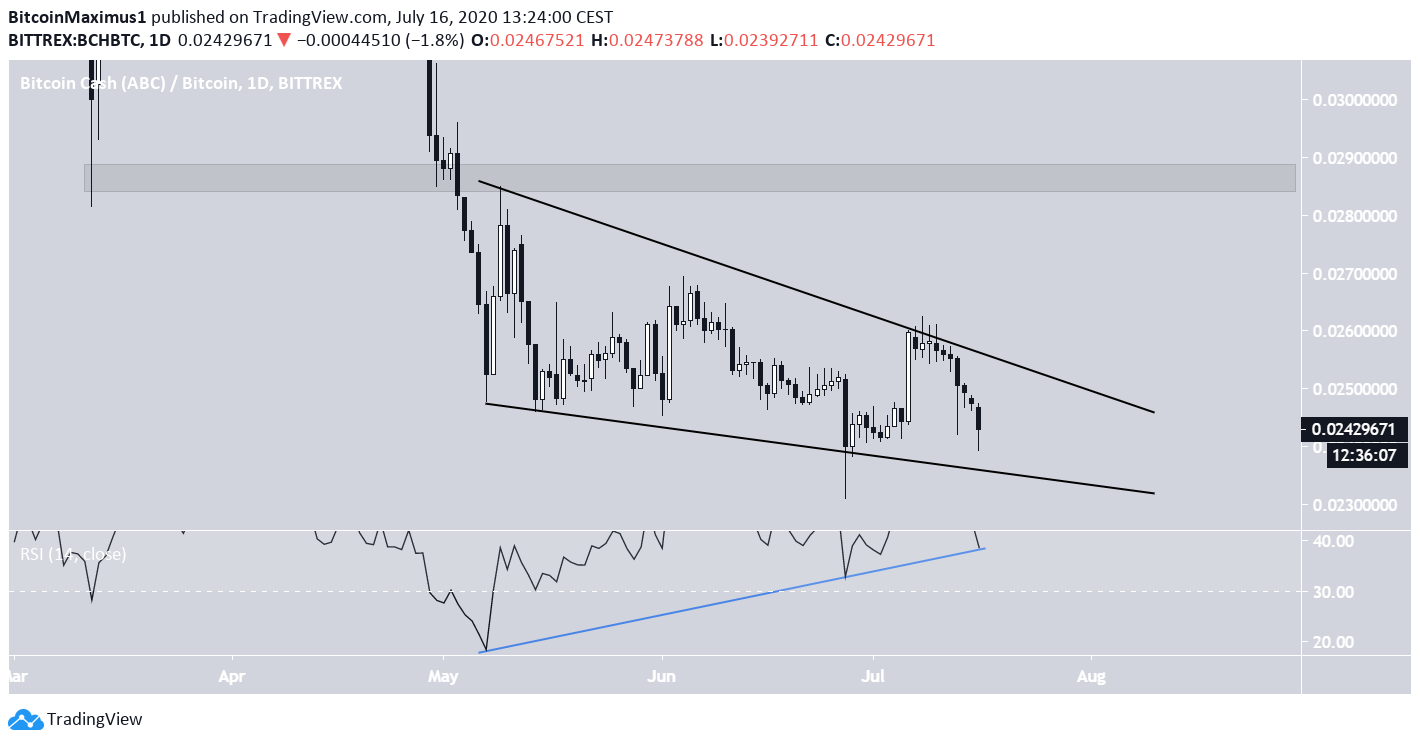
The chart for BCH/BTC is much more straightforward. The price has been trading inside a long-term descending wedge since it broke down from the ฿0.0287 support area on May 2.
The descending wedge is a bullish reversal pattern, and the possibility of a breakout is also strengthened by the growing bullish divergence on the daily RSI.
Therefore, an eventual breakout from this pattern is likely, with the price revisiting the ฿0.0287 area once more. A breakout above this level would indicate that the long-term trend is bullish.