


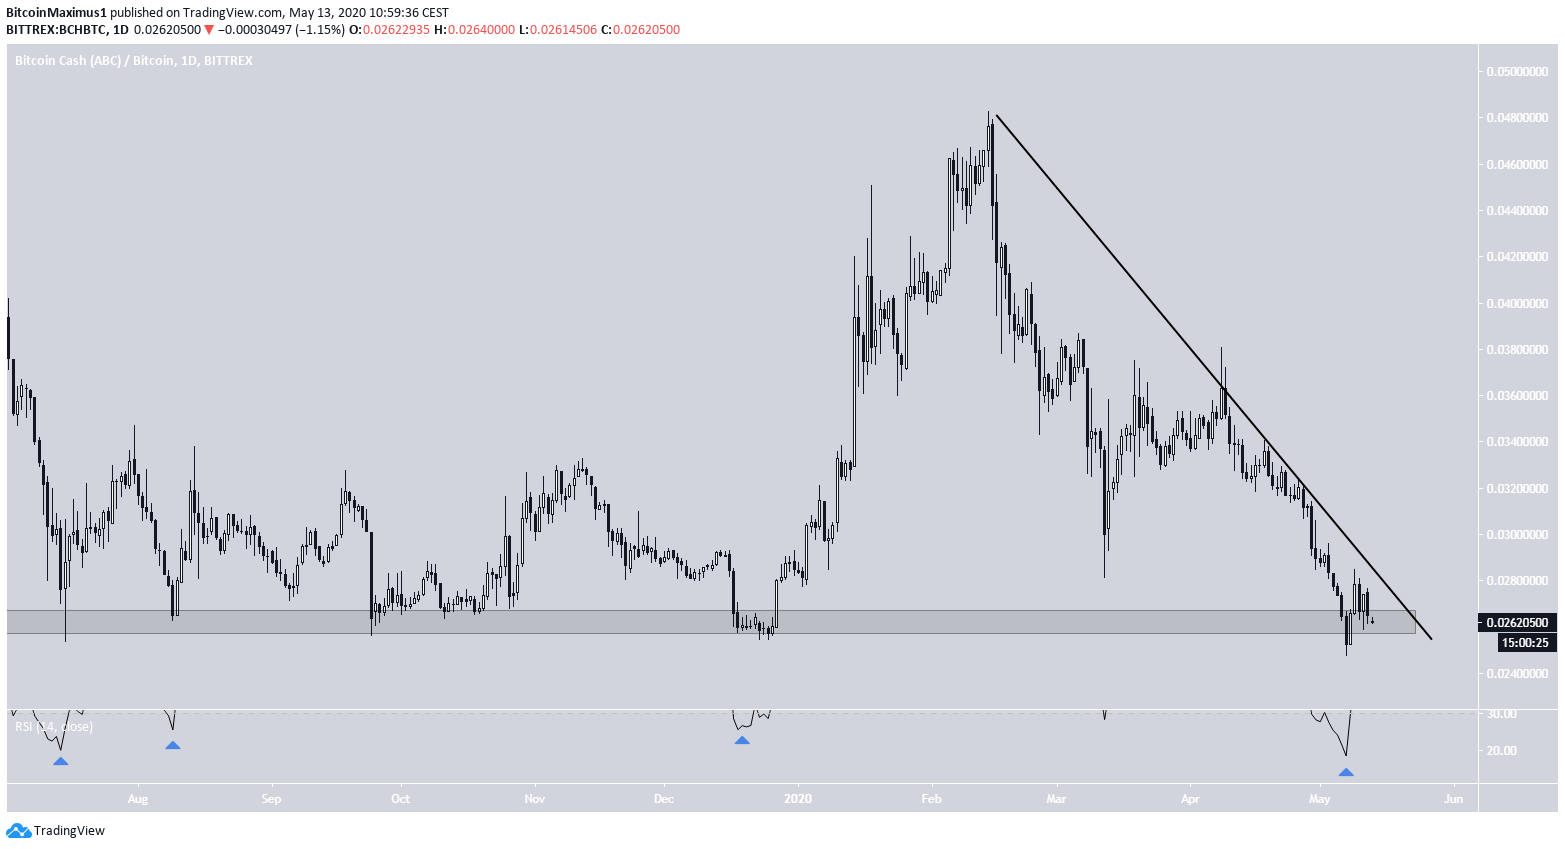
On Feb 15, the BCH price reached a high of ₿0.0483. Since then, the price has been moving downward at an accelerated pace, having already decreased by 45%.
The price made an attempt to initiate an upward move in the beginning of March, but was swiftly rejected and continued its downward movement.
However, the price has reached a significant support level that could reverse this bearish trend. Bitcoin and altcoin trader @BillGK_Crypto tweeted a BCH chart that shows that the price has fallen all the way down to this long-term support level.
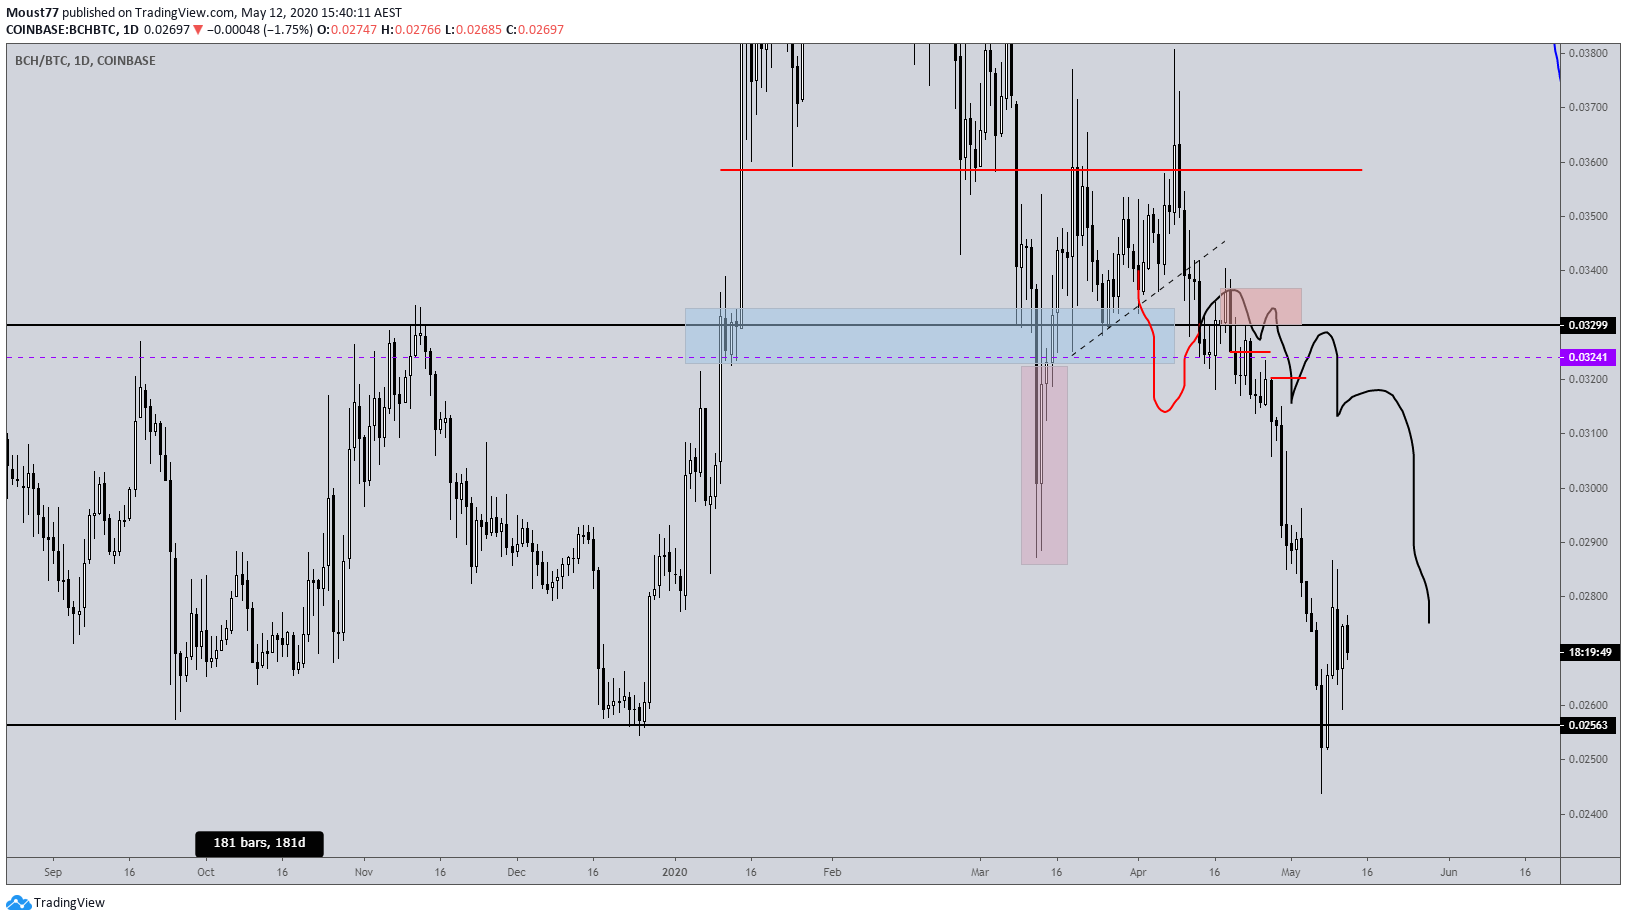
BillGK stated that that after making profits on the decrease, he is expecting to possibly initiate a long position towards recent highs.
Final Target hit at range low for +6.35R Overall locked in +4.9R with TP along the way Thread worked out to be a great collection from start to finish of creating & sticking to plan Recently also ran the range low, now looking to potentially take it the other way!
Bitcoin Cash Long-Term Support
The BCH price is trading inside a very strong support level found at ₿0.026. The price has not traded below this level since July 2019, so a breakout below it could trigger a very rapid price decrease. Furthermore, the price has been following a very steep descending resistance line since it reached a high of ₿0.0483 on February 15. The convergence of this resistance line and the aforementioned support area suggests that the price will soon make a decisive move in one direction.
While the RSI has not generated any bullish divergence, it is extremely oversold, a level which previously served to initiate upward moves. So, it is possible that the price will do the same this time around and break out from the descending resistance line.
Short-Term Perspective
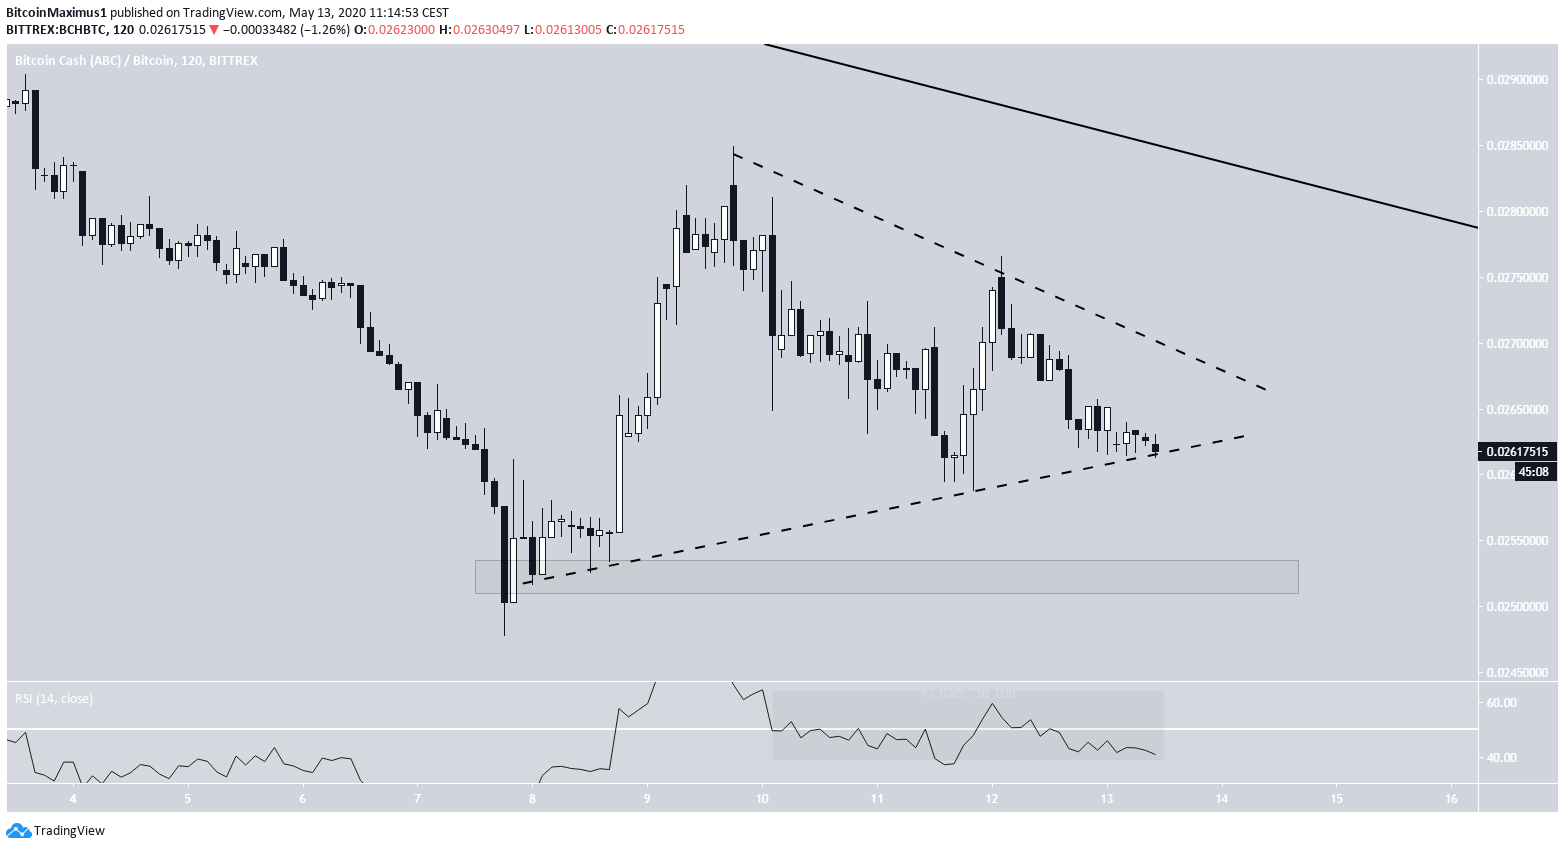
In the short-term the price is trading right at the support line of a symmetrical triangle. While this is known as a neutral pattern, the fact that it is transpiring after an upward move makes a breakout more likely.
If it were to break down instead, the possibility of a double-bottom would be high. Therefore, a bounce towards the descending resistance line is likely, but at the time of writing we cannot confidently predict whether the price will break out.
To conclude, the BCH price has reached a long-term support level. While a bounce at this level is expected, it is still unclear if the price will break out above the resistance line it has been under for the past two months.


