


Bitcoin (BTC) decreased considerably during the week of Sept 6-12, falling to a low of $42,843 before bouncing towards $46,000.
While BTC is still trading above short-term support and showing some bullish signals, the long-term trend is gradually turning bearish.
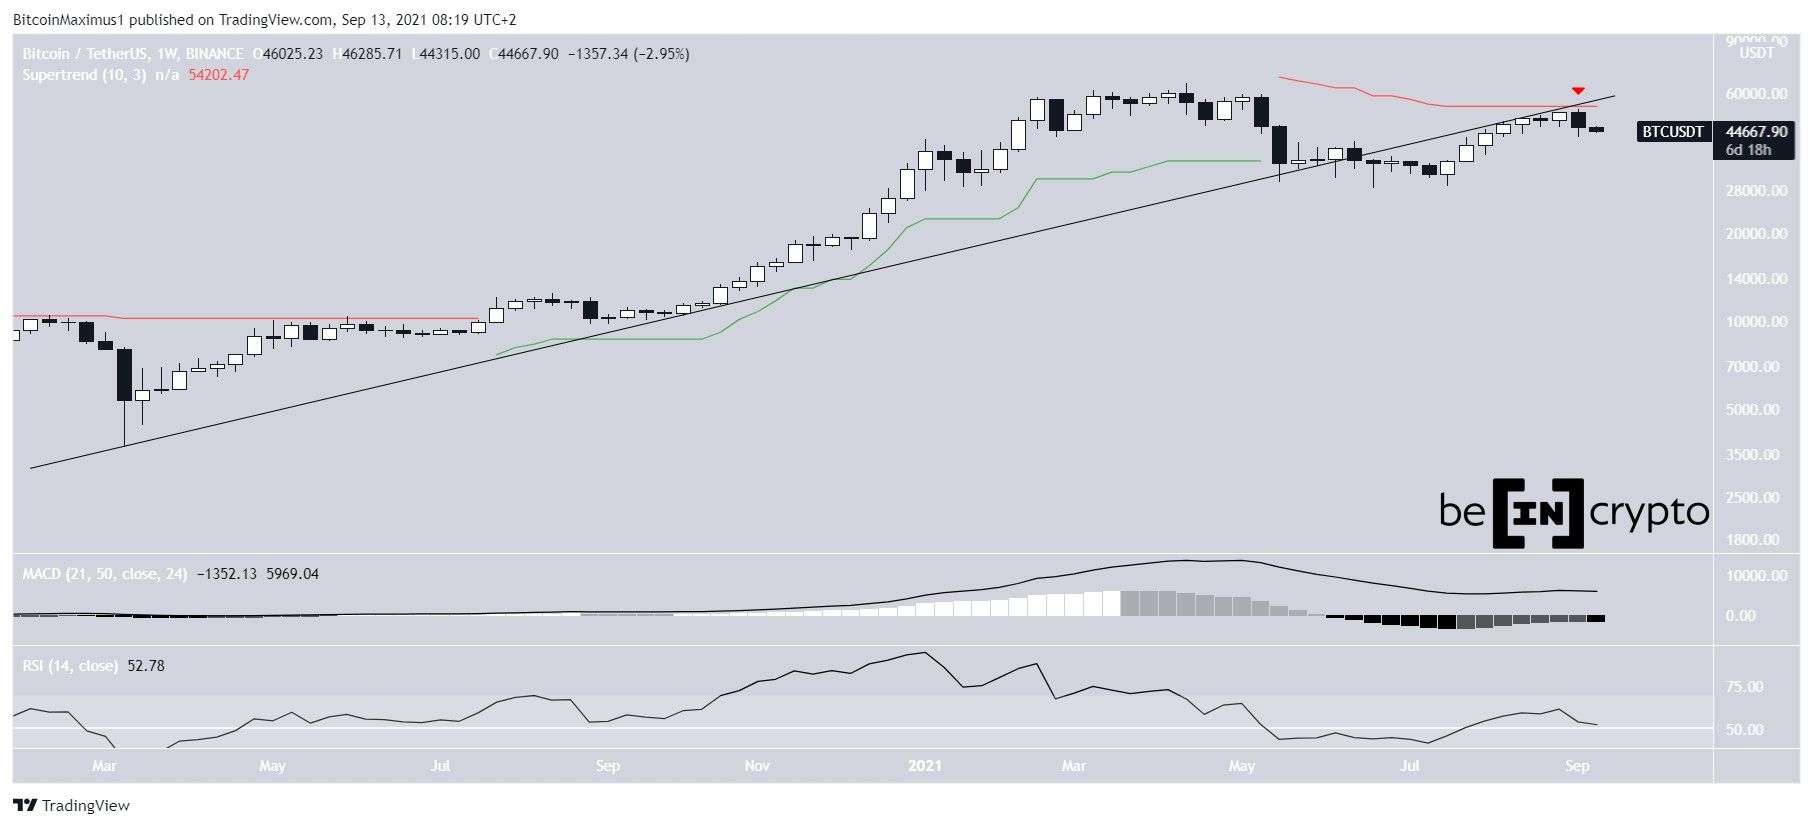
Long-term BTC movement
BTC created a bearish engulfing candlestick last week, with opening and closing prices of $51,756 and $46,025, respectively.
The decrease transpired after a rejection from the ascending support line that it previously broke down from and the Supertrend resistance line (red icon). Therefore, BTC has now validated the line as resistance.
While the RSI is above 50 and the MACD is positive, both are showing signs of weakness and could potentially begin to move lower.
Therefore, the weekly chart is leaning on being bearish.
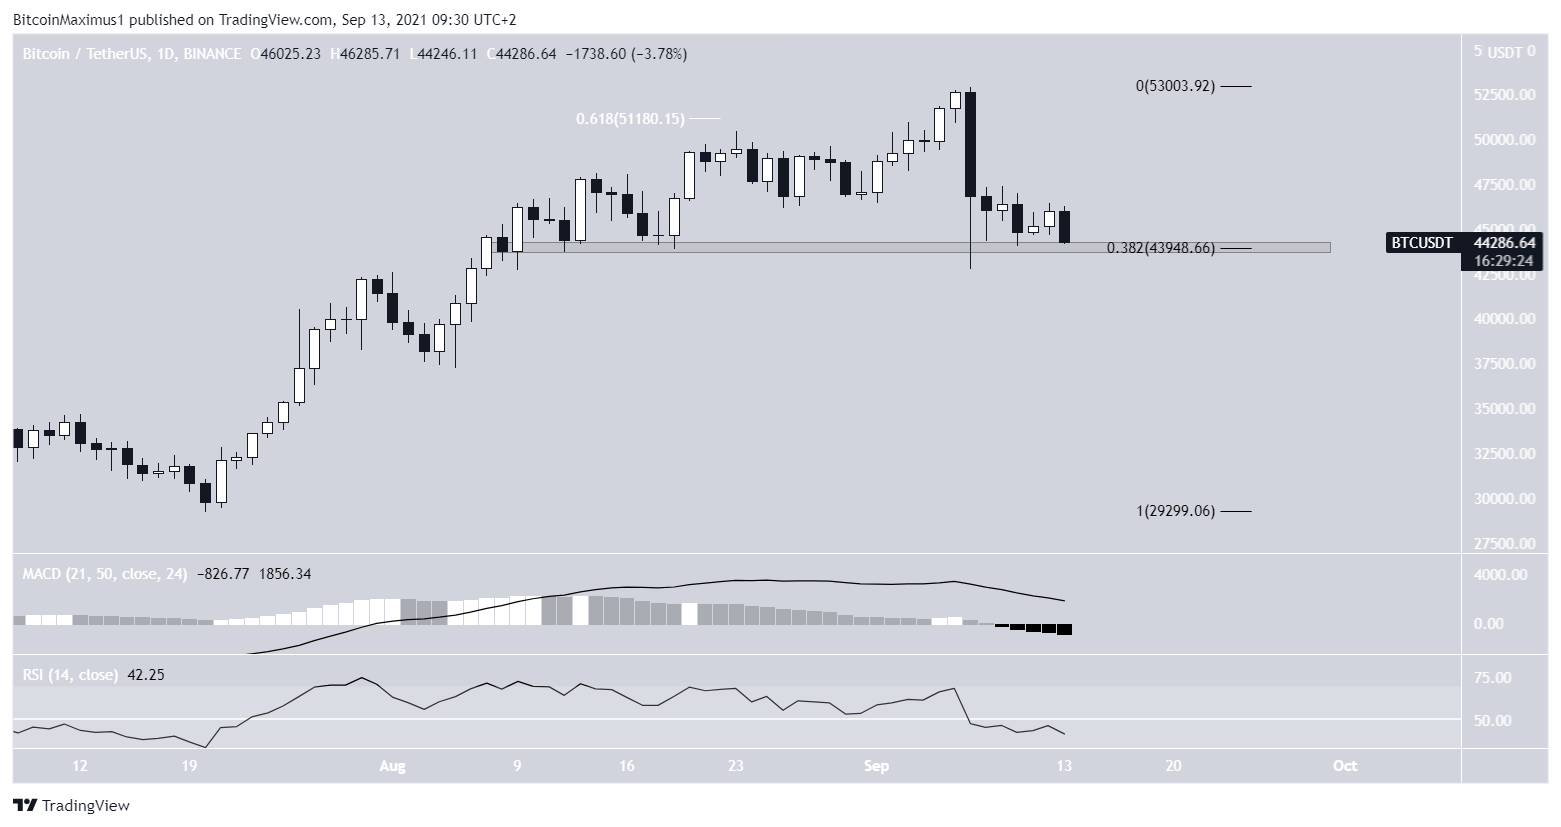
Current support
The daily chart shows that BTC is still hovering above the $43,950 support area. The level is both a horizontal support area and the 0.382 Fib retracement support level.
However, technical indicators are turning bearish. The RSI has fallen below 50 and the MACD is nearly negative.
Therefore, the readings align with those from the daily time frame, which suggests that the trend could be turning bearish.
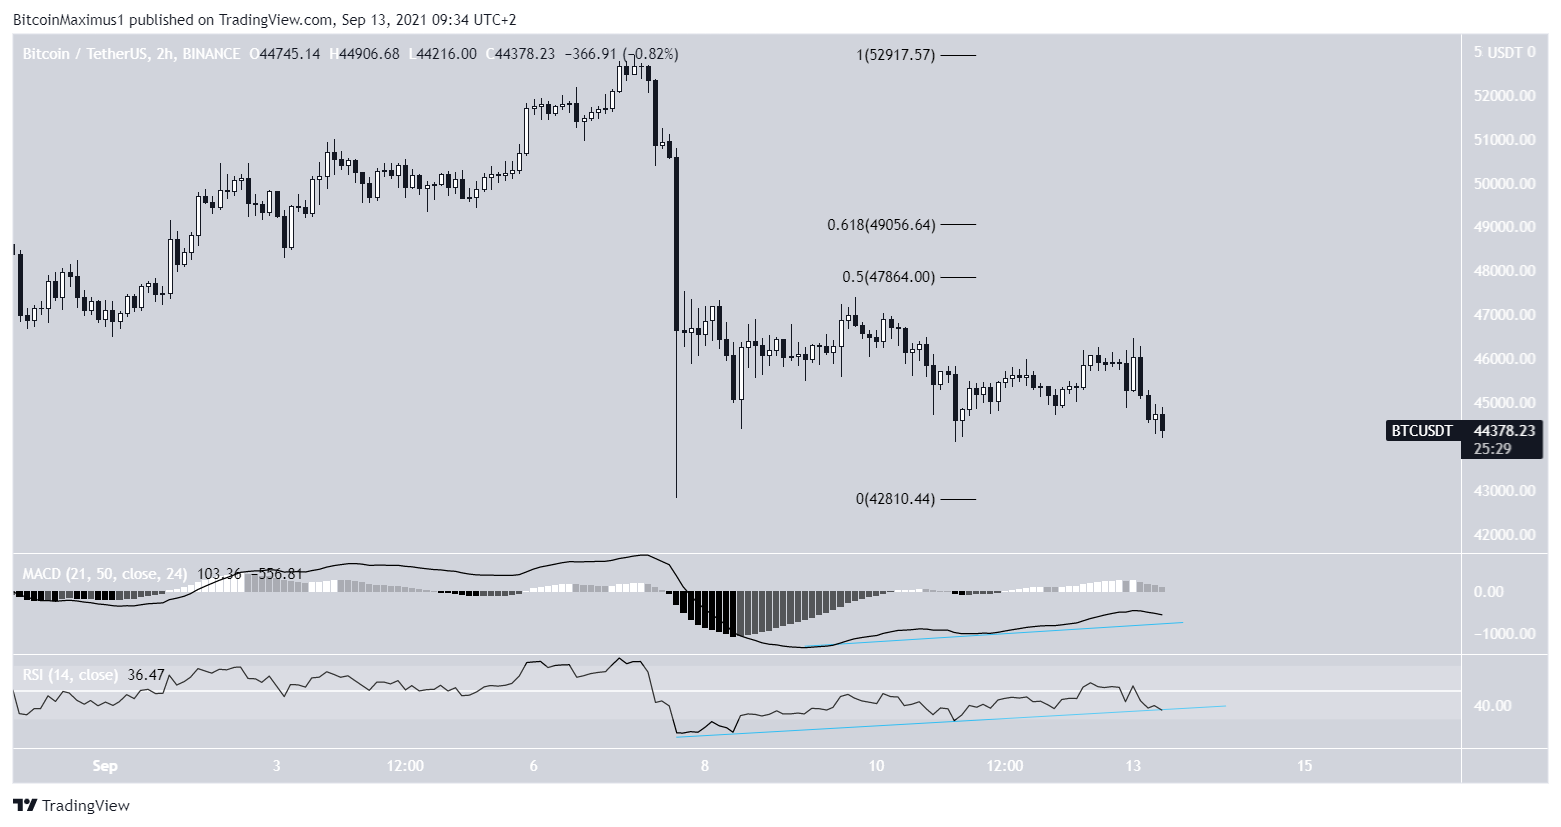
However, the two-hour chart suggests a BTC bounce is likely.
Both the short-term MACD and RSI have generated bullish divergences. In addition to this, their trendlines are still intact.
The closest resistance levels are found at $47,850 and $49,050, the 0.5 and 0.618 Fib retracement resistance levels, respectively.
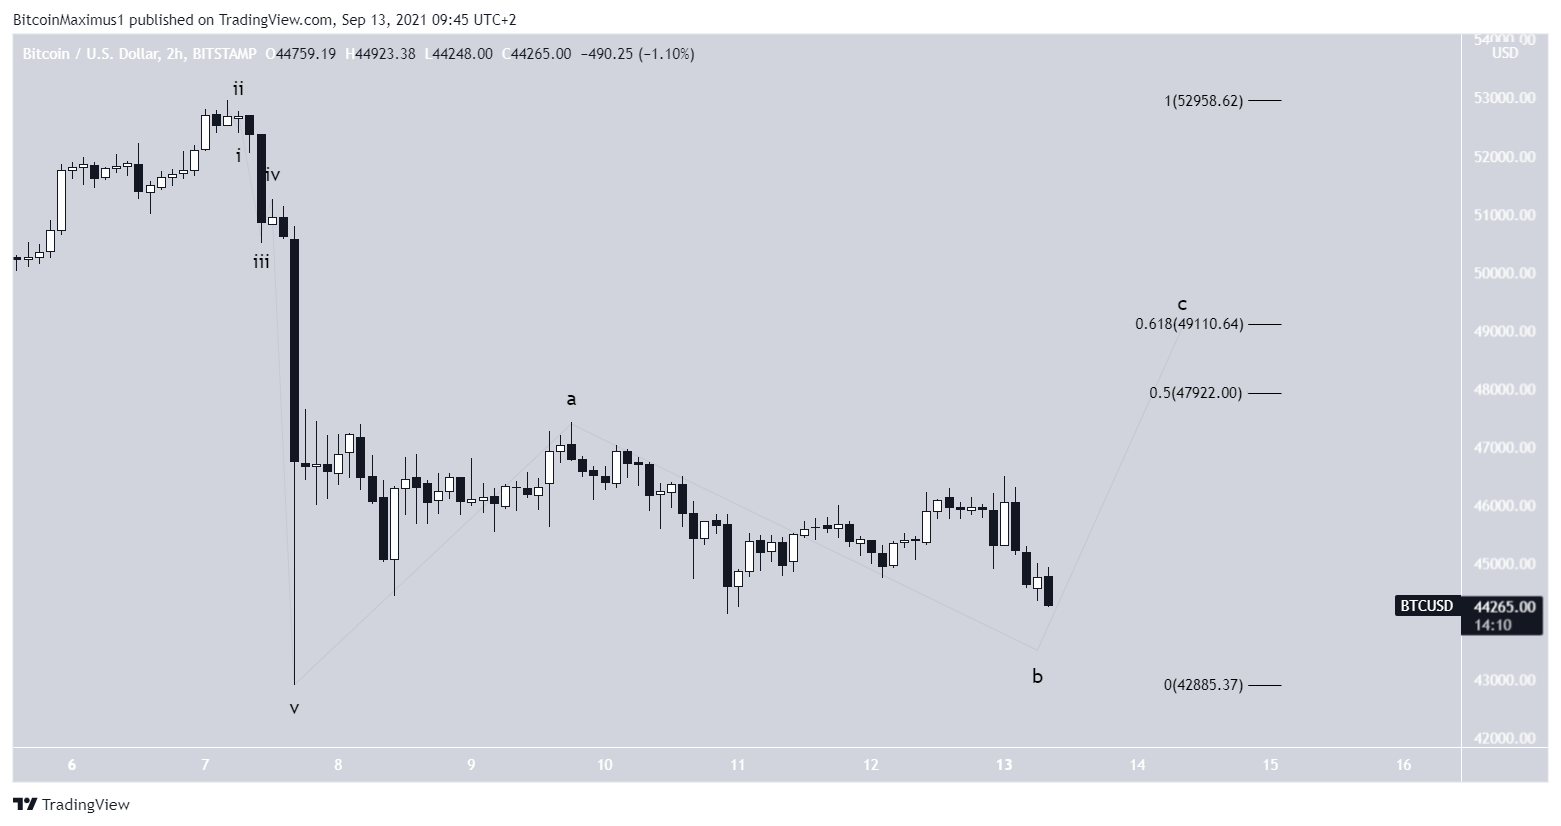
Wave count
The most likely wave count indicates that BTC is in wave B of an A-B-C flat corrective structure.
In this structure, the price will likely decrease towards the $42,855 lows that were reached on Sept 7 before moving upwards toward the previously outlined Fib resistance levels.
For BeInCrypto’s previous Bitcoin (BTC) analysis, click here.


