


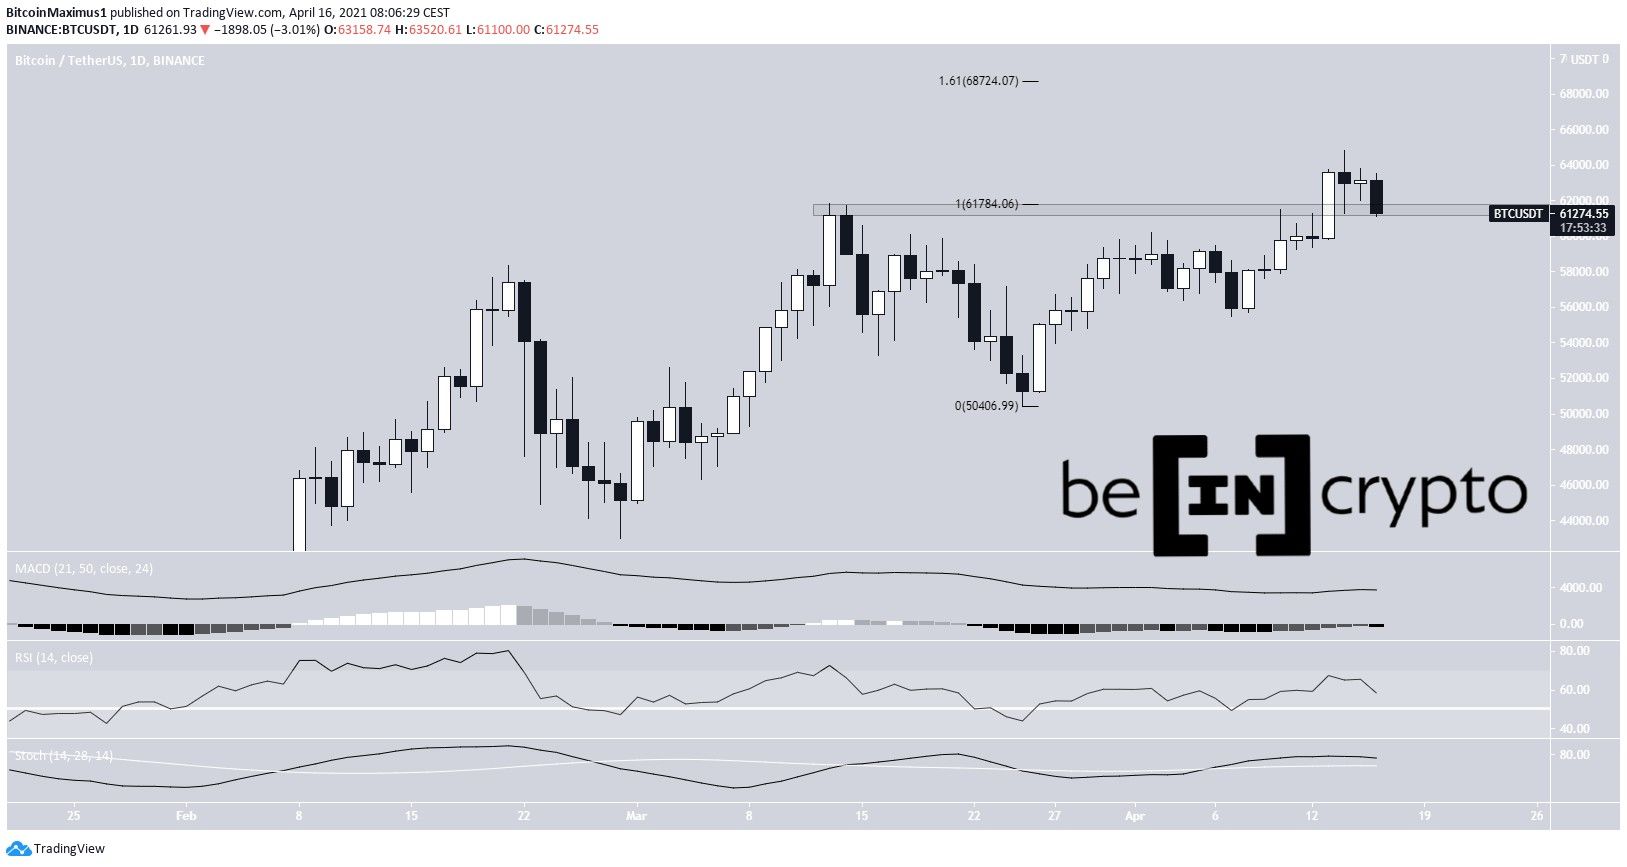
Bitcoin (BTC) has been moving downwards since April 14 when it reached an all-time high price of $64,895.
Bitcoin has now reached the previous breakout level. It’s currently in the process of validating it as support. After this, another upward movement is expected to follow.
Bitcoin returns to support
BTC has been moving downward since April 14 when it reached an all-time high price of $64,895.
Currently, it’s returned to the $61,500 zone that it previously broke out from. It’s in the process of validating the level as support.
Despite the ongoing drop, technical indicators are still bullish.
If BTC bounces, the next resistance area would likely be found at $68,724.
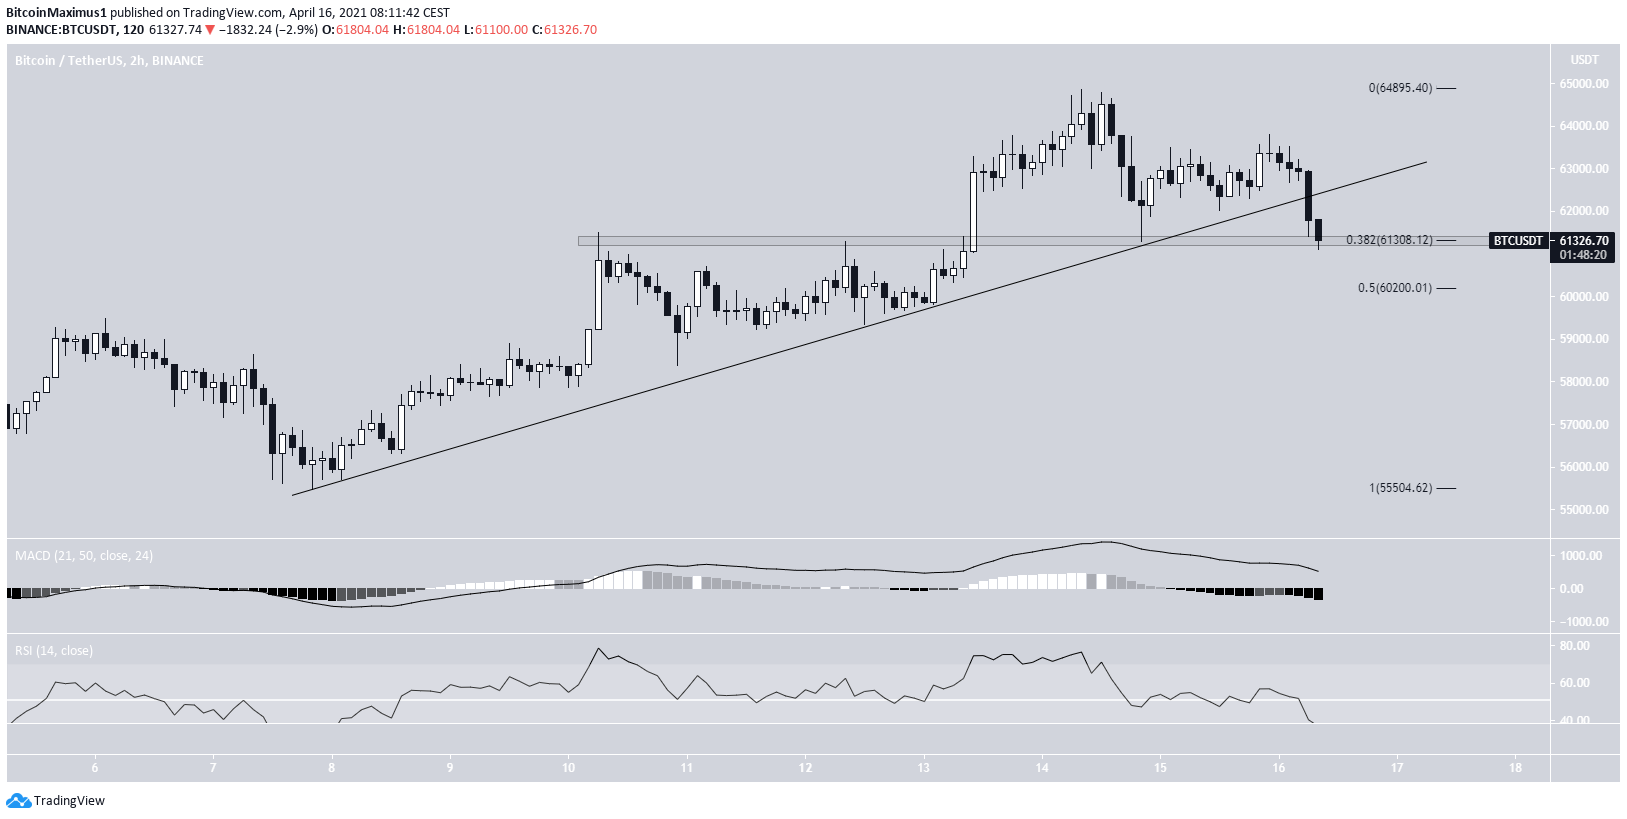
Short-term movement
The two-hour chart shows that Bitcoin has broken down from an ascending support line.
It’s currently trading inside the 0.382 Fib retracement support at $61,300. This is also a horizontal support level.
If BTC breaks down, the next support area would be found at $60,000.
Technical indicators do not yet show any bullish reversal signs.
When combining this with the fact that it has barely dropped since breaking down from the support line, a revisit of the $60,200 area seems likely before continuation.
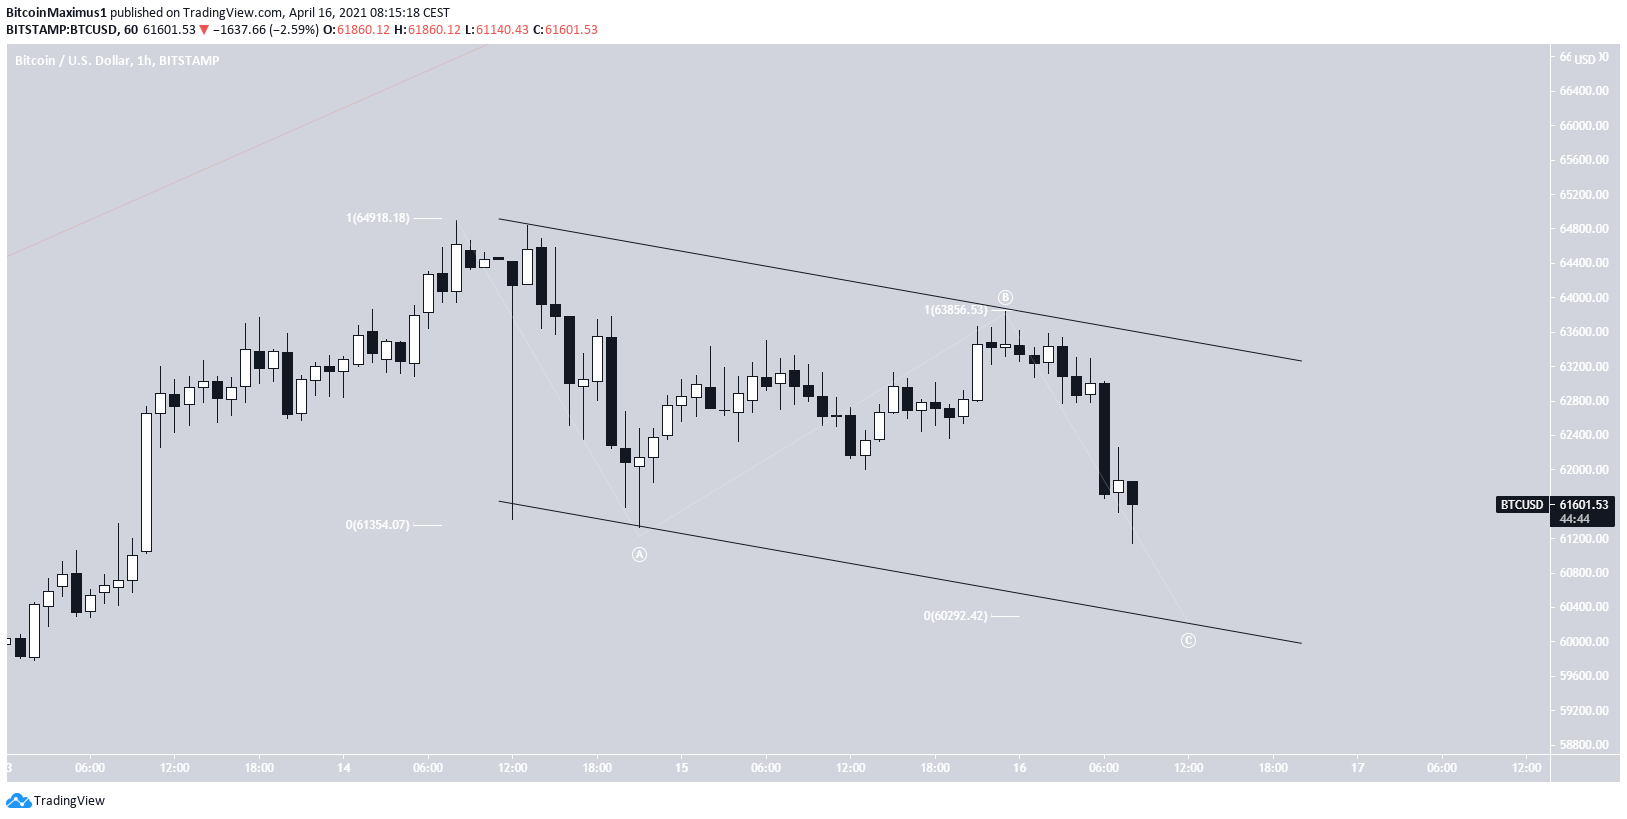
Bitcoin wave count
The wave count agrees with this assessment. It looks like BTC is trading inside a parallel descending channel. This is likely to be a corrective movement.
Furthermore, it’s potentially creating an A-B-C corrective structure. Giving waves A:C a 1:1 ratio provides a target of $60,300, right in line with the previously outlined 0.5 Fib retracement level. Furthermore, this would take the price back to the support line of the channel.
Afterward, a breakout would be expected.
For the longer-term wave count, click here.
Conclusion
BTC is expected to find support at $60,300 at the lowest. Afterward, another upward movement that causes a breakout from the current short-term pattern is expected.
For BeInCrypto’s previous bitcoin (BTC) analysis, click here.


