


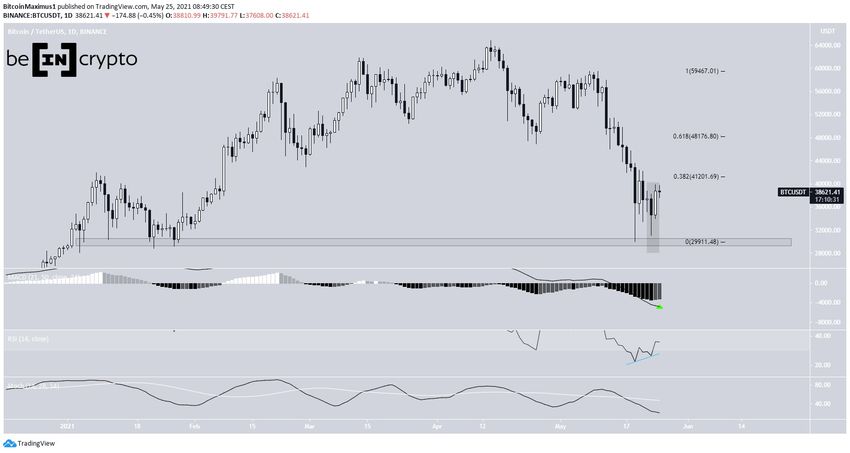
The bitcoin (BTC) price has created a higher low after the May 19 crash and is currently approaching the first significant resistance area found at $41,200.
Bitcoin bounces above support
After reaching a local low of $30,000 on May 19, BTC bounced considerably. It created a higher low on May 23 and followed it up with a bullish engulfing candlestick the next day.
So far, it has reached a high of $39,791. This is very close to the 0.382 Fib retracement resistance found at $41,201. The next resistance would likely be found at $48,170.
Technical indicators are showing bullish signs. While the Stochastic oscillator is still bearish, the RSI has generated a bullish divergence and crossed above 30.
In addition, the MACD has created the first higher momentum bar, potentially signaling a bullish reversal.
Short-Term Movement
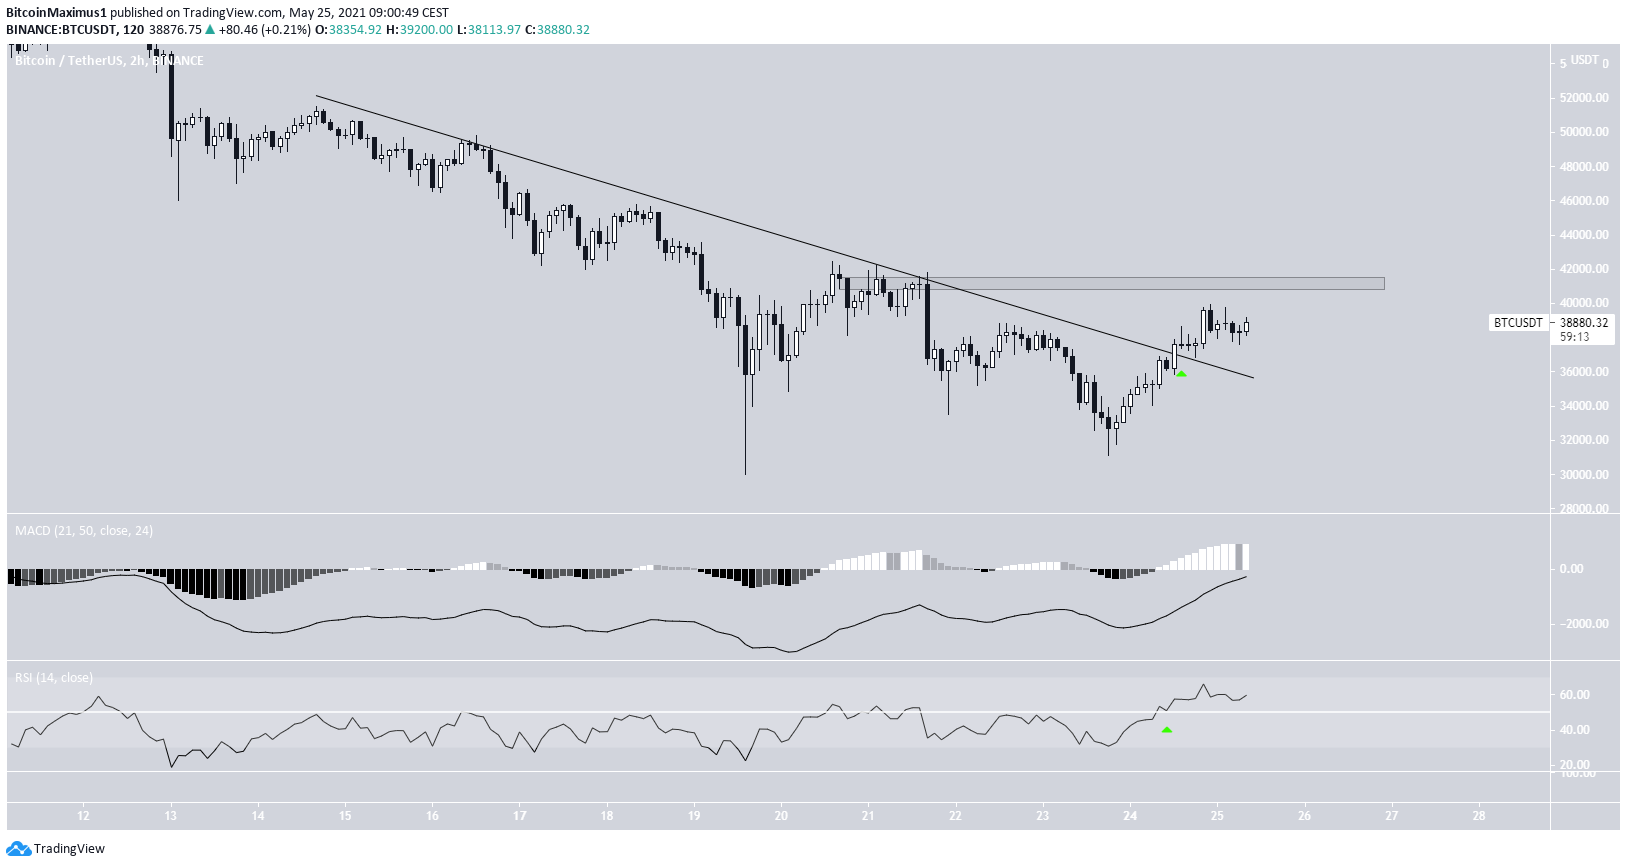
The two-hour chart is a bit more bullish.
Firstly, it shows a descending resistance line from which BTC has broken out. Secondly, the MACD is positive and the RSI has crossed above 50 (green icon). Both of these are bullish signs.
On the other hand, the $41,200 area looks to be a horizontal resistance level as well as a Fib resistance.
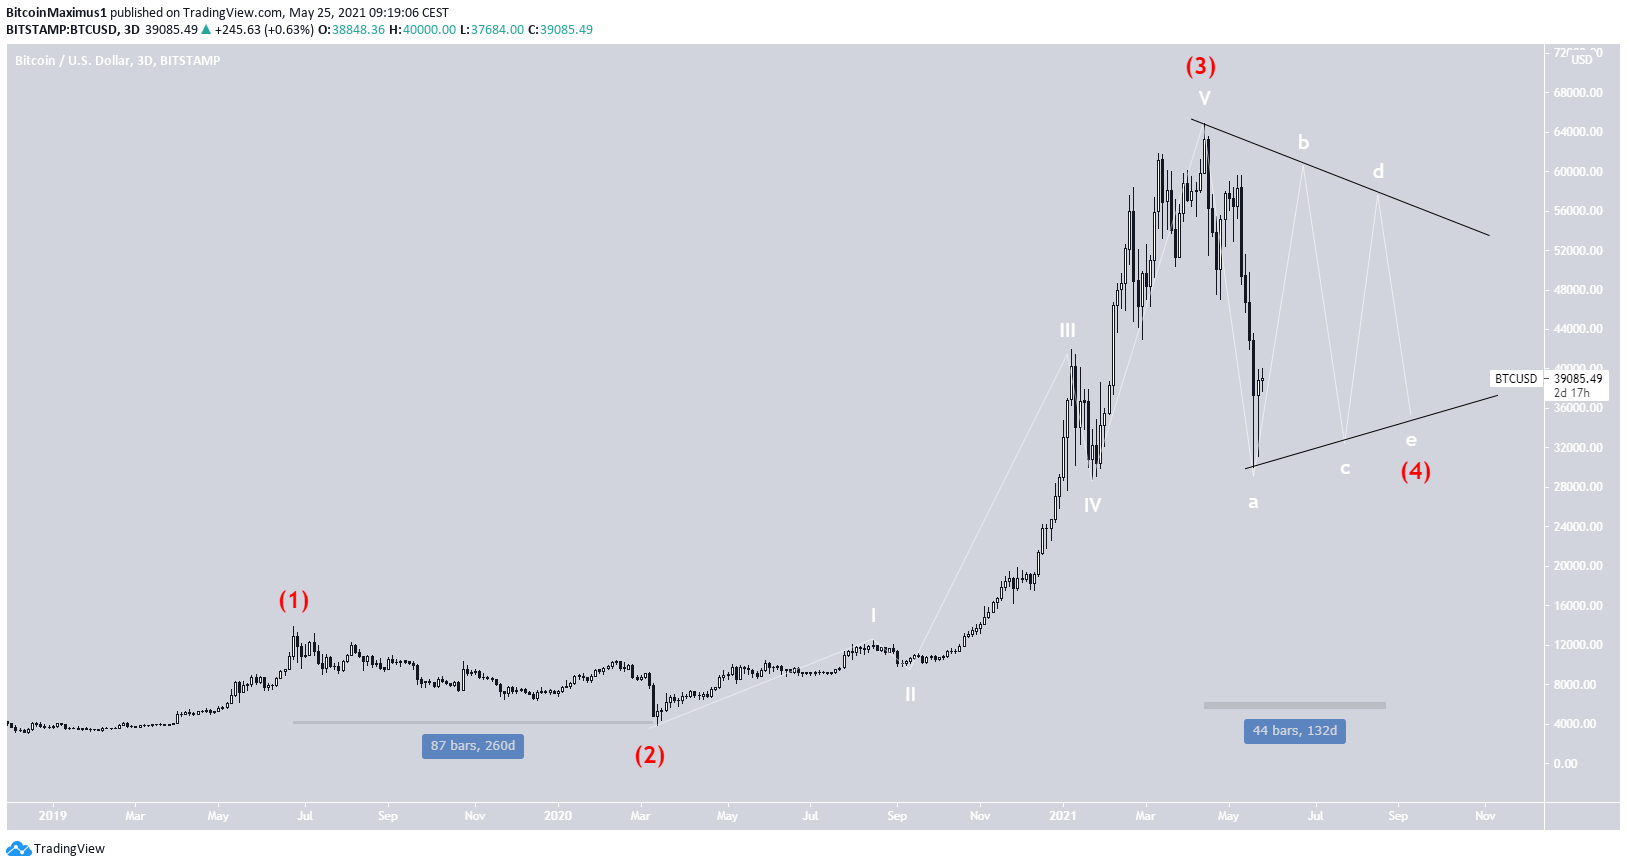
BTC Wave Count
The wave count indicates that BTC has completed cycle wave three (red) and is now in cycle wave four. This means that the portion of the upward movement that began in March 2020 has now ended.
The most likely corrective structure would be a symmetrical triangle.
The sub-wave count is shown in white.
Considering that the length of the cycle wave two correction was 260 days, we would expect a corrective period of at least half that, which would mean a correction that lasts until the end of August.
Conclusion
Bitcoin is expected to resume its upward movement. A short-term rejection could occur once $41,200 is reached.
For BeInCrypto’s previous bitcoin (BTC) analysis, click here.


