


Bitcoin (BTC) has broken out from a short-term bearish pattern and validated it as support after, suggesting that the ongoing correction is complete.
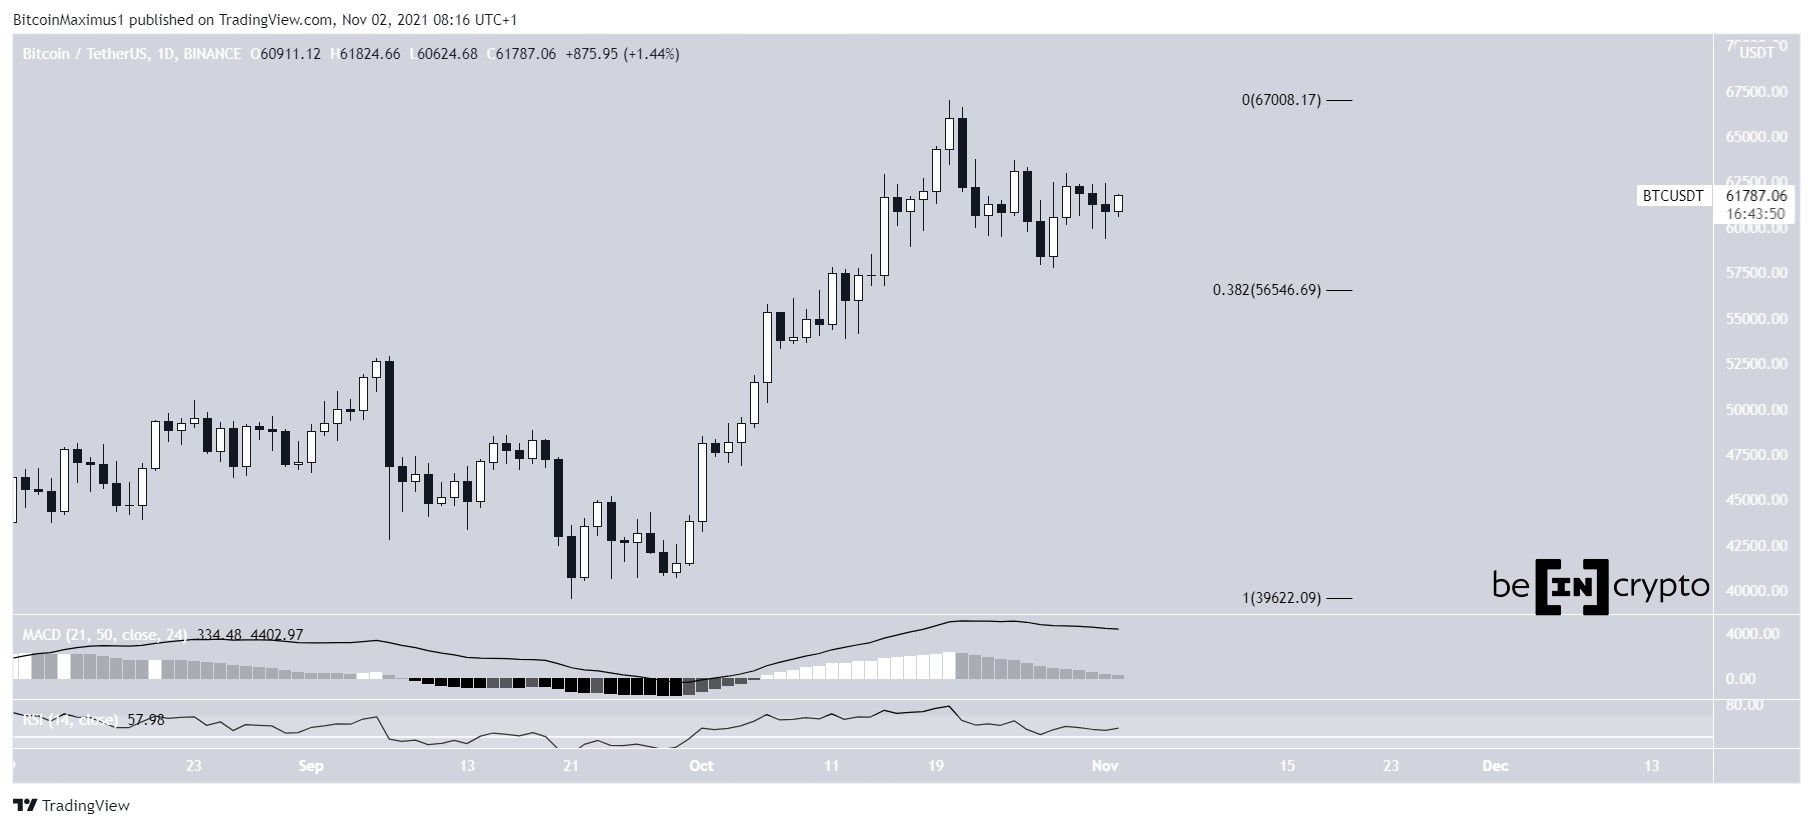
BTC has been decreasing since Oct 20, when it reached an all-time high price of $67,000. Since then, it has reached a local low of $57,820 on Oct 28.
BTC bounced at the 0.382 Fib retracement support level and has been moving upwards since reaching the lows.
Despite the ongoing increase, technical indicators are not yet bullish. Both the RSI and MACD are decreasing, which can be seen as a sign of a weakening trend.
The decrease in the MACD is especially worrisome since the indicator has generated 12 successive lower momentum bars. This is a sign that the short-term trend is losing strength relative to the long-term one. A decrease of the histogram into negative territory would be a major bearish sign.
However, BTC has potentially initiated an upward movement that could reverse this bearish trend in the MACD.
Current breakout
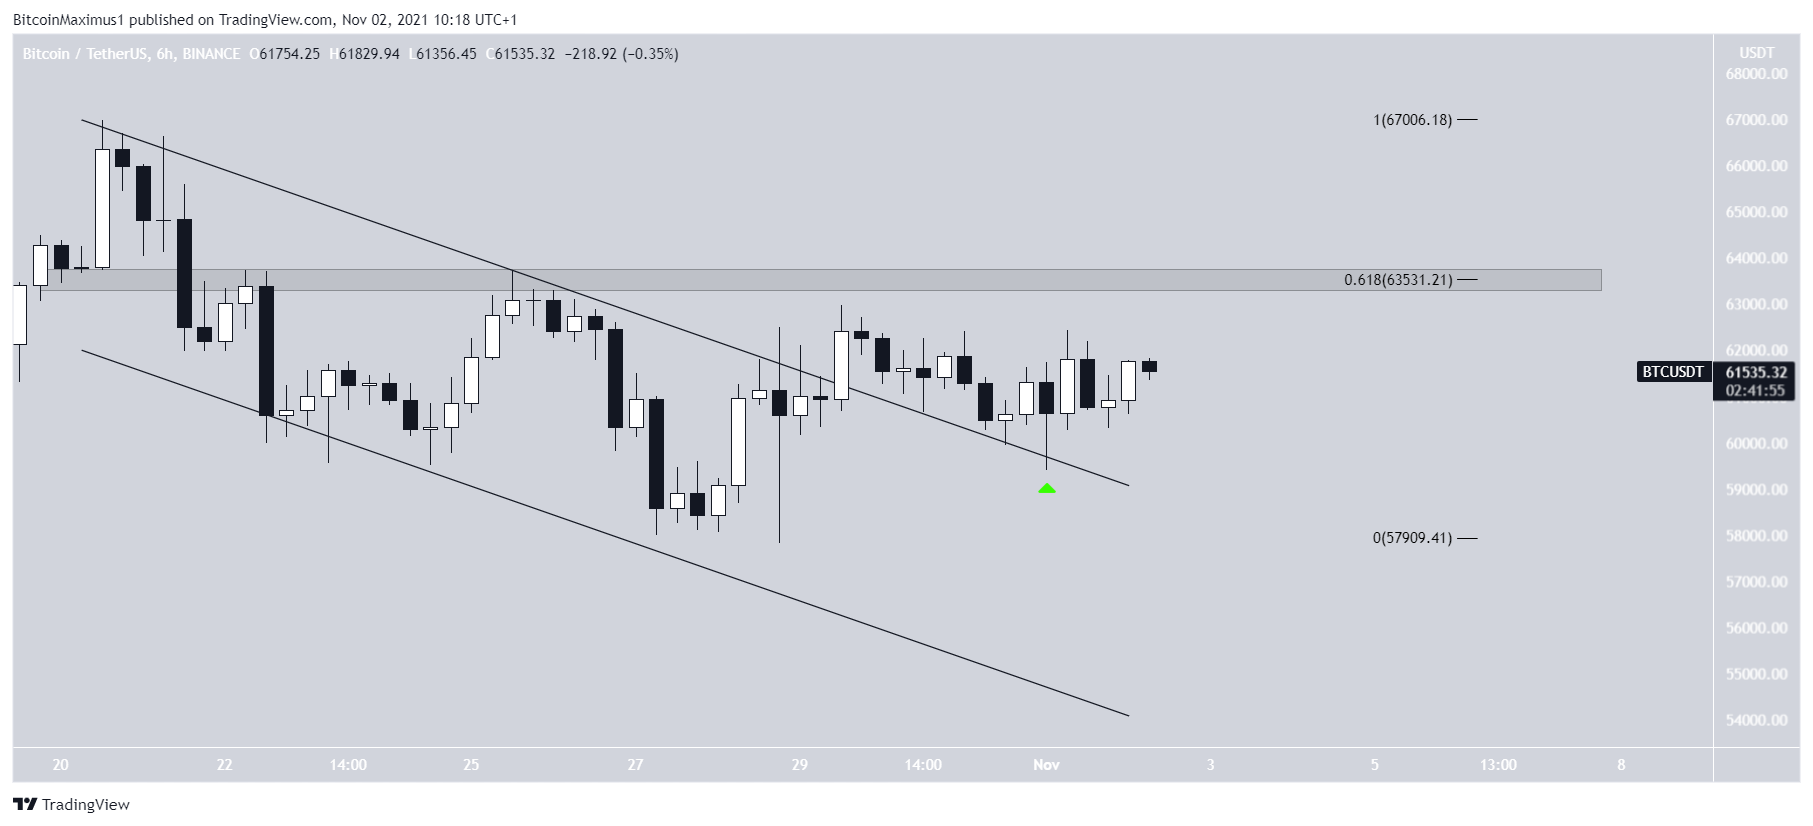
The daily chart shows that BTC has broken out from a descending parallel channel and validated it as support after (green icon).
This is a very bullish sign that indicates the ongoing correction is complete and BTC will likely head higher.
There is resistance at $63,530, created by the 0.618 Fib retracement resistance level. A breakout above it would confirm that the correction has come to an end.
BTC wave count
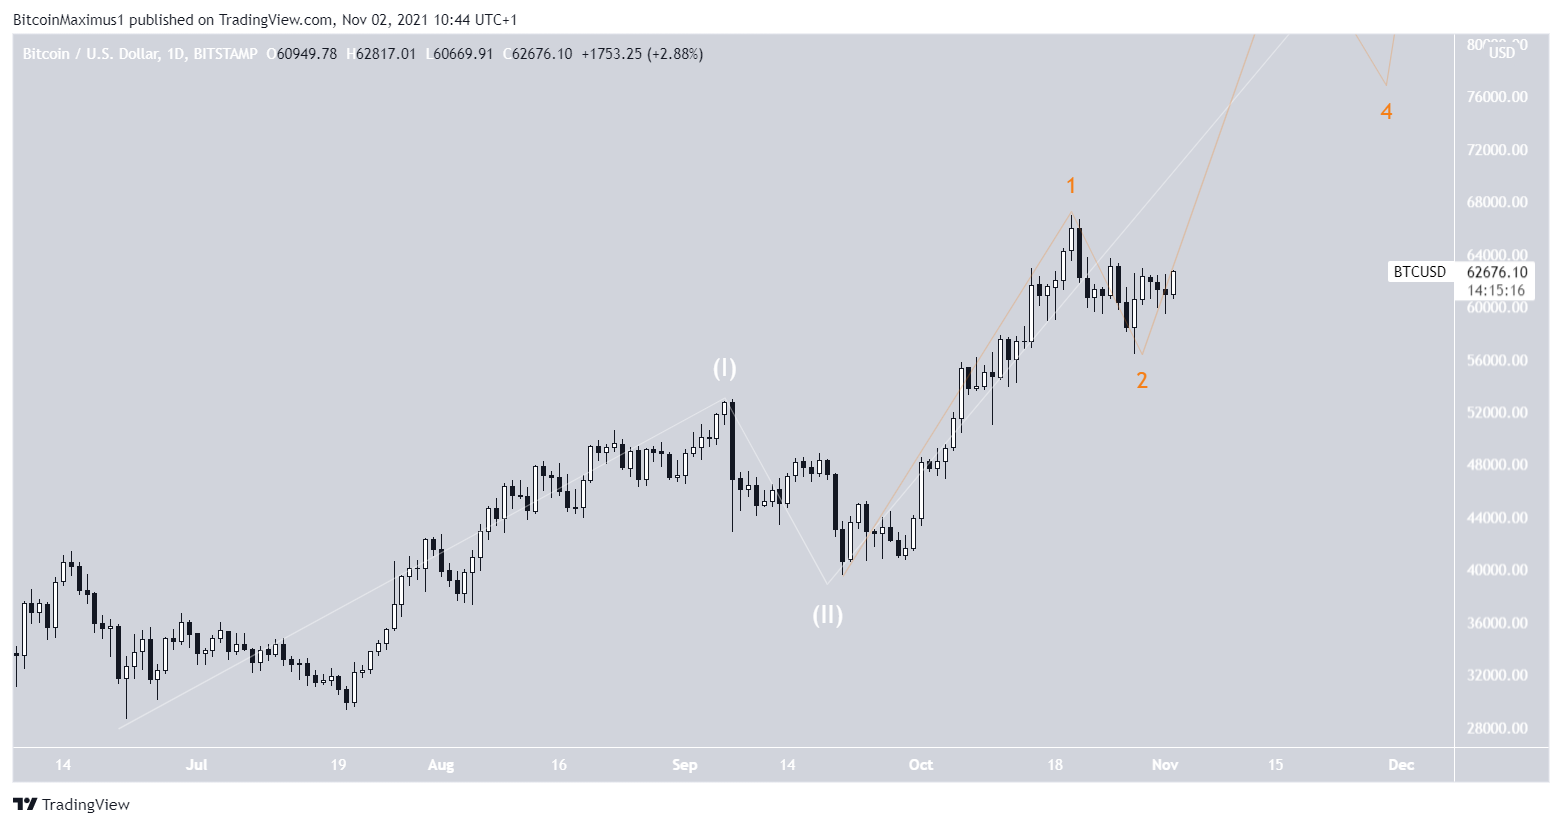
The most likely wave count suggests that BTC is in a large 1-2/1-2 wave formation. This means that it’s currently in wave three of a five-wave upward movement, and the increase is expected to accelerate greatly.
However, the issue with this count is that wave two is quite short. Therefore, it’s possible that wave one (orange) has not yet ended.
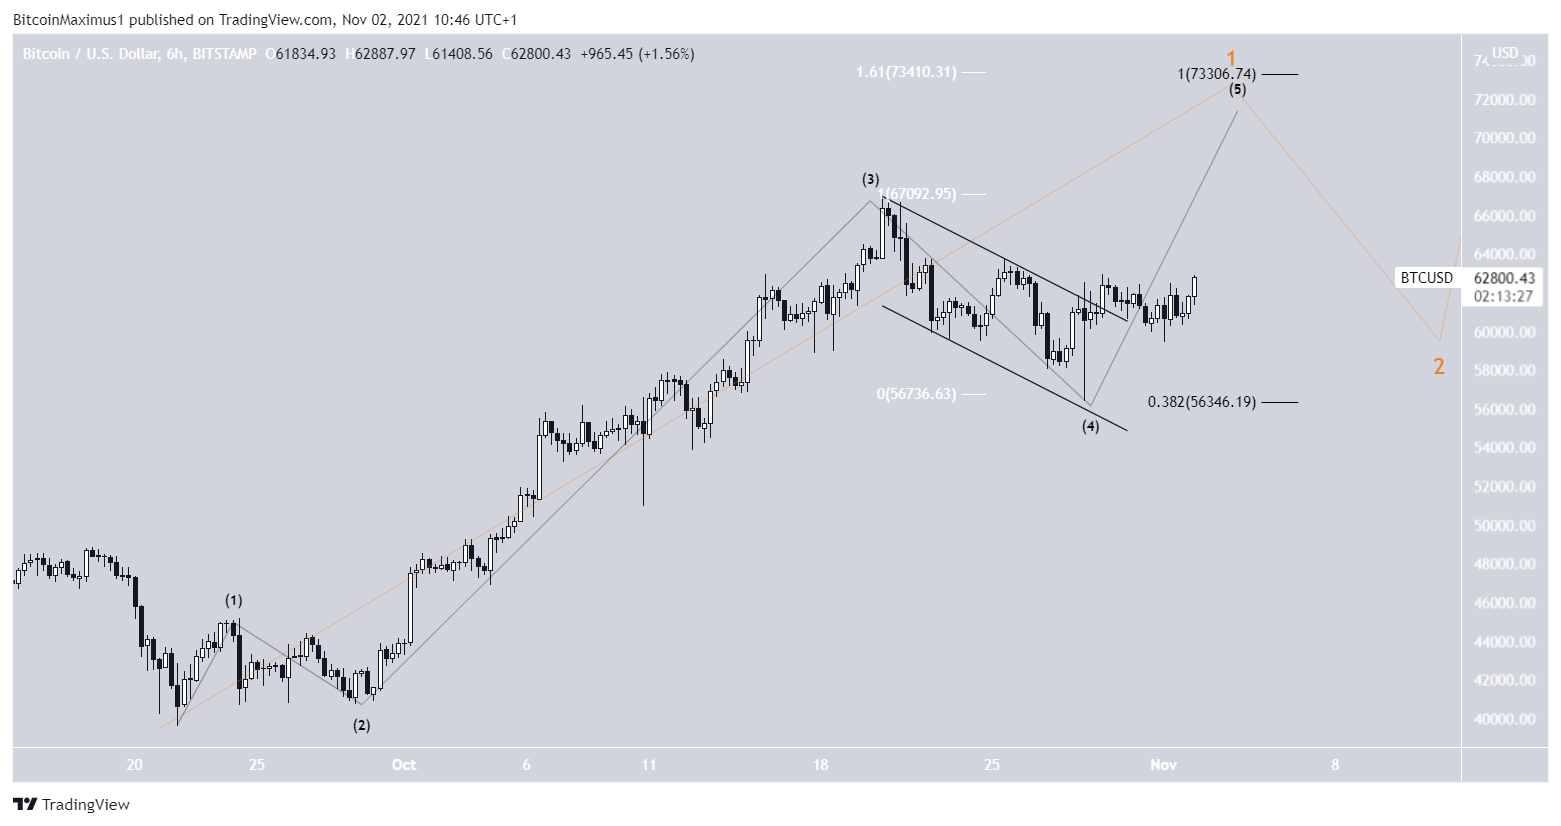
The alternate count would suggest that BTC is in sub-wave five (black) of the same upward move. This would mean that it could reach a high near $73,000 before correcting.
In any case, both counts suggest that BTC will soon reach a new all-time high and have the same long-term outlook. It is only the short-term outlook that differs slightly.
For BeInCrypto’s previous Bitcoin (BTC) analysis, click here.


