


Bitcoin (BTC) is approaching a support line from which it previously broke down. Reclaiming the support would be a very bullish development, but a rejection from it remains the most likely scenario.
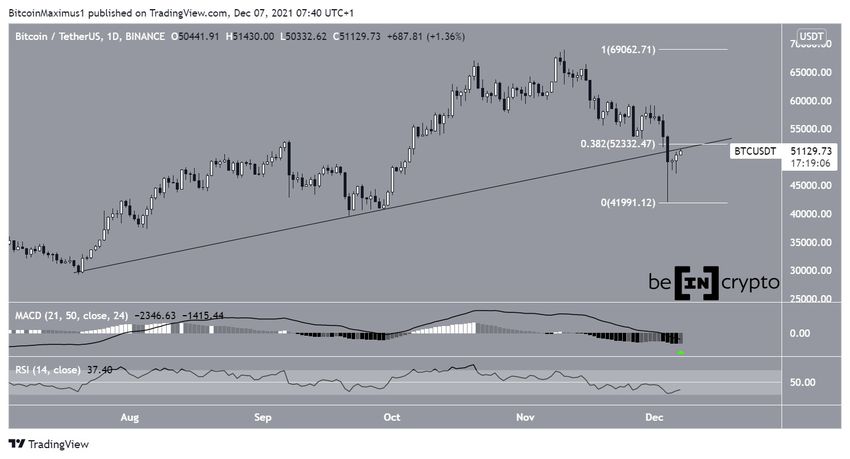
The daily chart shows that bitcoin has been moving upwards since Dec 4, after reaching a local low of $42,000. The same day, it created a very long lower wick, which is considered a sign of buying pressure.
This caused BTC to also break down from an ascending support line that has been in place since July 20. This is a bearish sign that suggests that the upward rally might have come to an end.
In addition to this, technical indicators are bearish.
The MACD, which is created by short and long-term moving averages (MA), is falling and is negative. This is a sign that the short-term MA is slower than the long-term average. While it’s potentially creating a higher momentum bar (green icon), there is still a lot of time left until the daily close.
The RSI, which is a momentum indicator, is below 50, another sign of a bearish trend.
Currently, BTC is back at the ascending support line, but could potentially validate it as resistance. The line also coincides with the 0.382 Fib retracement level at $52,350.
Due to the bearish readings from indicators, a rejection seems more likely than reclaiming the support.
Descending channel
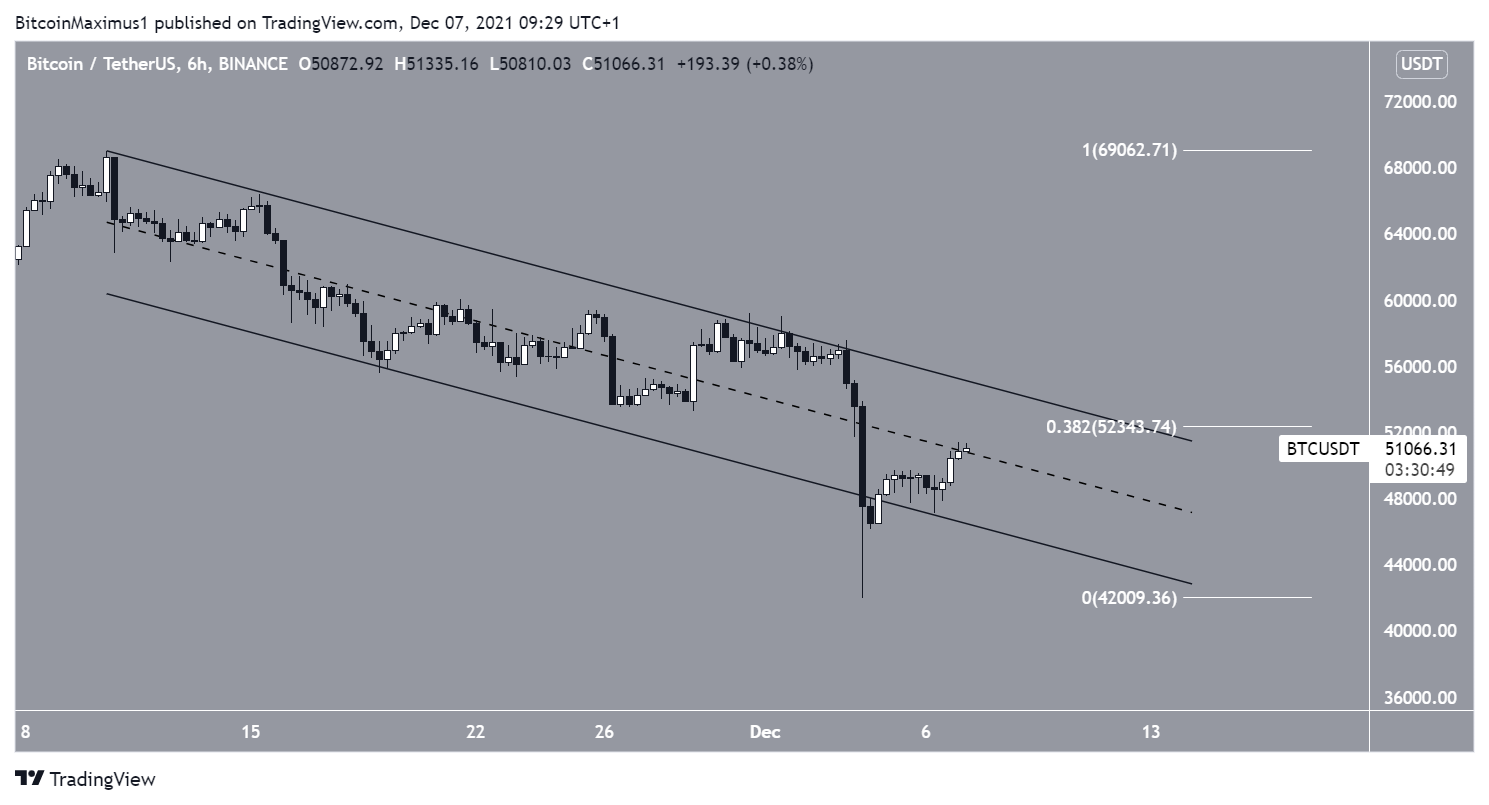
The six-hour chart shows that BTC is potentially trading inside a descending parallel channel. While it initially broke down below it on Dec 4, it has since reclaimed its support line.
Since the majority of the breakdown has taken the shape of a wick, the channel can still be considered valid.
Currently, bitcoin is in the process of reclaiming the midline of the channel.
The resistance line of the channel coincides with the previously outlined $52,350 resistance area. Therefore, a breakout above it would be a major bullish sign.
Bitcoin wave count
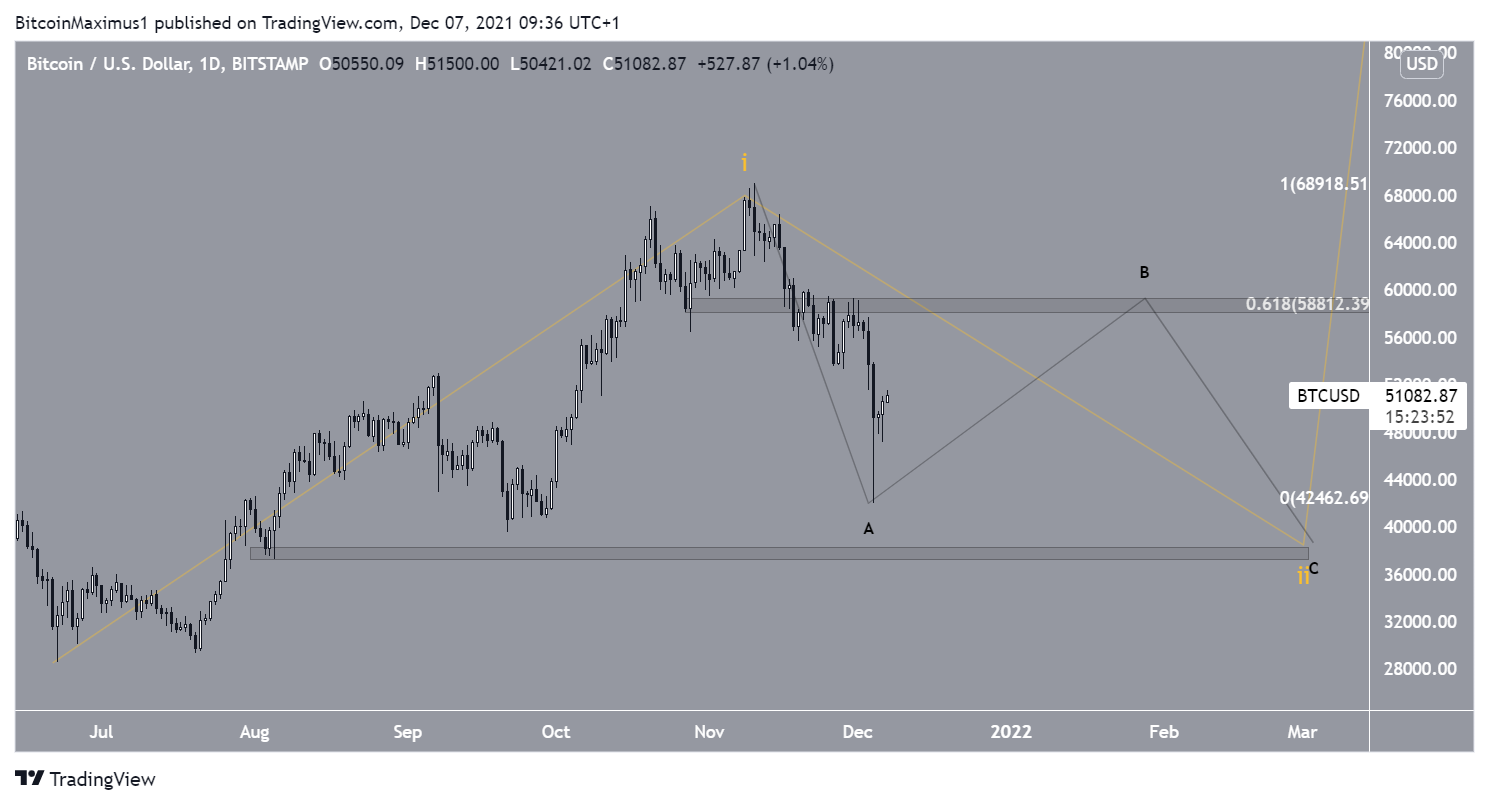
The most likely long-term wave count suggests that BTC is still in a bullish phase.
The short-term count indicates that BTC has completed wave A of an A-B-C corrective structure. This means that it’s currently in wave B, which is moving upwards.
The most likely area in which wave B could come to an end is close to $58,800. This is the 0.618 Fib retracement resistance level and a horizontal resistance area.
However, numerous short-term drops could occur until BTC reaches this level.
For BeInCrypto’s previous Bitcoin (BTC) analysis, click here.


