


Bitcoin (BTC) resumed its ascent on Sept 3 but was rejected prior to reaching the $51,200 horizontal resistance area.
BTC has broken out from the short-term descending resistance line and is making another attempt at reaching this area.
BTC approaches resistance
On Sept 2, BTC made an attempt at moving above the $51,200 resistance area. However, it only managed to reach a high of $50,450 before creating a long upper wick and reversing.
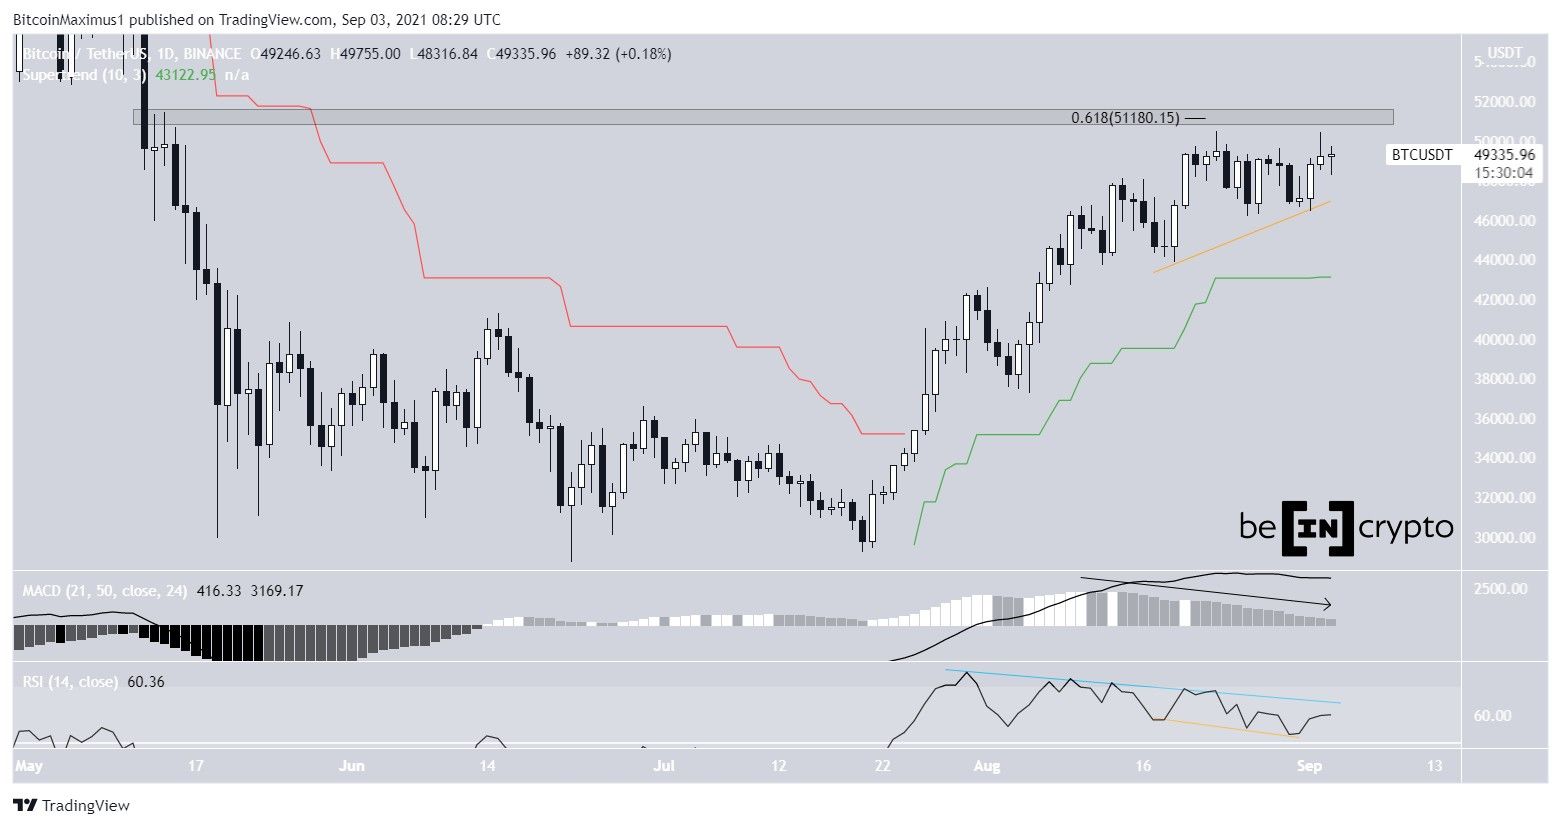
Technical indicators provide a mixed outlook. On the bearish side, the MACD has almost turned negative after generating considerable bearish divergence. Similarly, the RSI has also generated a bearish divergence.
On the bullish side, the RSI is trying to invalidate the bearish divergence by creating a hidden bullish divergence (yellow), and the supertrend is also bullish.
Therefore, there are readings that support both the bullish and bearish possibilities.
However, the price action is still leaning on being bearish, since BTC is trading below the $51,200 area and has created several upper wicks, which are seen as signs of selling pressure.
Future movement
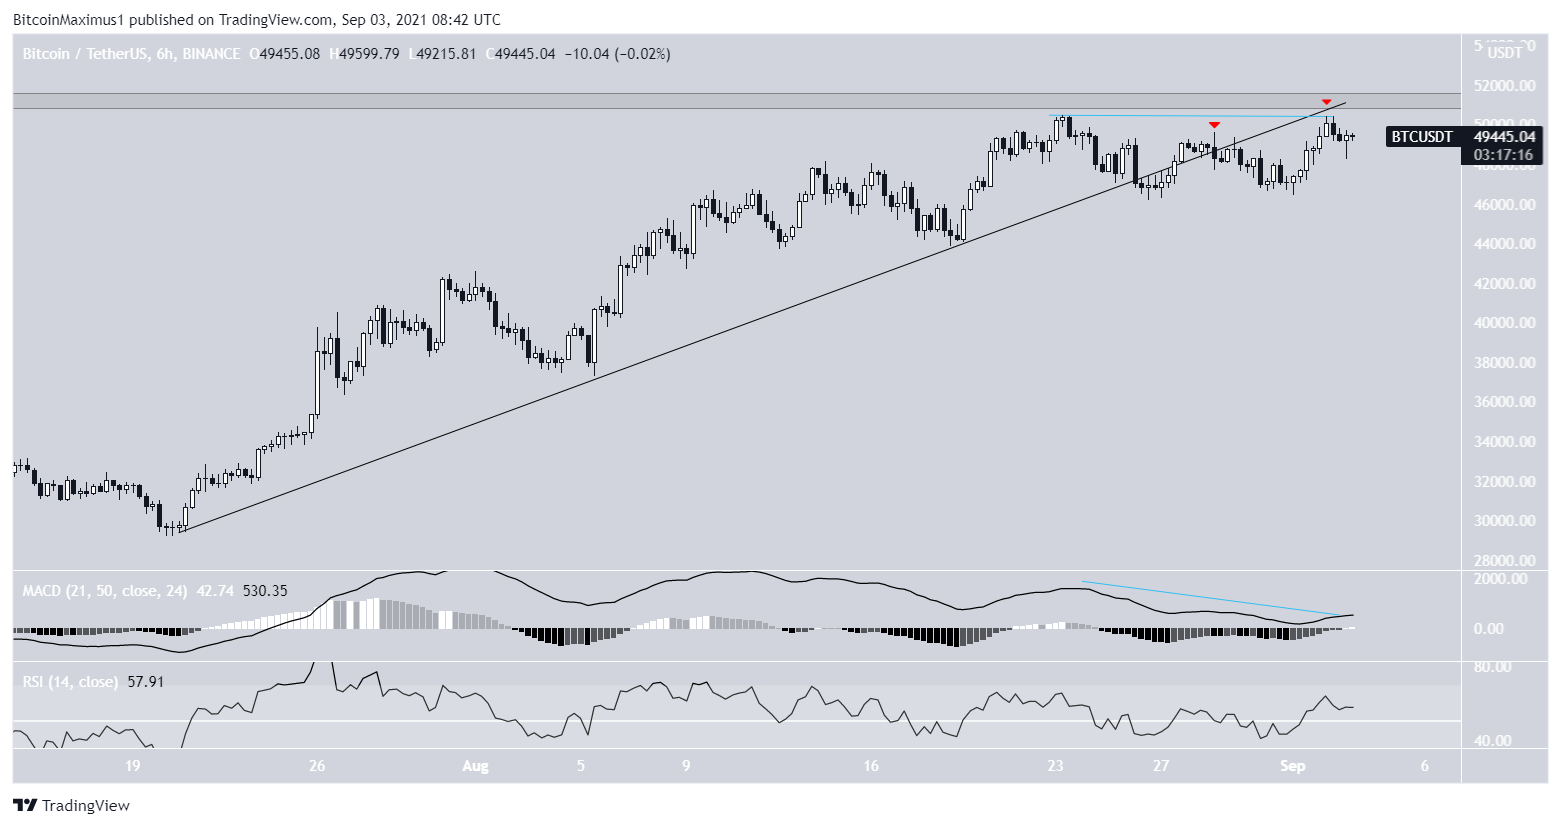
Similar to the daily time frame, the six-hour chart also provides mixed readings.
After BTC broke down from an ascending support line on Aug 26, it has made several attempts at reclaiming it but hasn’t been successful.
In addition to this, the RSI is freely moving above and below 0, a sign of an undetermined trend. Also, while the MACD is positive, it has generated a bearish divergence.
Therefore, while indicators are mixed, the price action is still leaning on being bearish.
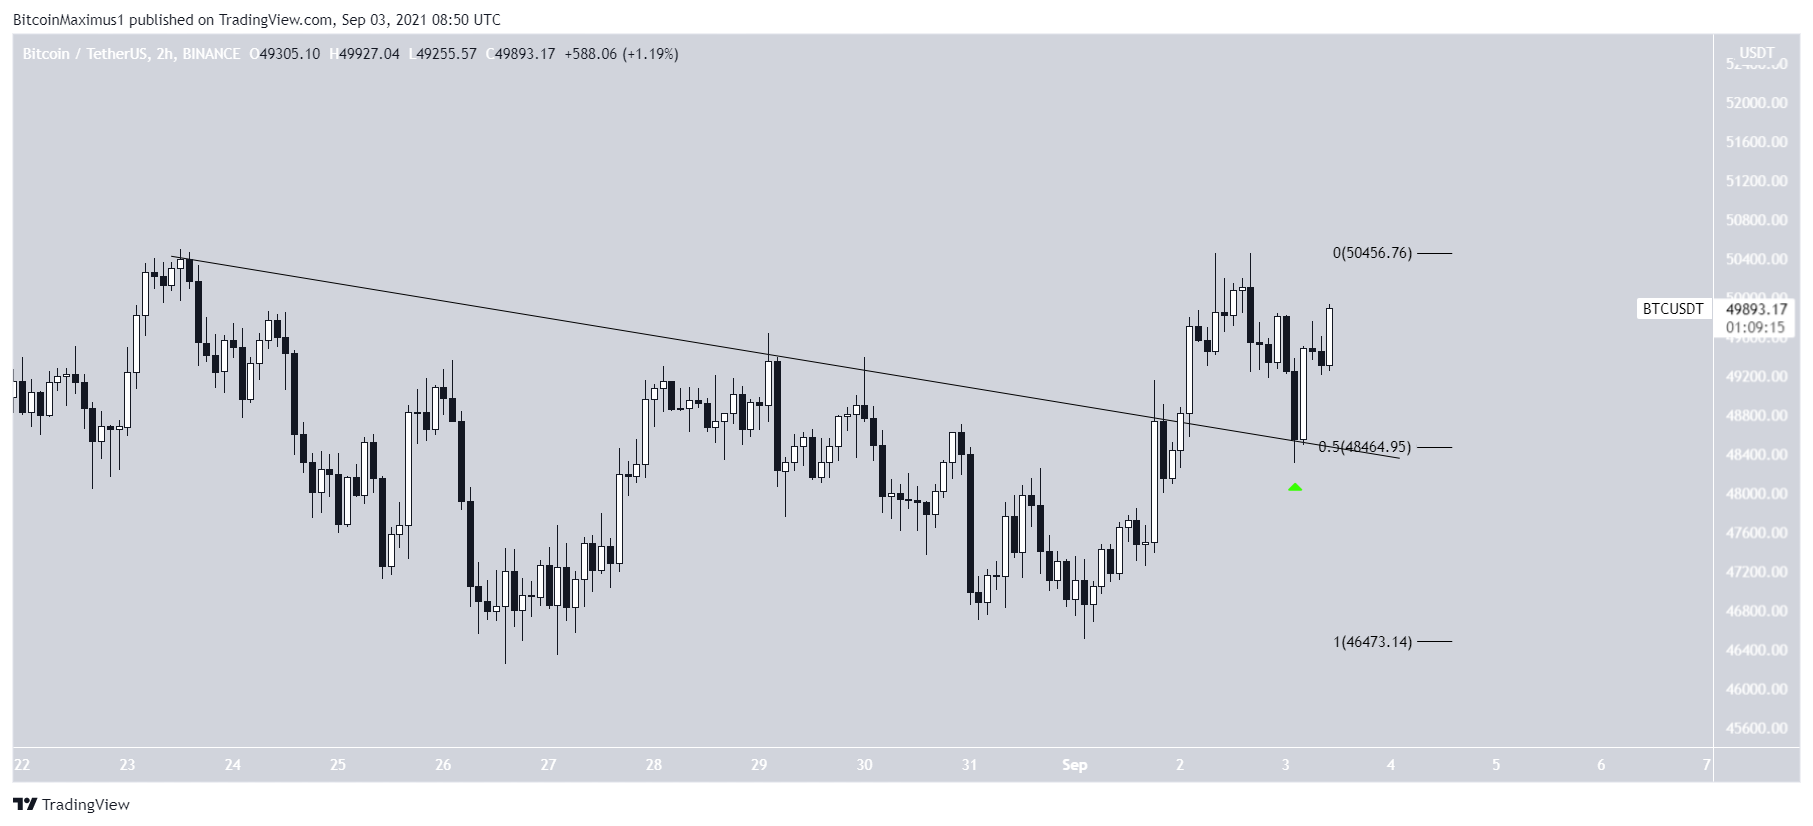
The two-hour chart, however, shows that BTC has already broken out from a descending resistance line and validated it as support after (green icon). The bounce also coincided perfectly with the 0.5 Fib retracement support level.
Therefore, it seems likely that BTC will make another attempt at breaking out above the $51,200 resistance area. Currently, we cannot determine whether it will be successful or not.
For BeInCrypto’s latest Bitcoin (BTC) analysis, click here.


