


Be[in]Crypto looks at on-chain indicators for Bitcoin (BTC), more specifically the Net Realized Profit/Loss (NUPL) indicator. This is done in order to draw parallels to previous market cycles and attempt to determine if the long-term BTC trend is still bullish.
NUPL
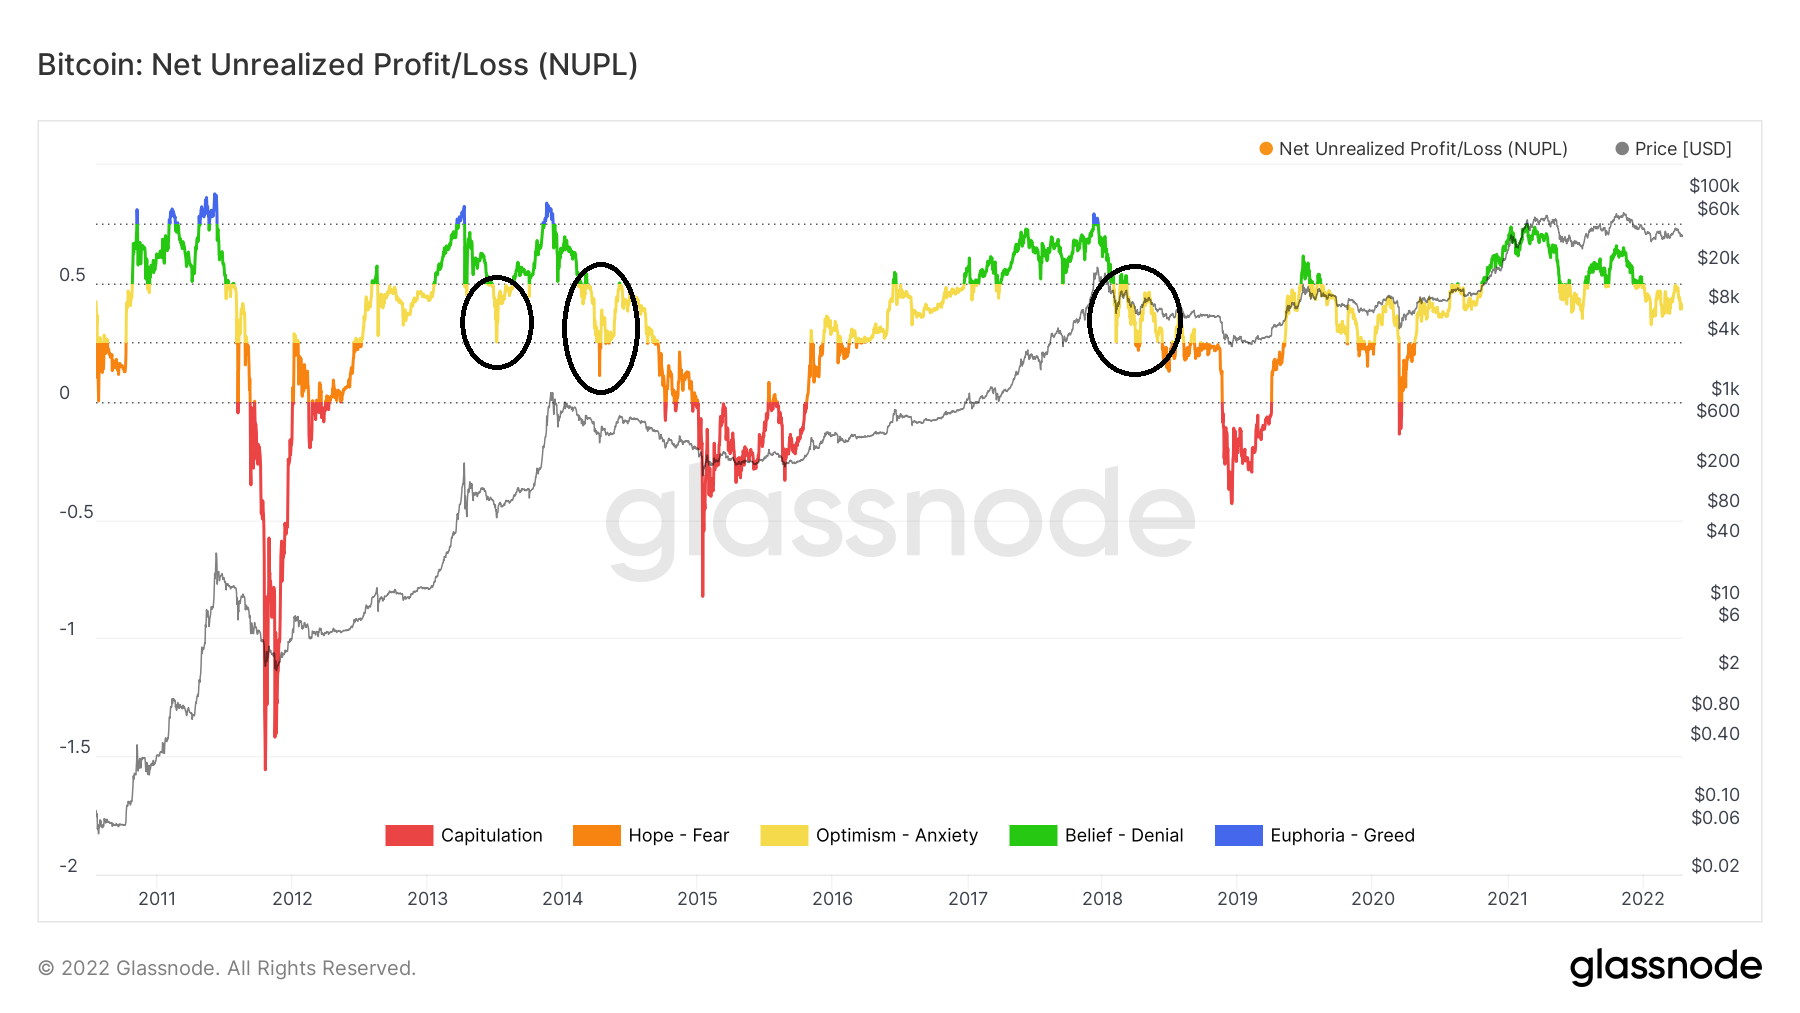
NUPL is an on-chain indicator that is used in order to measure whether the market is in an aggregate state of profit or loss. It does this by dividing relative unrealized profit with relative unrealized loss. Values below 0 mean that the market is in loss, while those above 0 indicate that the market is in profit.
Historically, values above 0.75 (blue) have coincided with market tops while those below 0 (red) have coincided with market bottoms.
Market cycle analysis
The most interesting relationship between a BTC market cycle and NUPL comes from the 0.5 line. Historically, once NUPL crosses above it, the next significant cross below suggests that the bearish market cycle has begun.
This was the case in 2018 (black circle), and in 2014 (red circle), though in the latter it took two breakdowns from the bearish cycle to begin.
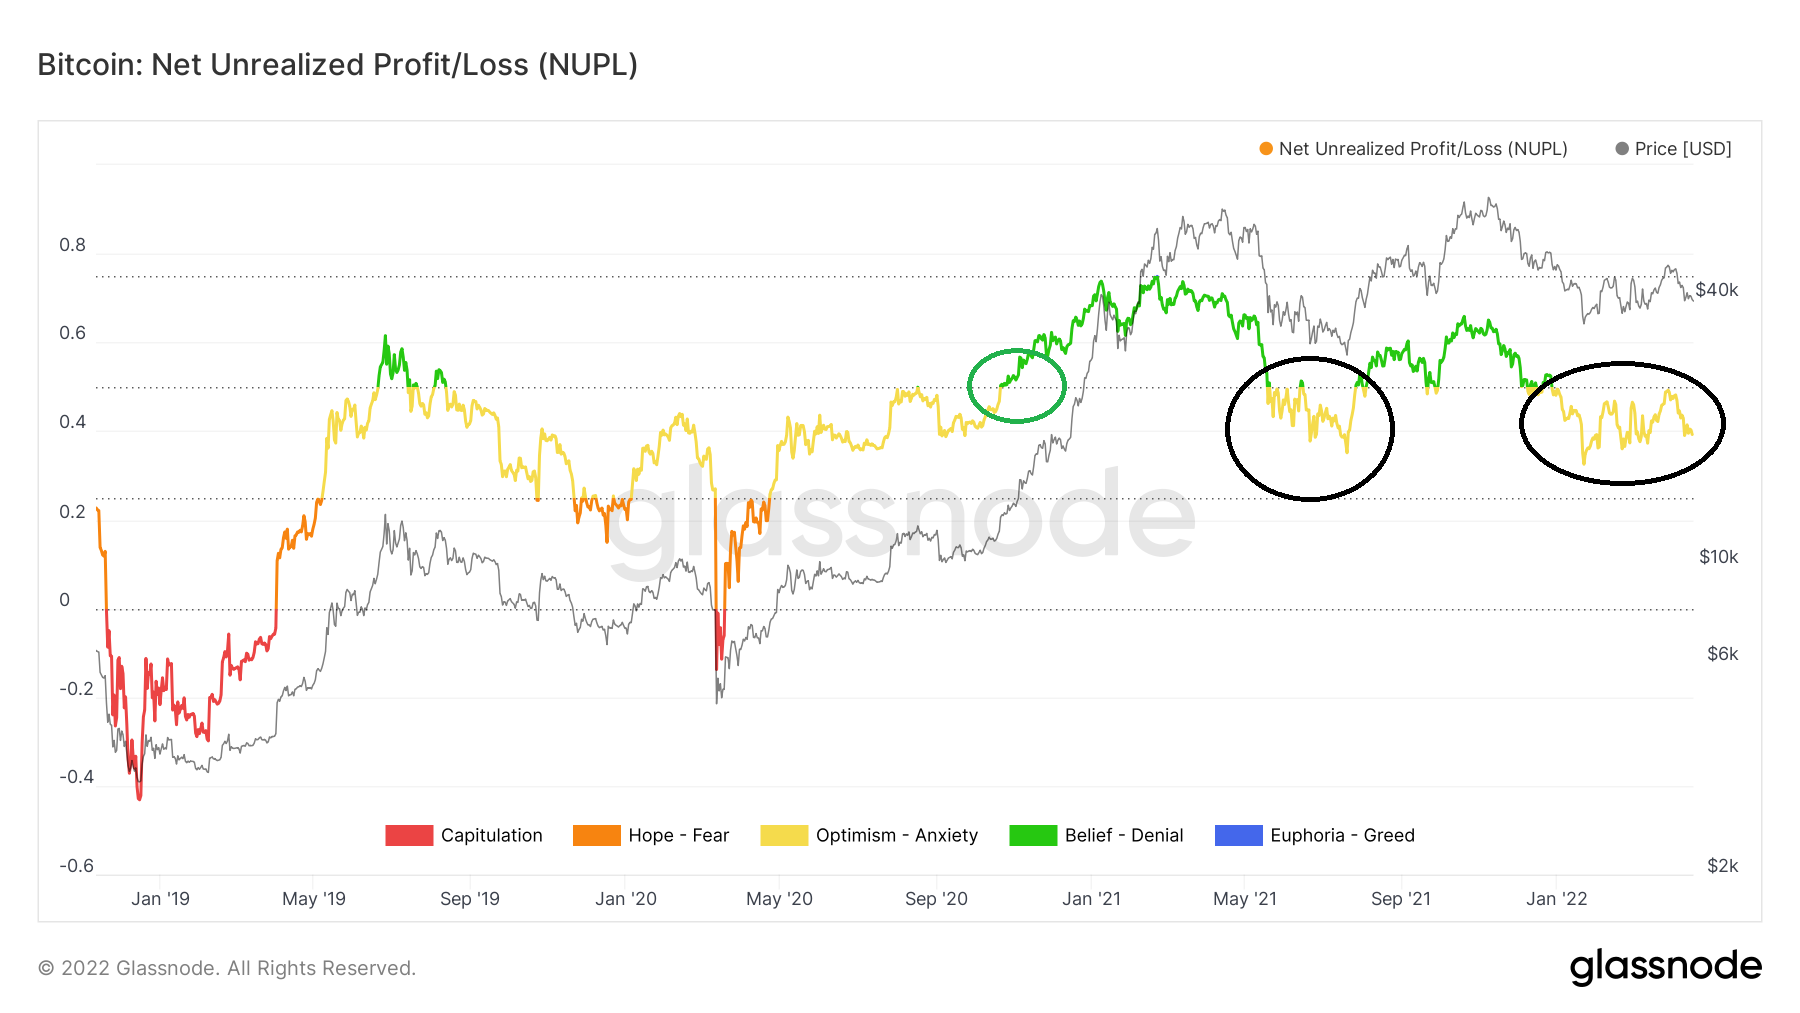
In the current market cycle, NUPL crossed above 50 for the first time in Oct 2020 (green circle). Afterward, it crossed below it twice (black circles), in May 2021 and Jan 2022.
As stated above, in the two previous market cycles, this meant that a bearish cycle had begun.
Is BTC bullish?
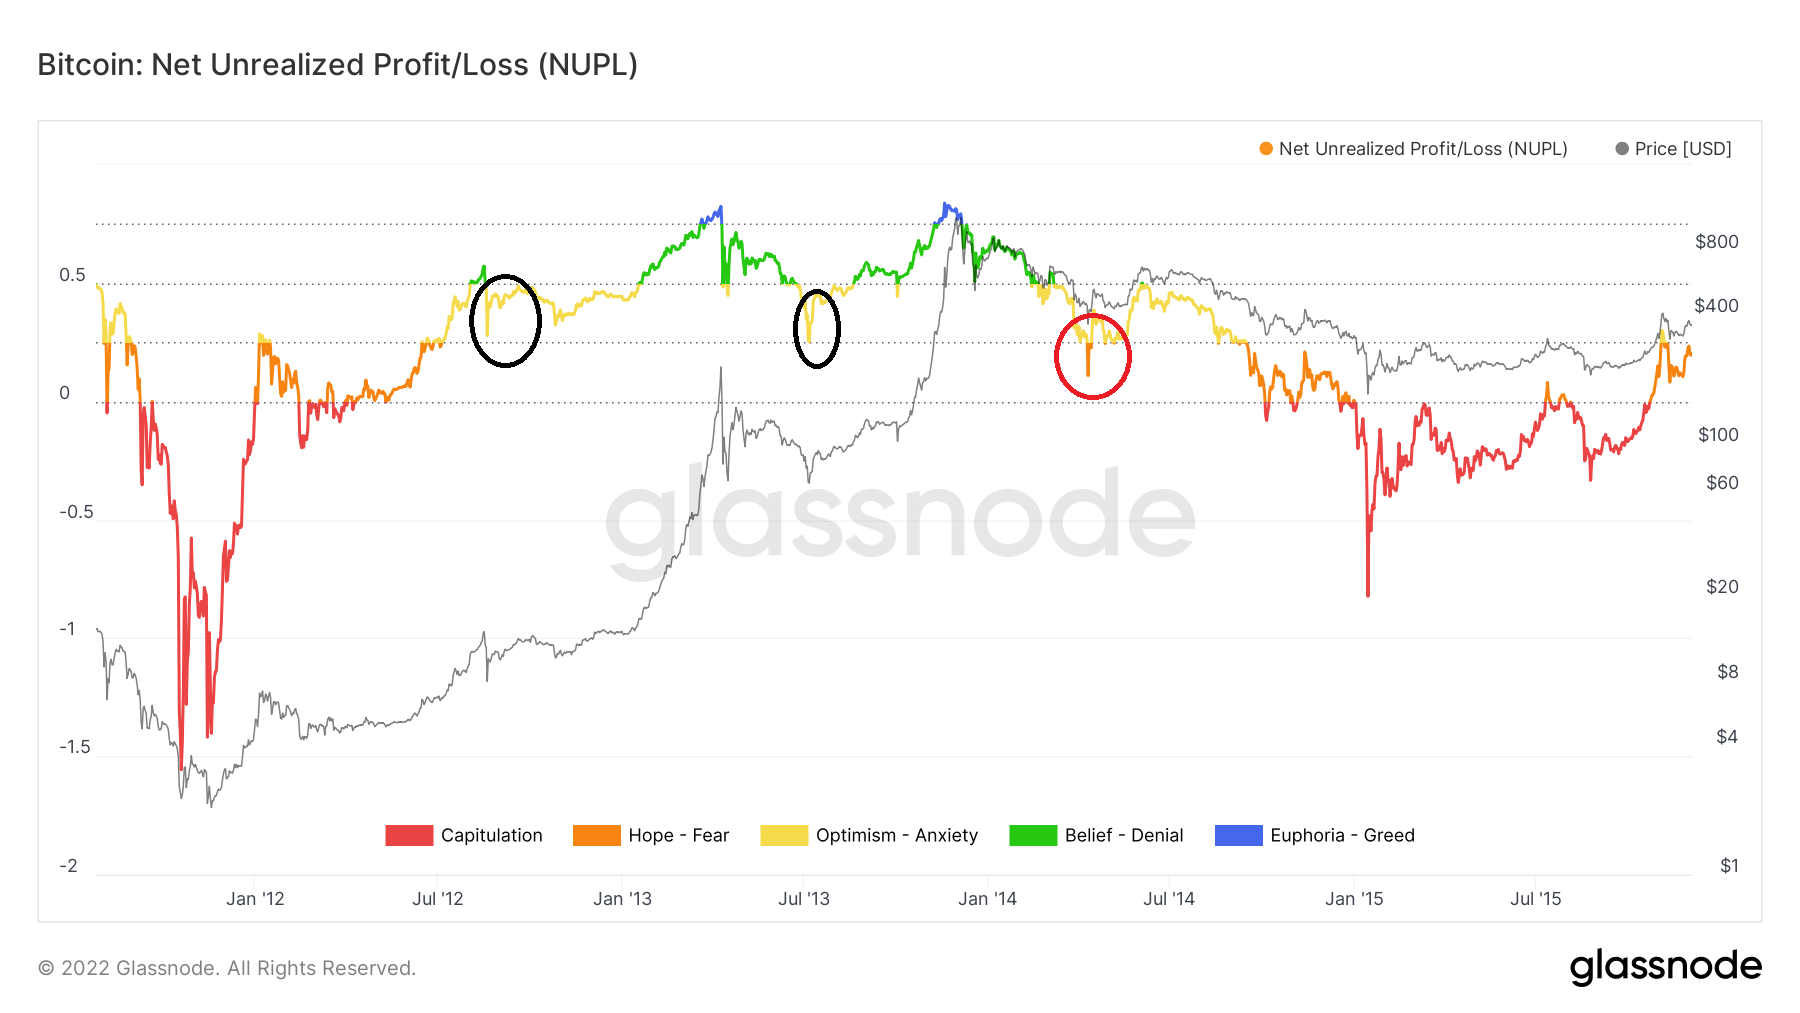
There is a distinct similarity between the current market cycle and that which transpired from 2011 to 2014. And there are some similarities between the current NUPL values and those seen in 2012 and 2013.
In August 2012, NUPL briefly moved above 0.5, but fell back below it almost immediately afterward (black circle). This, however, did not mark the beginning of the correction. Rather, NUPL continued to increase alongside the BTC price, which reached a new all-time high.
Afterward, the third decrease below 0.5 (red circle) was the one that marked the beginning of the long-term correction.
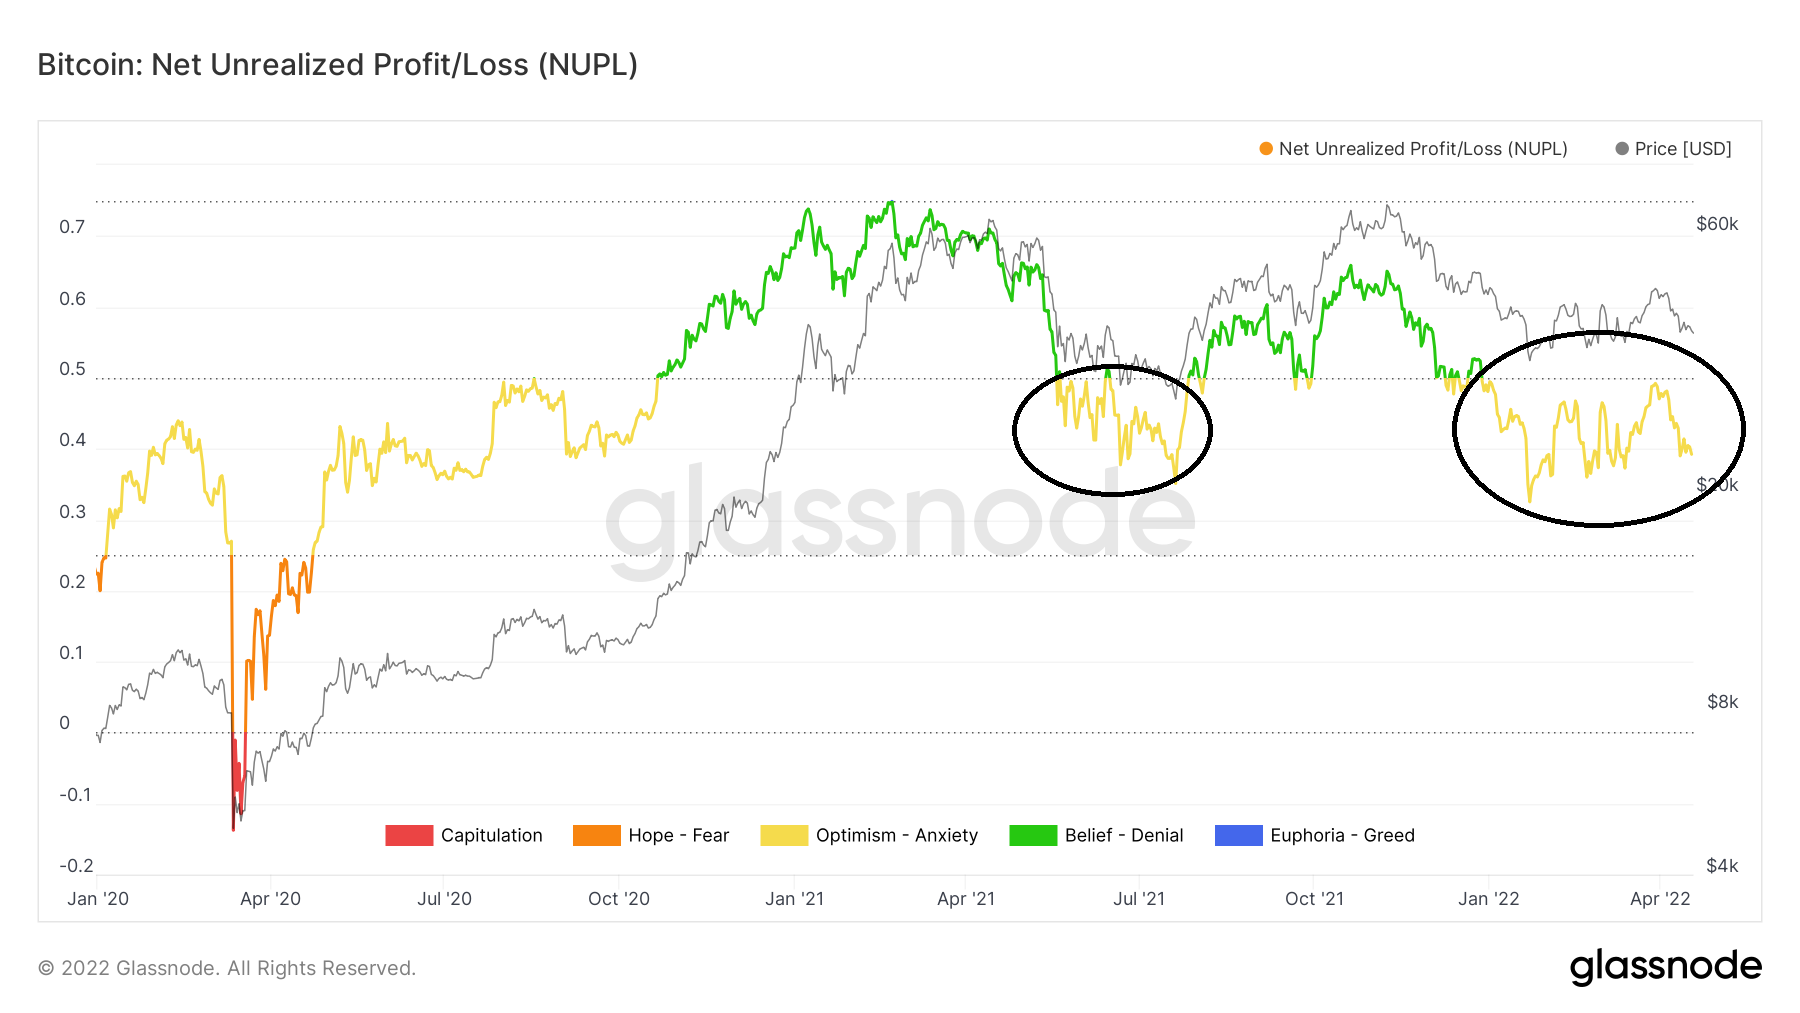
So far, NUPL has moved below the 0.5 line twice, on May 2021 and Jan 22 (black circles), respectively. Judging from previous history, it is possible that the price makes another attempt at an all-time high. This would likely cause the NUPL to move above 0.5 once more.
So, as long as NUPL is consolidating above 0.25, it is possible that a bullish reversal will transpire. However, a decrease below 0.25 would confirm that a bearish market cycle has begun.
For Be[in]Crypto’s latest Bitcoin (BTC) analysis, click here


