


Despite the Bitcoin (BTC) price action being firmly bearish, technical indicators suggest a significant rebound could occur soon.
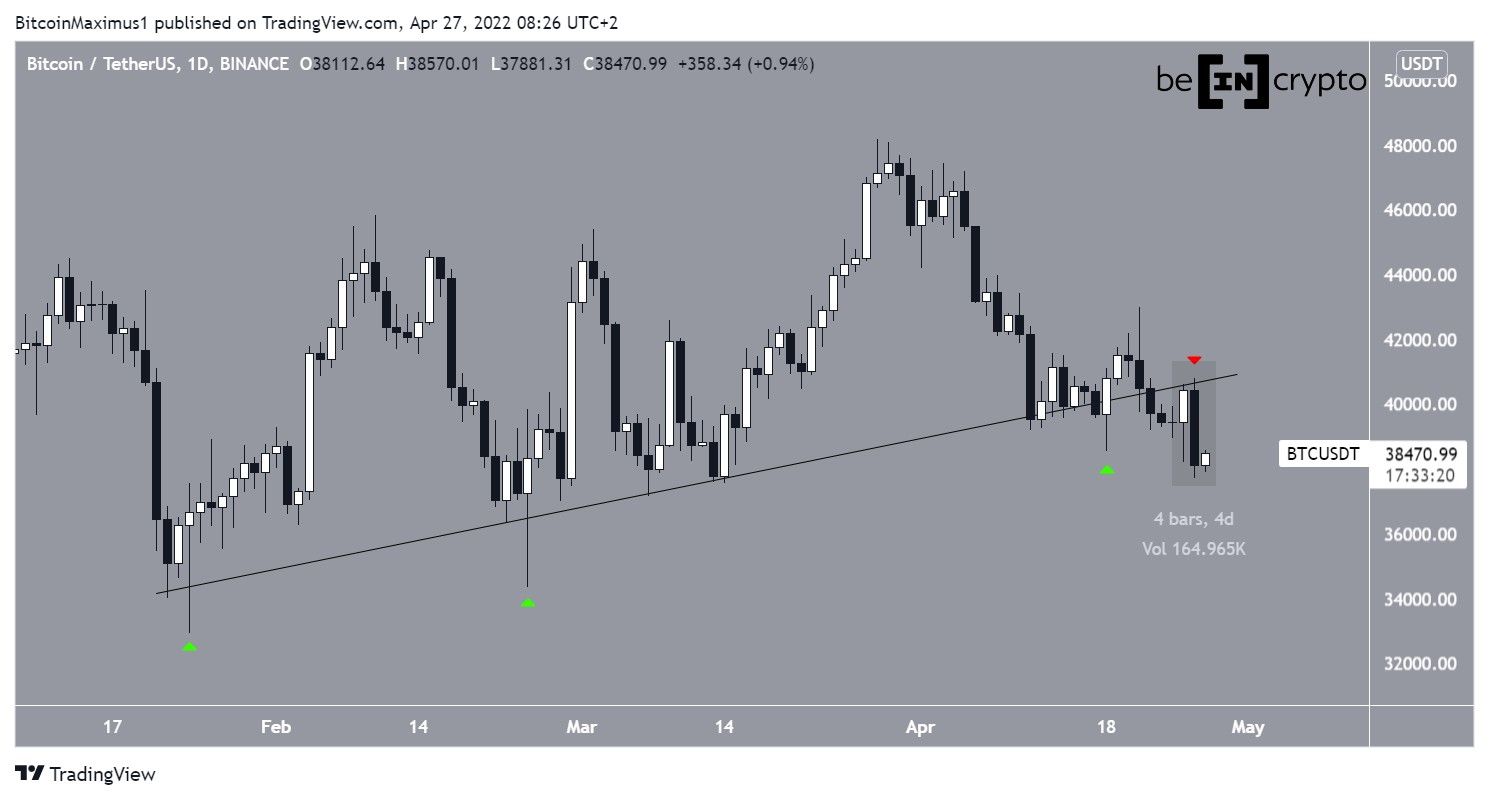
Bitcoin had been increasing above an ascending support line since Jan. 22. The line was validated numerous times and subsequent bounces created several long lower wicks and bullish candlesticks (green icons).
While the exact slope of the line cannot be accurately determined due to the presence of those wicks, it seems that BTC finally broke down from the line on April 22.
While it initially created a bullish candlestick on April 26, the gains were completely negated by a bearish engulfing candlestick the next day (highlighted). This also served to validate the previous ascending support line as resistance (red icon).
This is a bearish development that could lead to lower prices.
Bullish divergences pile up
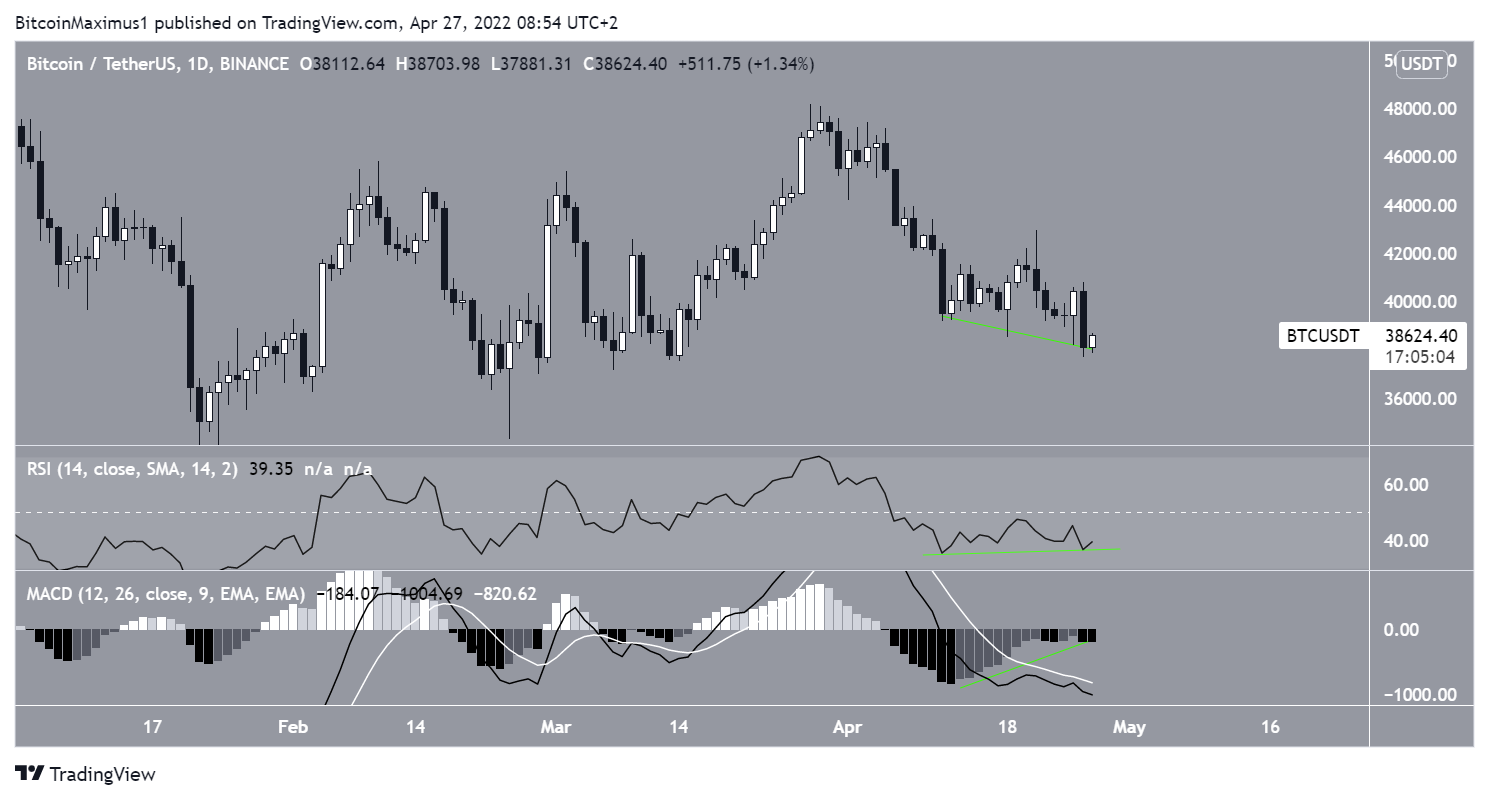
Despite the bearish price action, technical indicators are showing several bullish signs. This is evident by the bullish divergences that have developed in the RSI and the MACD histogram.
The RSI divergence is especially notable since similar readings have previously led to significant upward movements and it’s transpiring in the daily time frame.
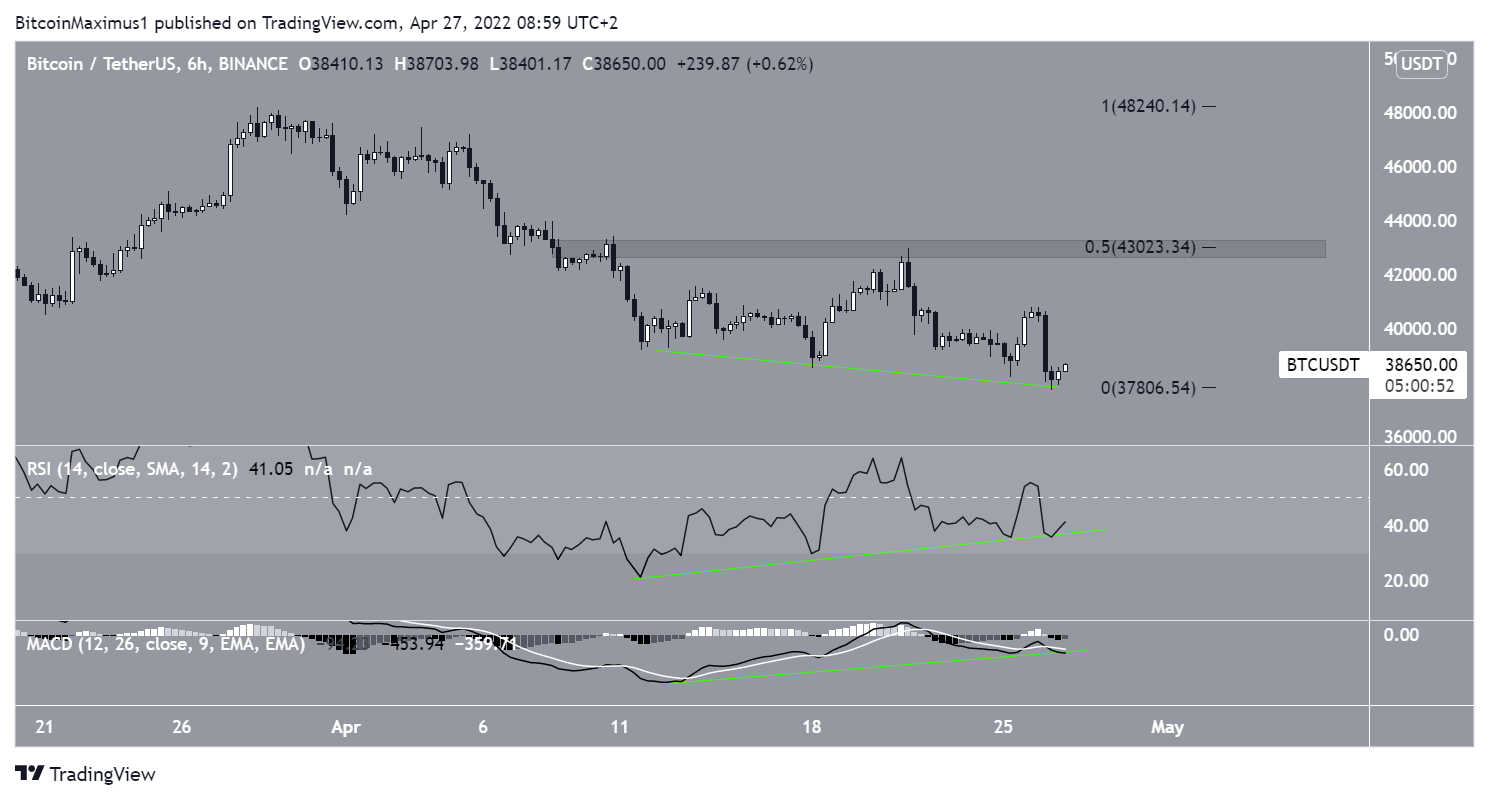
The six-hour chart also supports the possibility of a considerable rebound in price. Similar to the daily time frame, both the RSI and MACD have generated bullish divergences (green lines).
If these are a catalyst for a bounce in BTC price, the closest resistance area would be found near $43,000. This target is both the 0.5 Fib retracement resistance level and a horizontal resistance area.
Short-term BTC movement
The two-hour chart shows a horizontal resistance area at $38,650. This is a level that has previously acted as support, prior to the April 27 breakdown.
Currently, BTC is in the process of moving above this area. If it’s successful in doing so, BTC would be expected to keep increasing toward the previously outlined resistance area near $43,000.
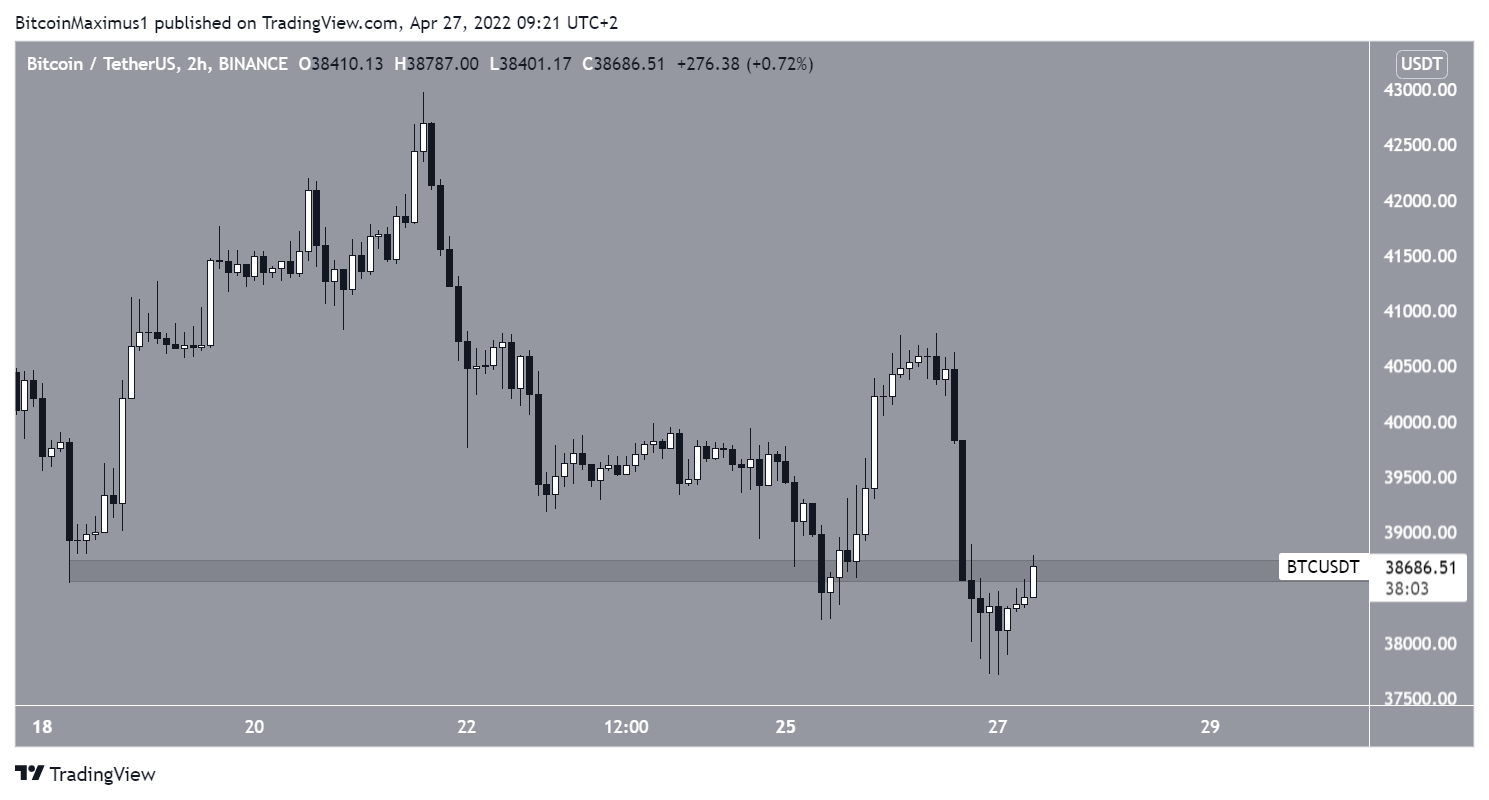
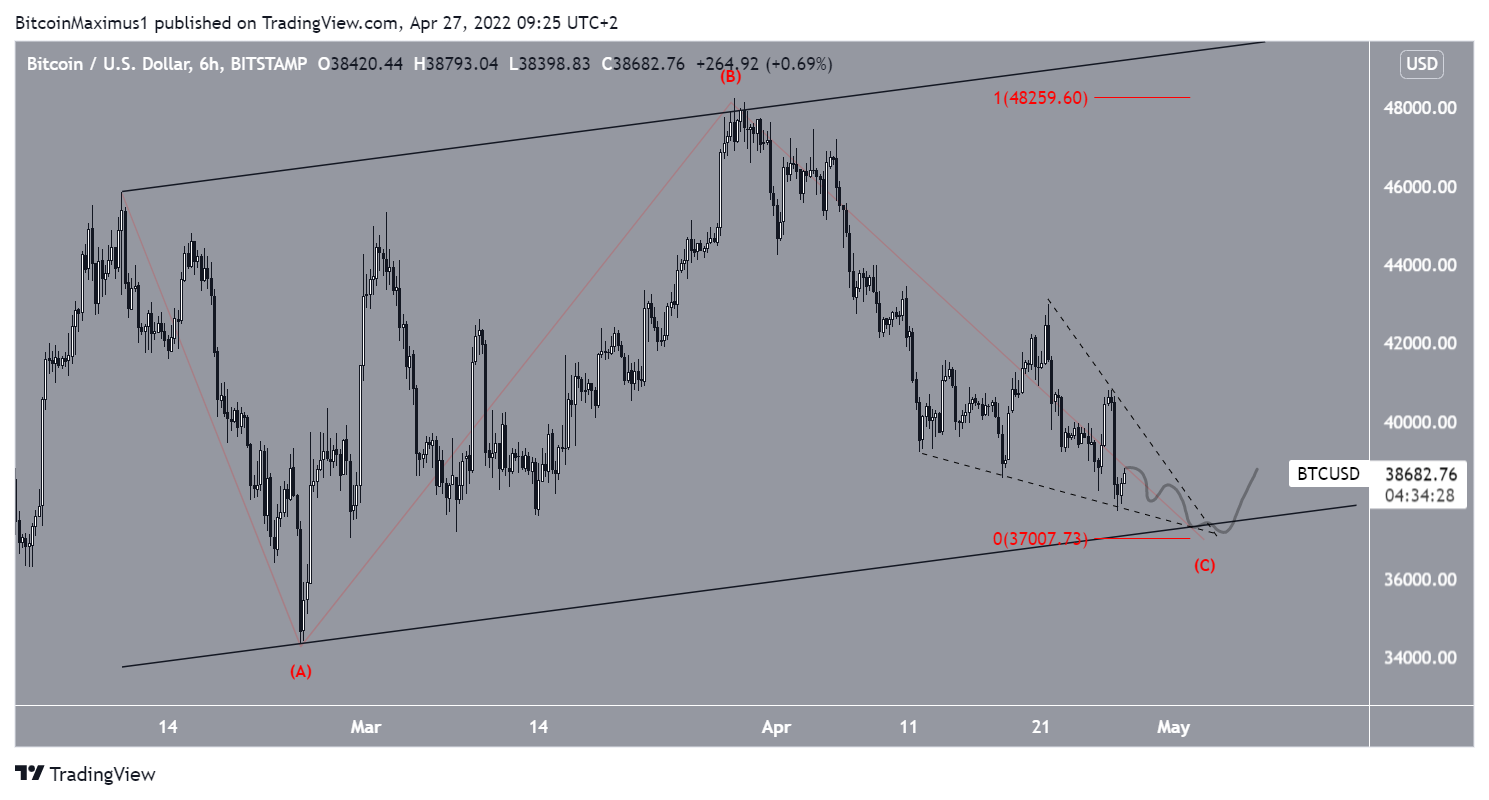
If it fails, BTC could continue gradually decreasing towards $37,000, validating the support line of an ascending parallel channel that has been in place since Feb. 24, before breaking out.
In any case, it does seem that a bottom is very close to being reached.
For BeInCrypto’s previous Bitcoin (BTC) analysis, click here.


