


Bitcoin (BTC) has fallen back slightly today after reaching a local high around $41,300 on June 15.
The high was made inside the $41,250 resistance area, from which a breakout has yet to occur.
Bitcoin reaches resistance
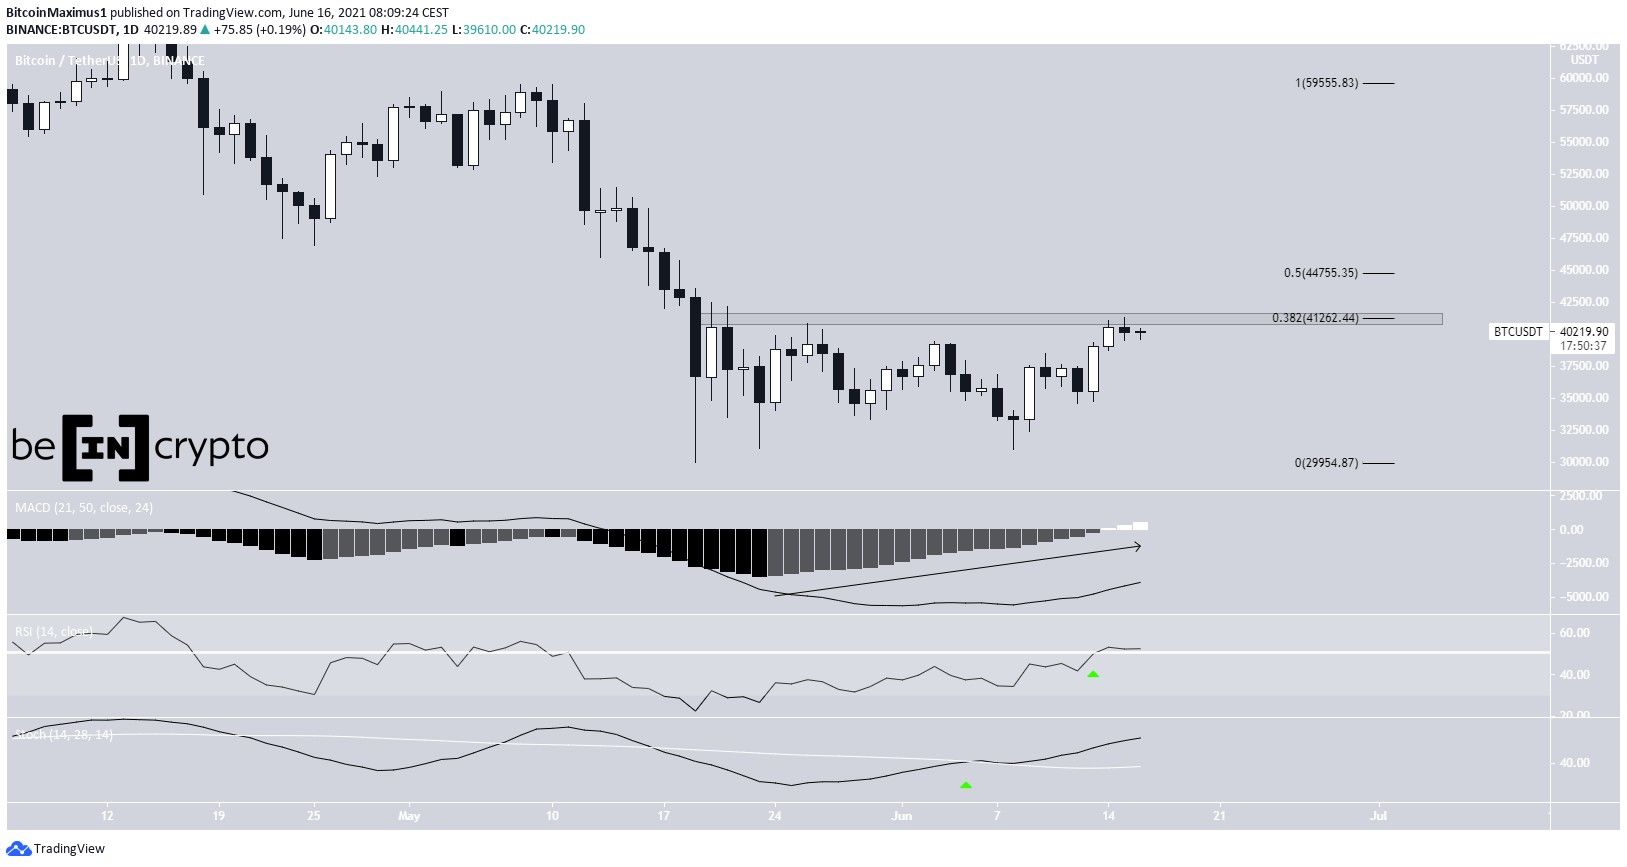
Bitcoin reached a high of $41,330 before falling slightly towards the current price of $40,230. The high was made inside the $41,250 resistance area, which is the 0.382 Fib retracement level.
Despite the drop, technical indicators are firmly bullish. The MACD has reached the positive territory and both the RSI and Stochastic oscillator are increasing. The former is above 50 while the latter has made a bullish cross. Therefore, an eventual breakout is likely.
If a breakout occurs, the next resistance would be at $44,755. This target is the 0.5 Fib retracement resistance level.
However, the short-term chart is showing some signs of weakness.
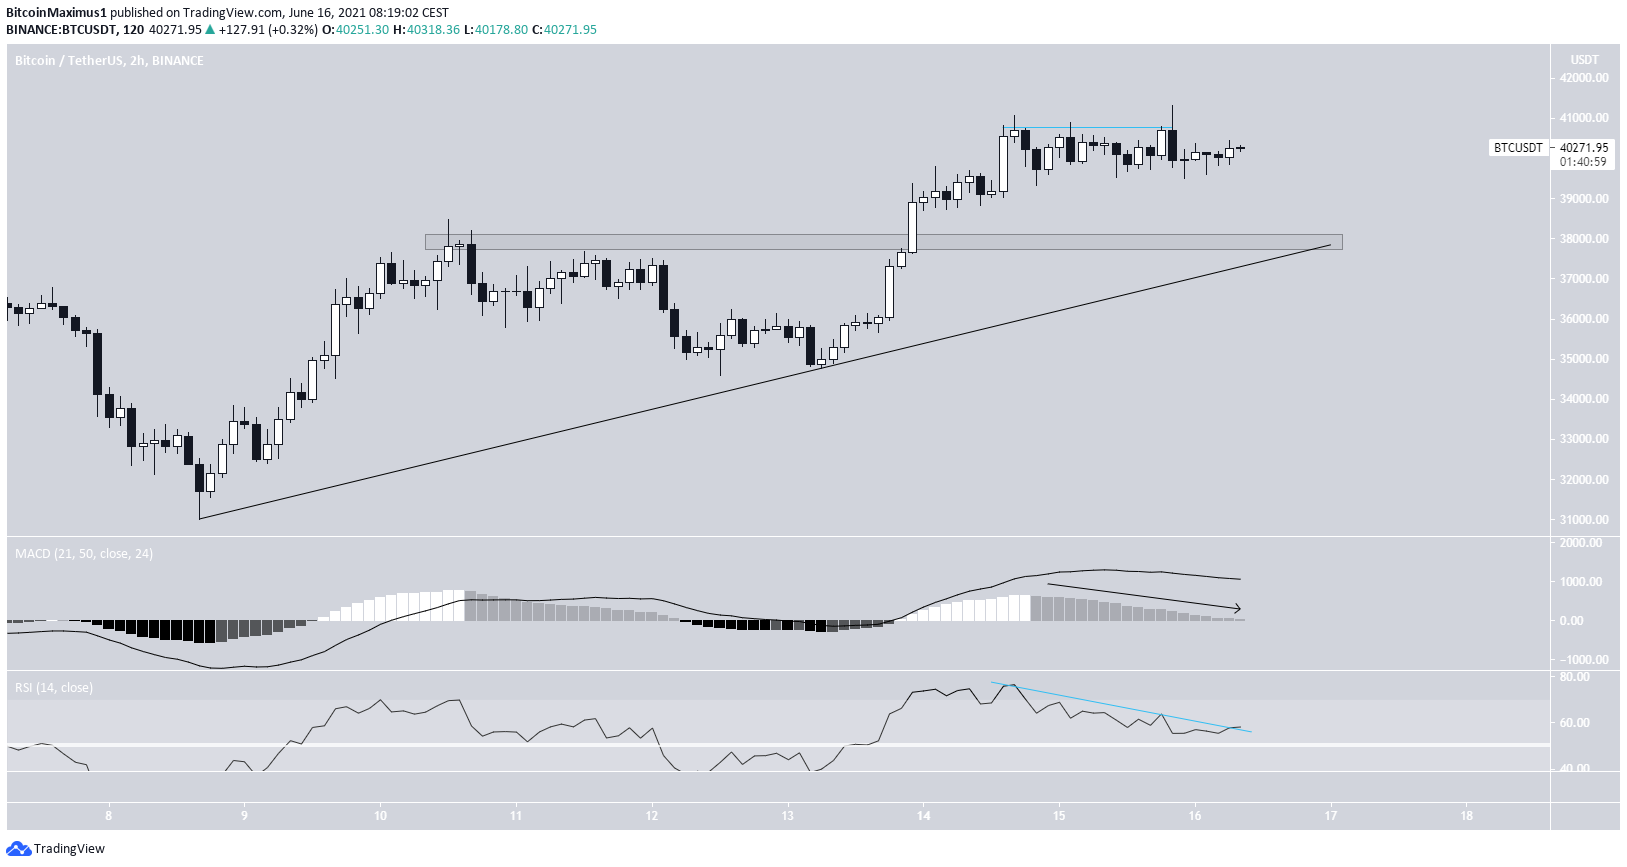
The MACD are RSI are both decreasing. The former has given a bearish reversal signal and is close to turning negative and the latter has generated a bearish divergence.
If BTC pulls back, the $38,000 area is suitable for a bottom to be reached. It’s a horizontal support area and coincides with a potential ascending support line.
Wave count
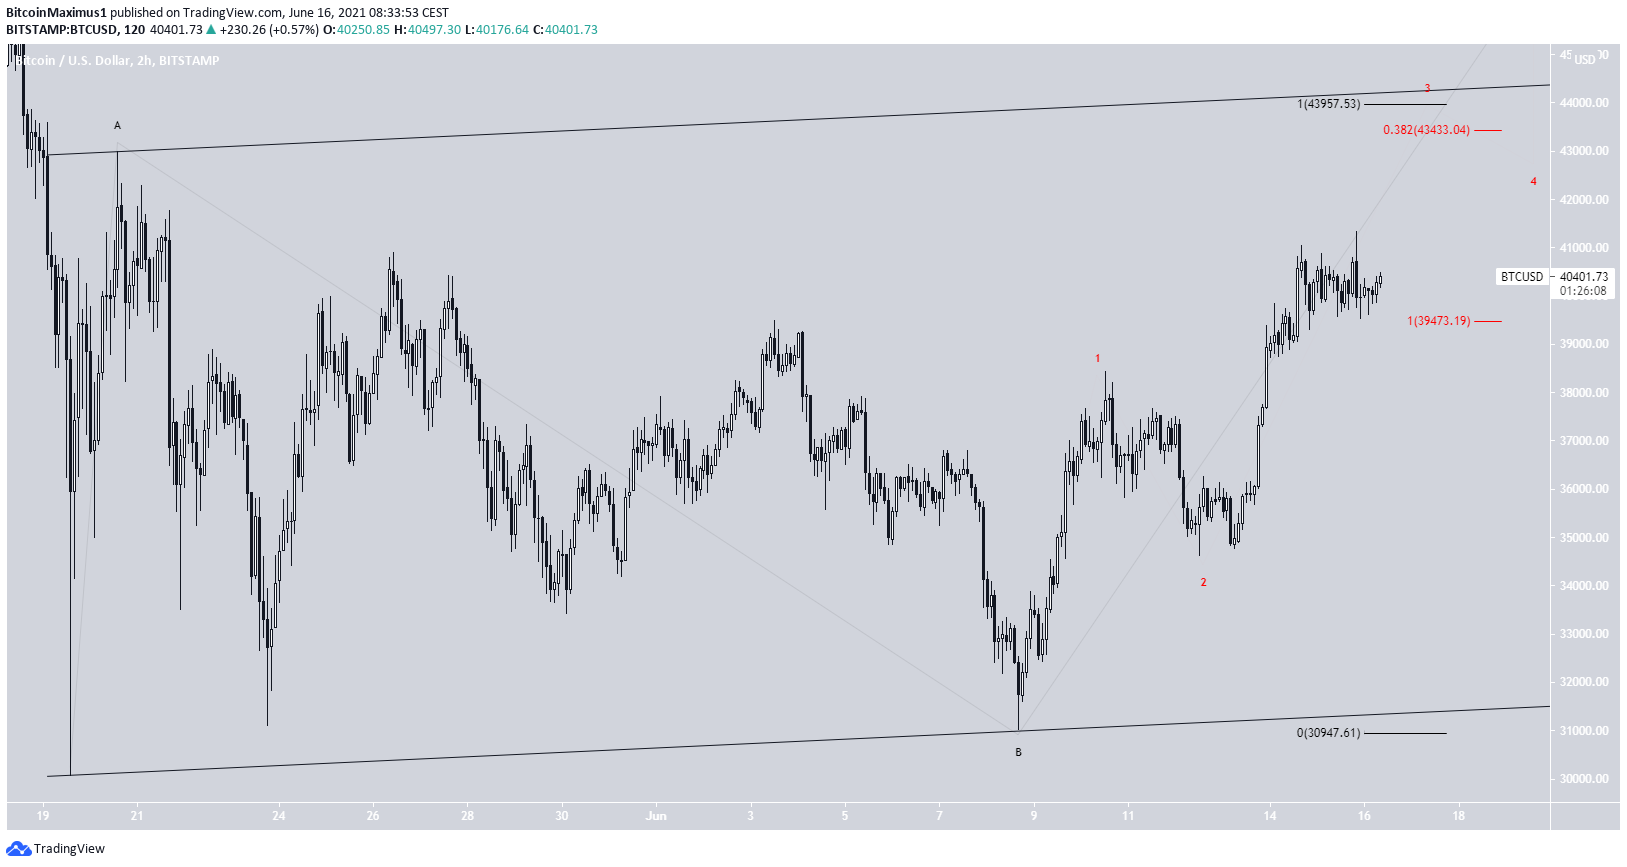
The pattern appears to be an A-B-C corrective structure, contained inside a parallel ascending channel. This formation has been developing since May 19.
There is a confluence of Fib targets near $43,950 (red and black). Furthermore, the level represents the resistance line of the channel.
A movement above this level would suggest that the move is impulsive rather than being a correction.
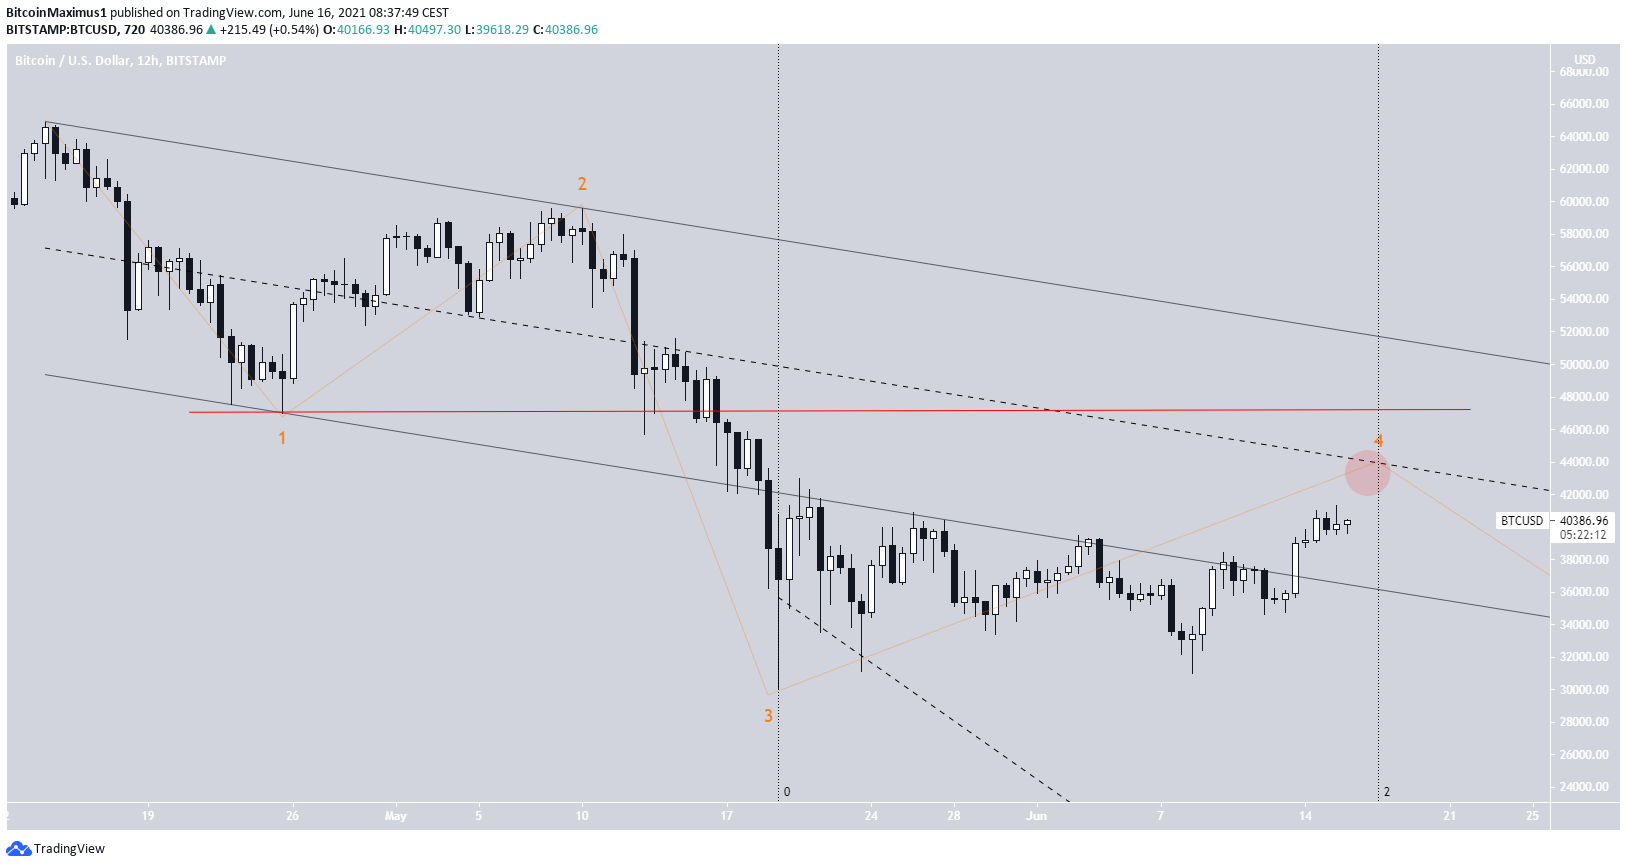
In the most likely long-term wave count, BTC is in wave four (orange) of a bearish impulse.
In this case, an increase towards $43,950 would complete a fourth-wave pullback, reaching the midline of the parallel channel (red circle).
As outlined above, a continued increase that takes BTC above $47,005 (red line) would indicate that the trend is bullish instead.
For BeInCrypto’s previous bitcoin (BTC) analysis, click here.



