


Bitcoin (BTC) is showing bullish signs after bouncing at a long-term support area. It could soon initiate an upward move to test higher levels.
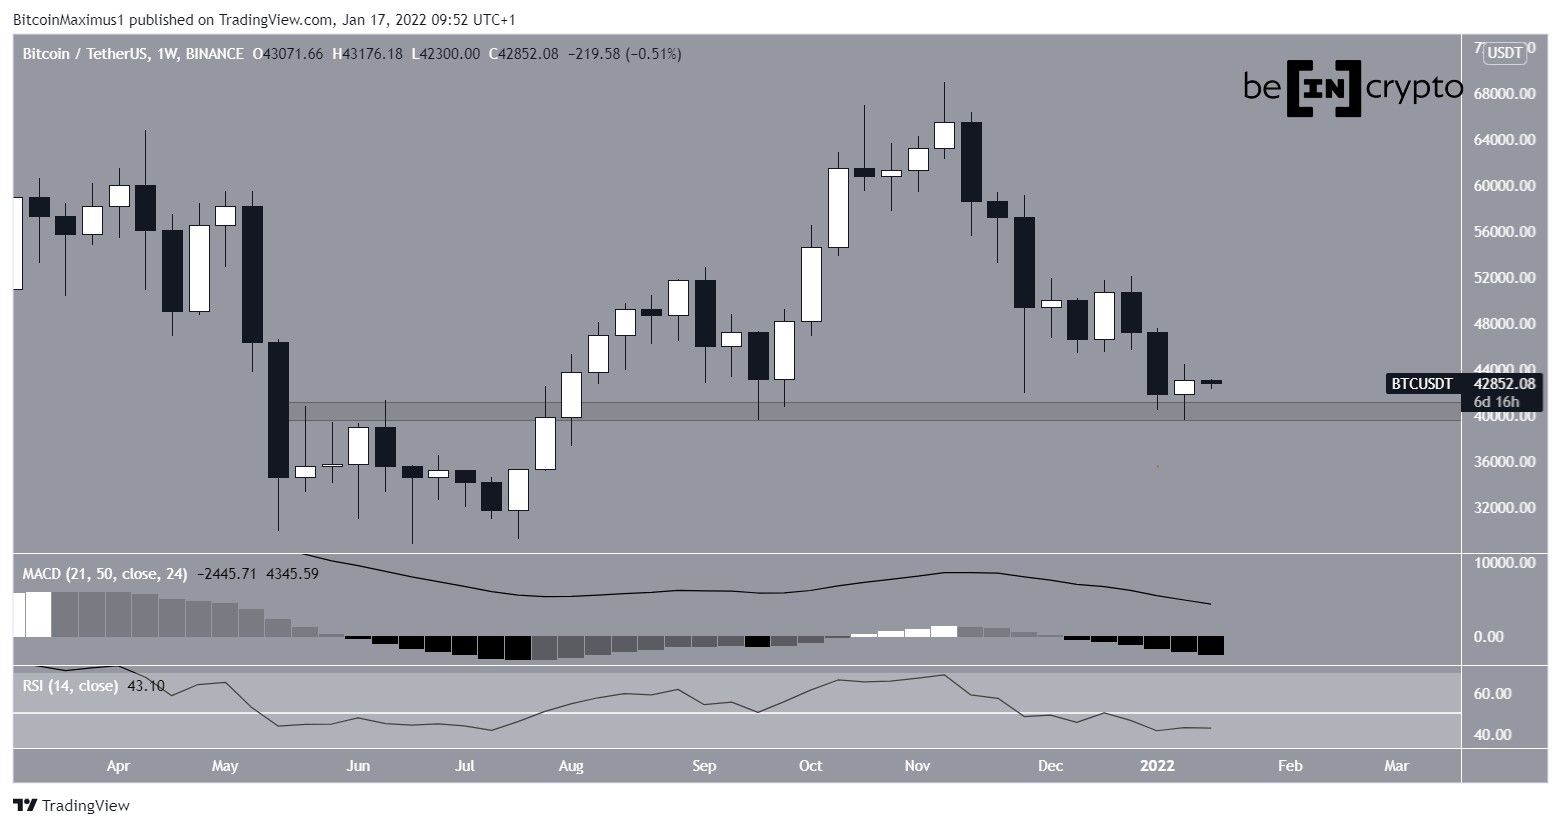
BTC increased slightly during the week of Jan 10-16. It moved upward from a low of $39,650 and managed to reach a high of $44,500. However, the entire increase was comfortably contained within the previous bearish candlestick.
Therefore, the increase cannot yet be considered as part of a bullish reversal.
However, BTC is still trading above the long-term horizontal support at $40,500.
Potential reversal
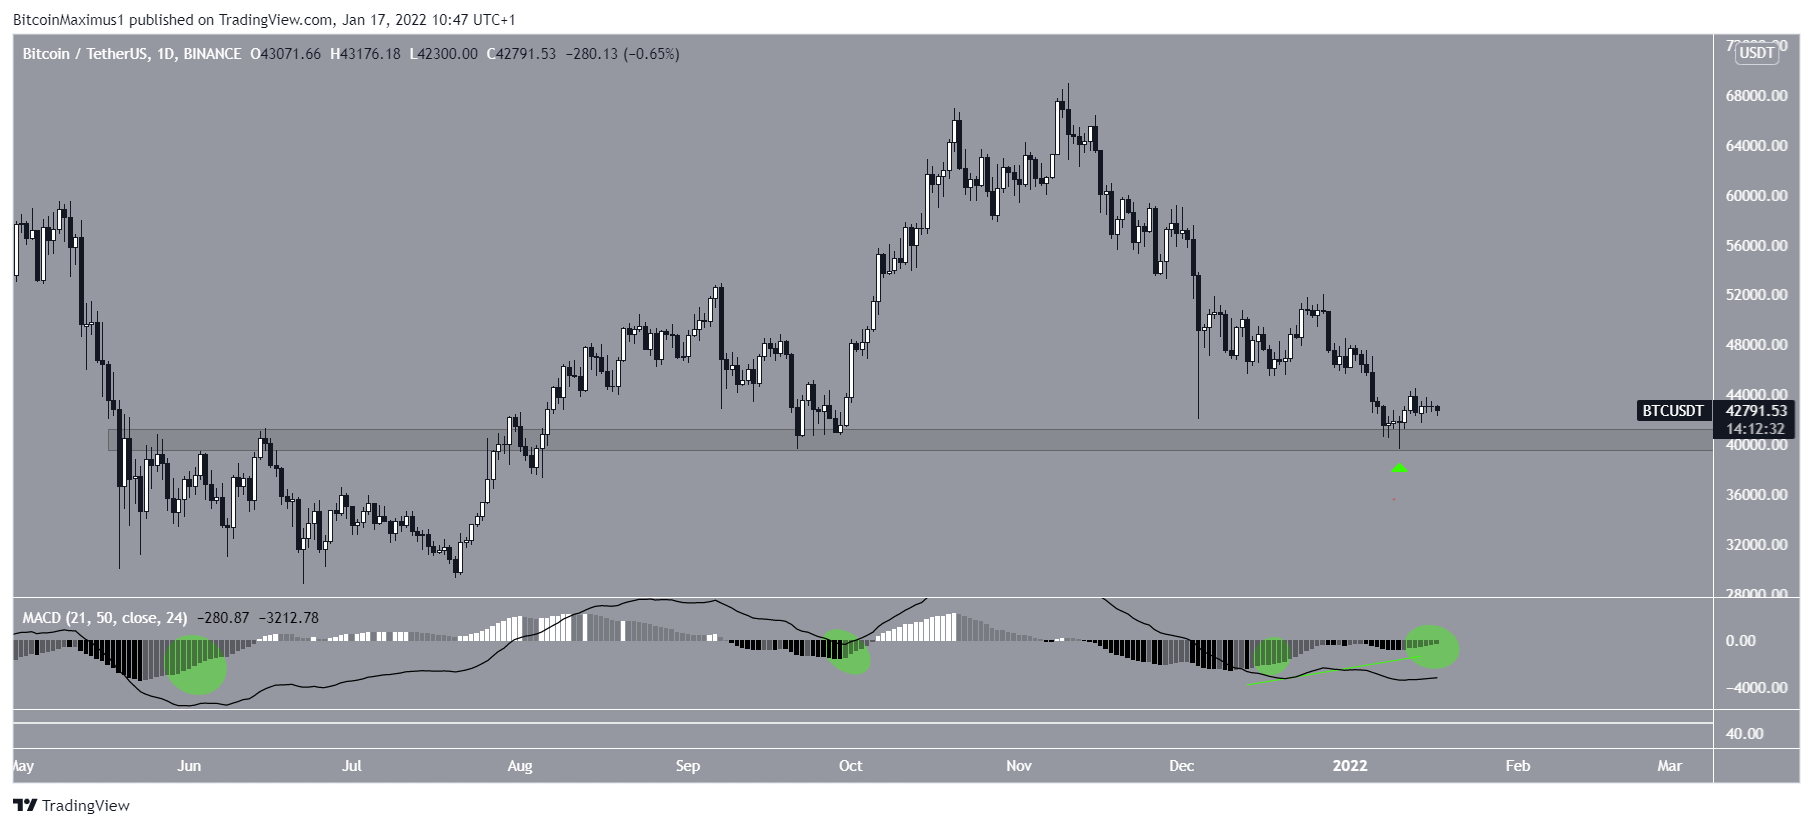
The daily chart provides a slightly more bullish outlook.
Firstly, it shows that BTC has created a long lower wick (green icon) just above the aforementioned support.
More importantly, the MACD has given a strong bullish signal by creating successive higher momentum bars and has nearly crossed into positive territory. The MACD is created by short and long-term moving averages (MA), and this increase means that the short-term MA is accelerating relative to the long-term MA. A cross into positive territory would mean that it’s moving faster and would go a long way in suggesting that the trend is bullish.
The last time the MACD crossed into positive territory (green circles), it led to significant increases in the price of BTC.
Future BTC movement
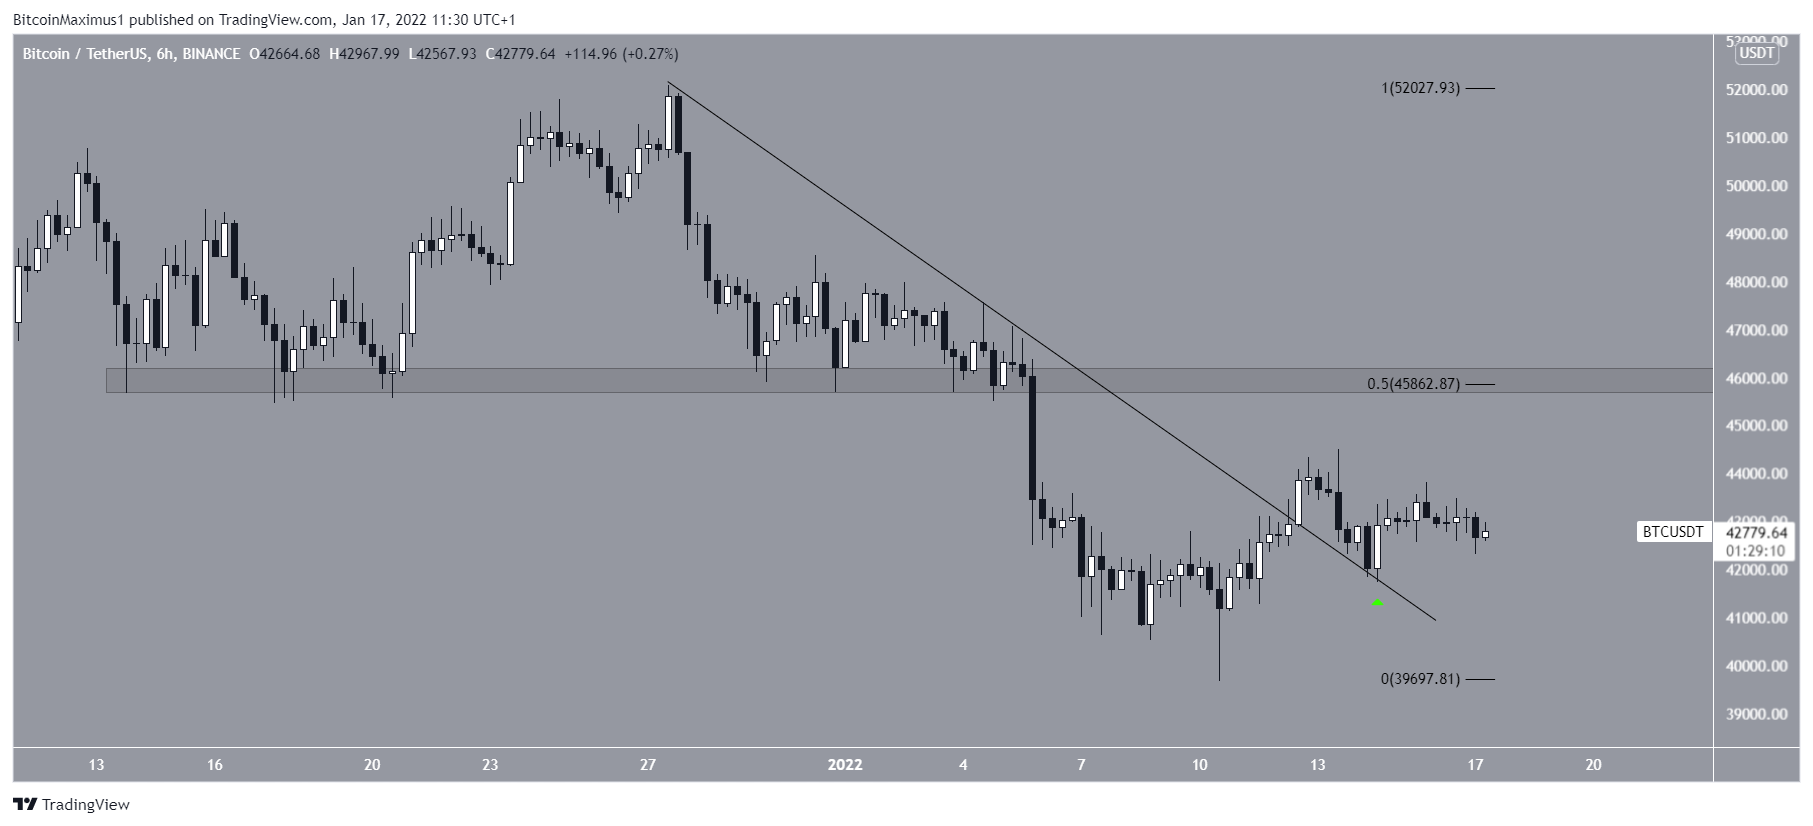
The six-hour chart also supports the possibility of an upward movement. It shows that BTC broke out from a descending resistance line and validated it as support after (green icon). In the majority of these cases, an increase in price follows.
If an upward move transpires, the closest resistance area would be found at $45,850. This is the 0.5 Fib retracement resistance level and a horizontal resistance area.
The wave count also supports the possibility of a short-term increase.
For BeInCrypto’s previous Bitcoin (BTC) analysis, click here.


