


The Bitcoin (BTC) price decreased considerably on Dec. 21, and at one point reached a daily low of $21,815.
However, the bullish structure is still intact and Bitcoin is expected to move higher unless the invalidation levels outlined below are broken.
Ongoing Bitcoin Dips
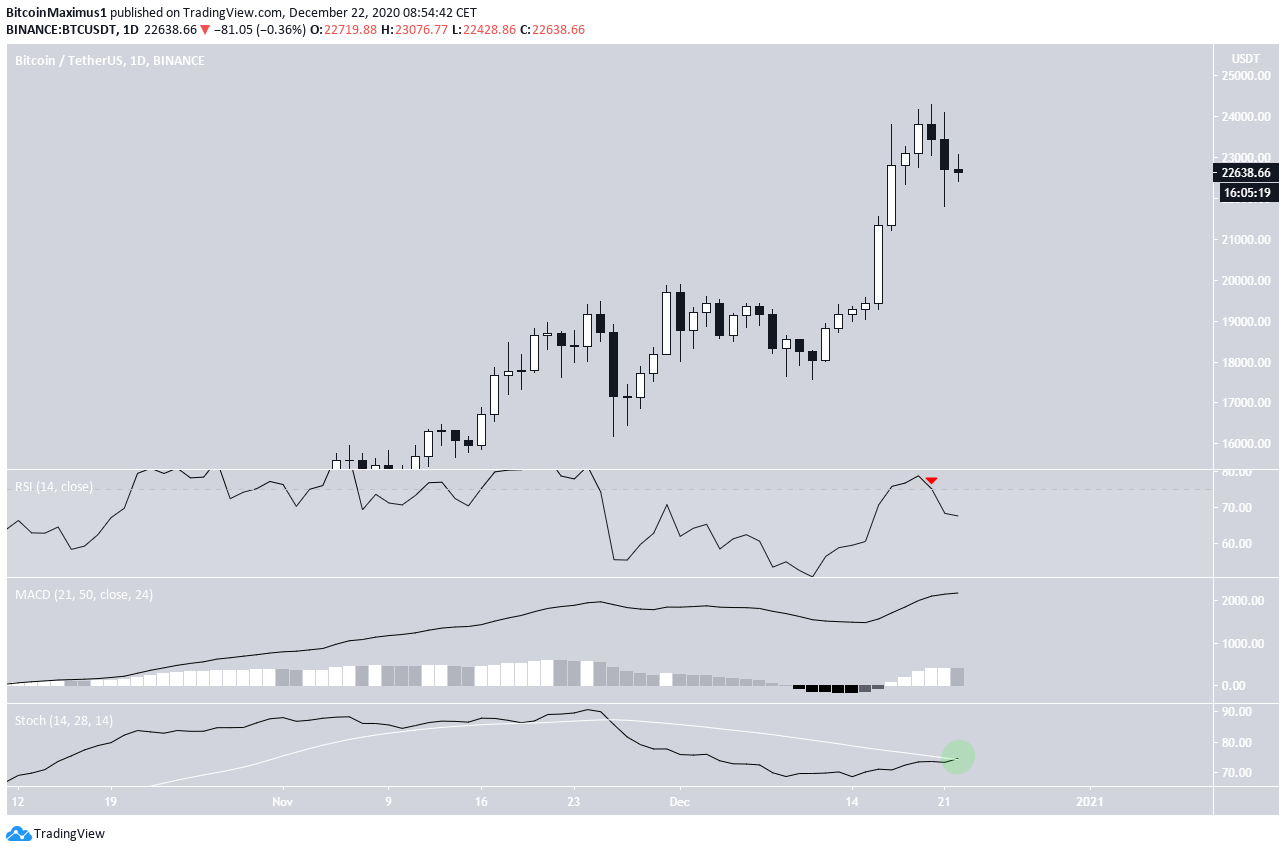
Yesterday, the BTC price decreased considerably from its high of $24,102 and proceeded to reach a low of $21,815. The candlestick for BTC has long wicks on each side, a sign of indecision stemming from both buying and selling pressure.
The movements of related technical indicators are also ambiguous. The RSI has just fallen below 70 (shown with the red arrow below), a sign of a potential trend reversal.
However, the MACD has yet to make a lower momentum bar and the Stochastic oscillator is in the process of making a bullish cross.
Reversal Potential
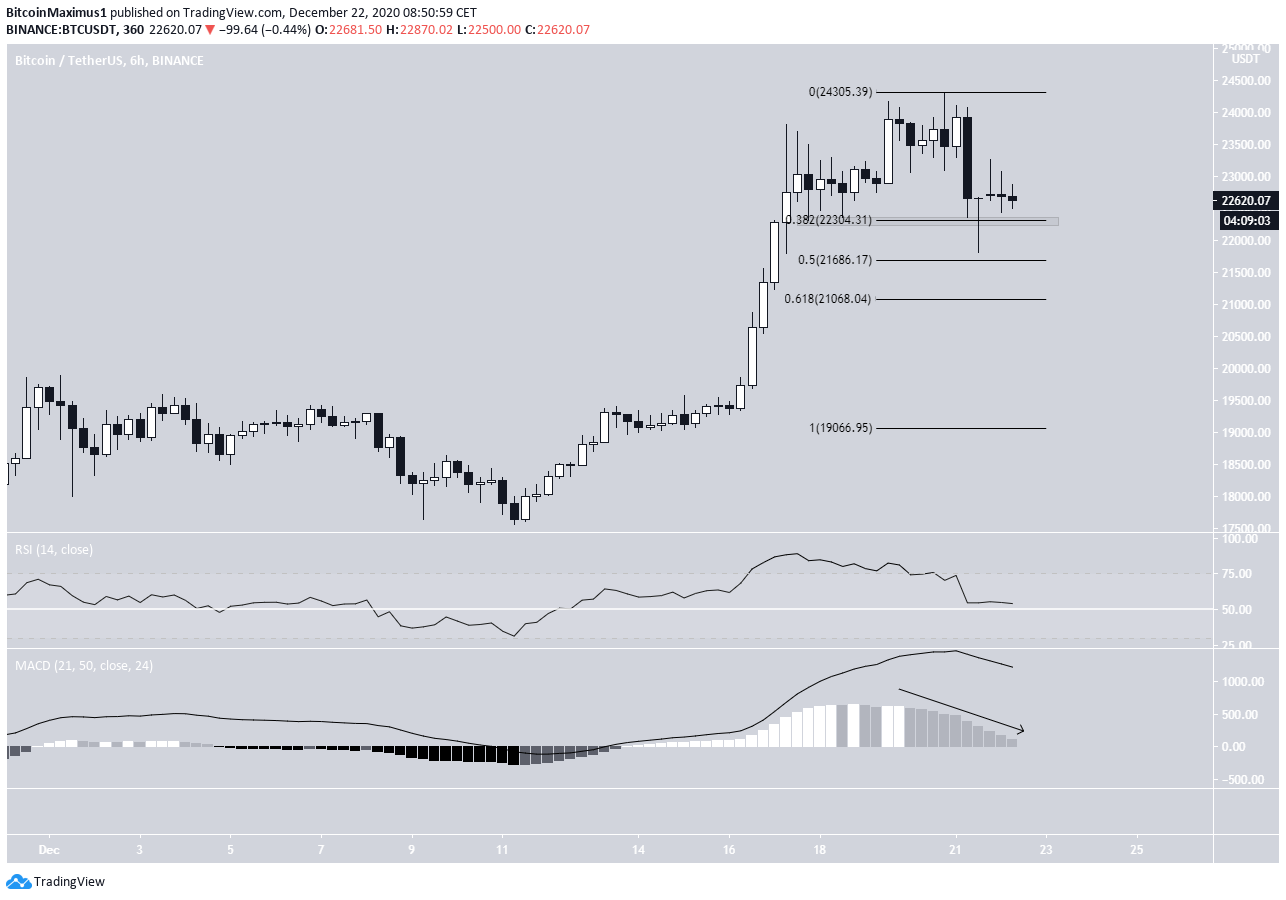
The six-hour chart shows that despite a drop below it, BTC has managed to hold above the minor $22,300 support area. This is also the 0.382 Fib retracement level of the most recent increase.
BTC created a long lower wick below this level, nearly touching the 0.5 Fib retracement at $21,686, but proceeded to reach a close above.
The MACD has lost its strength and the RSI is decreasing, but the latter is still above 50 and the former is above 0.
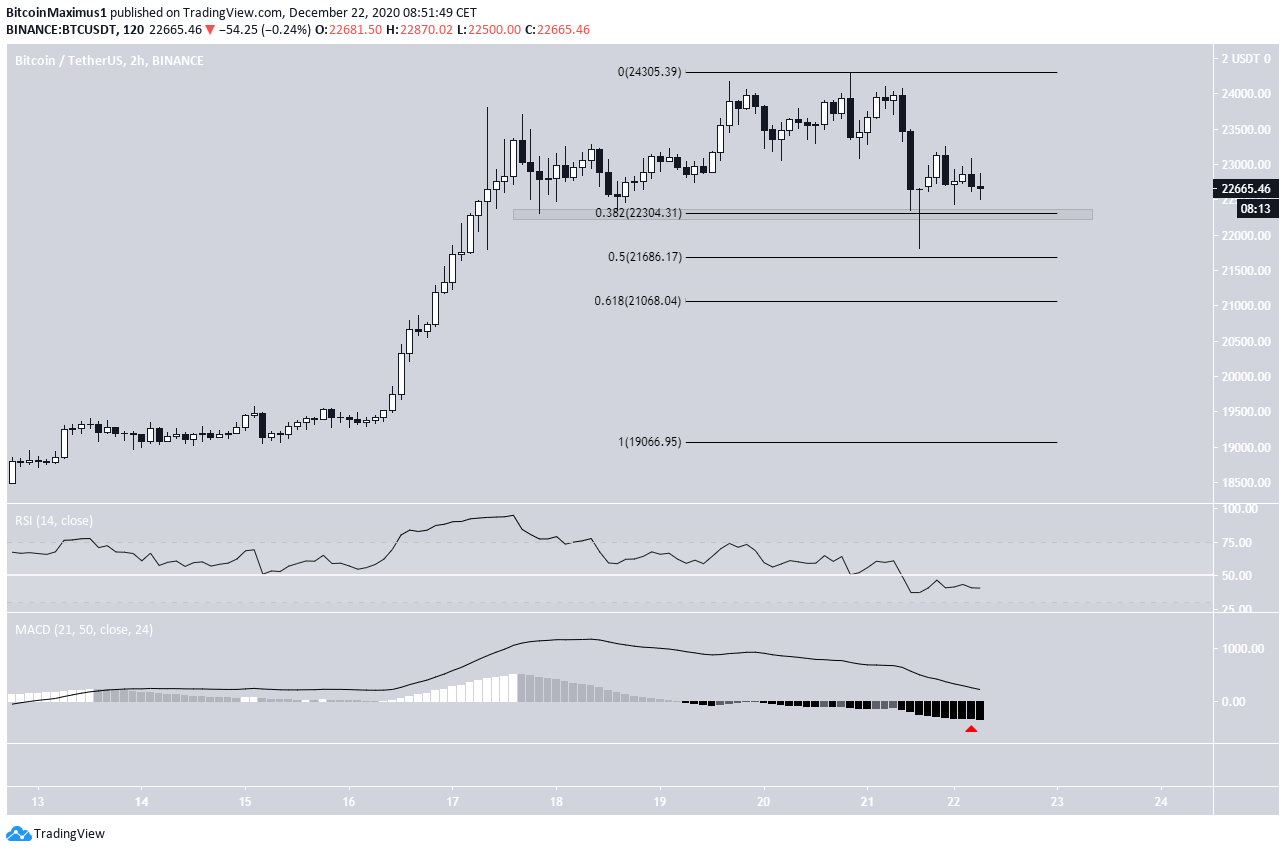
The two-hour chart also gives a relatively neutral view.
The RSI has decreased below 50 and has not generated any bullish divergence and the MACD is consistently moving downwards.
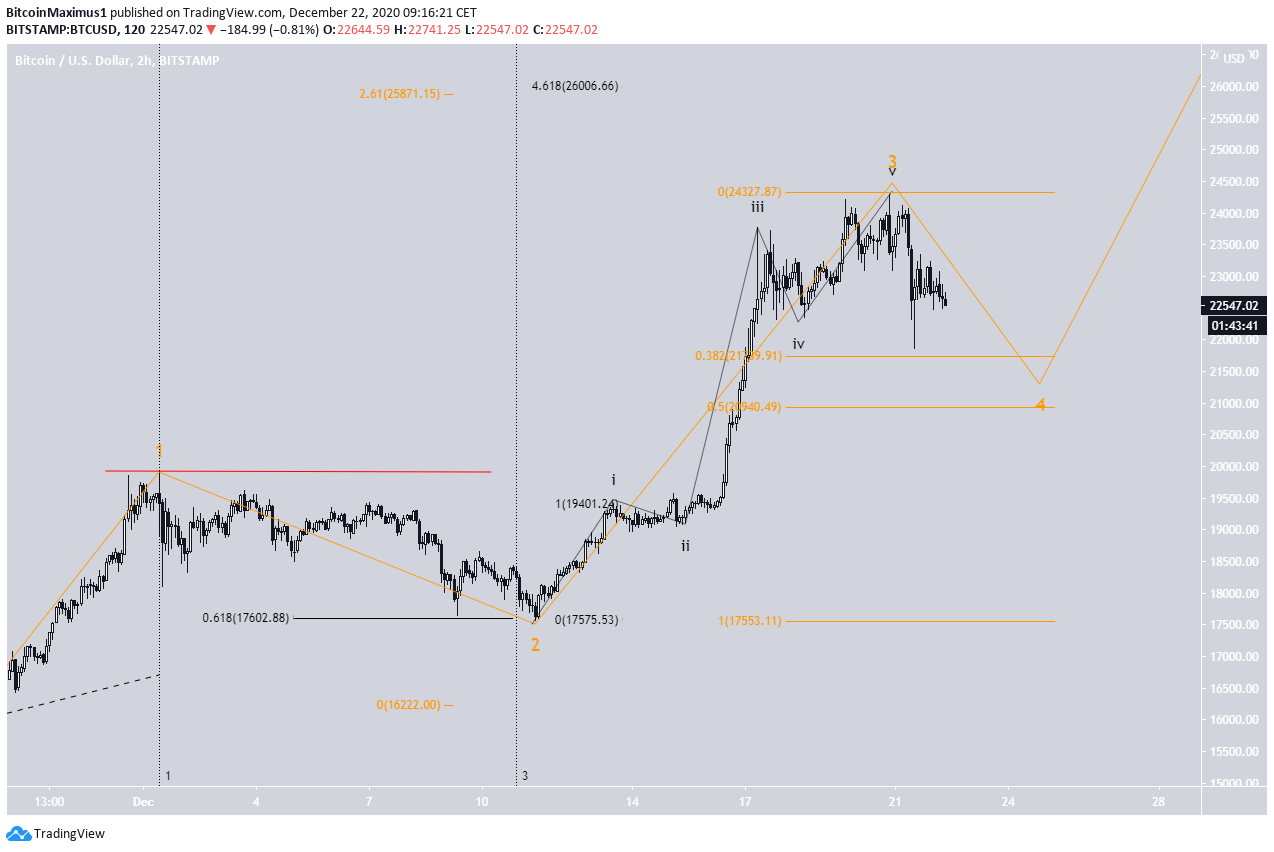
BTC Wave Count
The most likely count suggests that BTC is in sub-wave 5 (black) of wave 3 (orange), which is expected to end between $25,871 and $26,006.
Considering this scenario, yesterday’s decrease looks very much like a fourth wave pullback, after which an upward move to complete sub-wave 5 is expected.
A decrease below yesterday’s low of $21,864 would likely cause a breakdown from the parallel channel and invalidate this scenario.
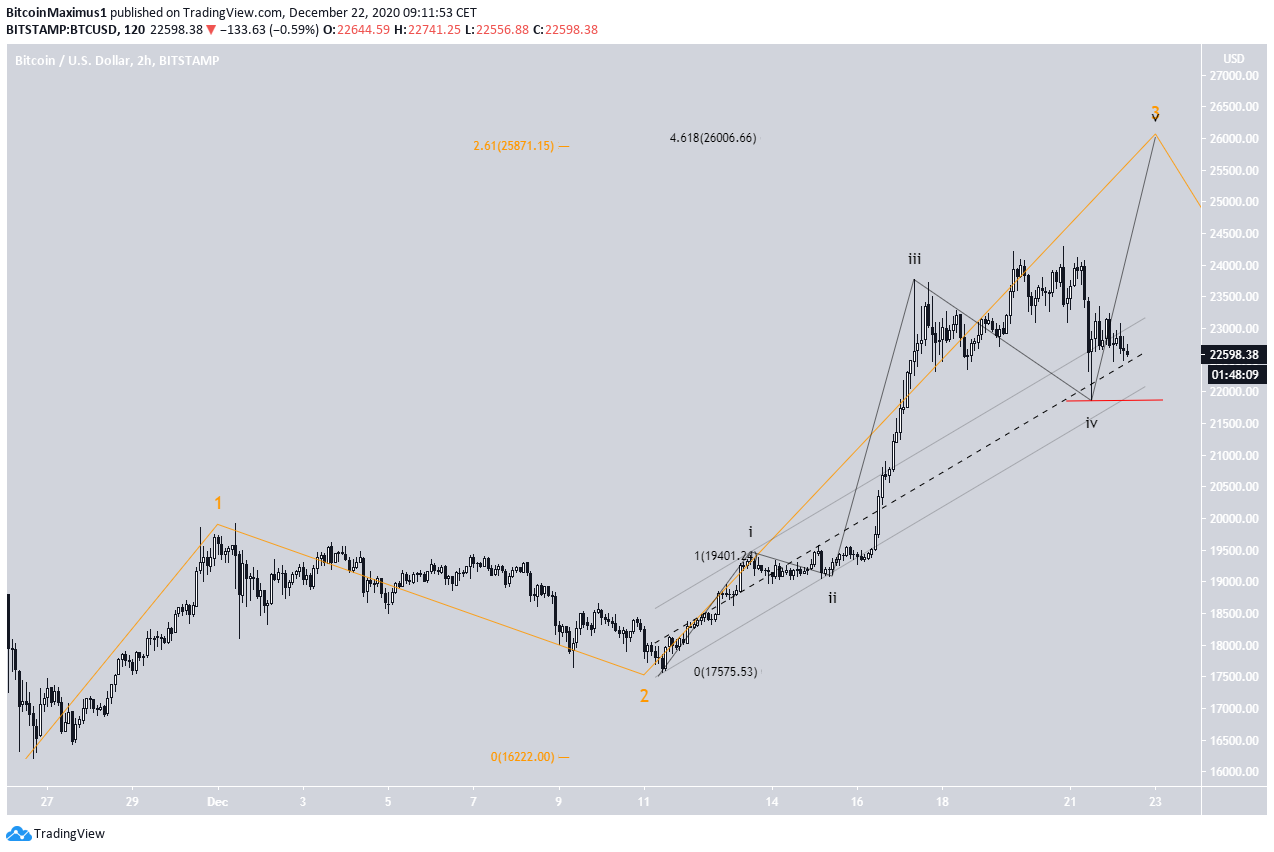
The alternate count suggests that wave 3 has been completed and that BTC is now correcting inside wave 4. Even in this case, we would expect wave 4 to be shallow and swift due to the principle of alternation.
Since wave 2 was long, taking more than twice the amount of time of wave 1, and retraced all the way back to the 0.618 Fib retracement level, we would expect wave 4 to return to $20,940 (the 0.5 Fib retracement level).
A decrease below $19,918 (red line) would invalidate this particular wave count.
Which One Is More Likely?
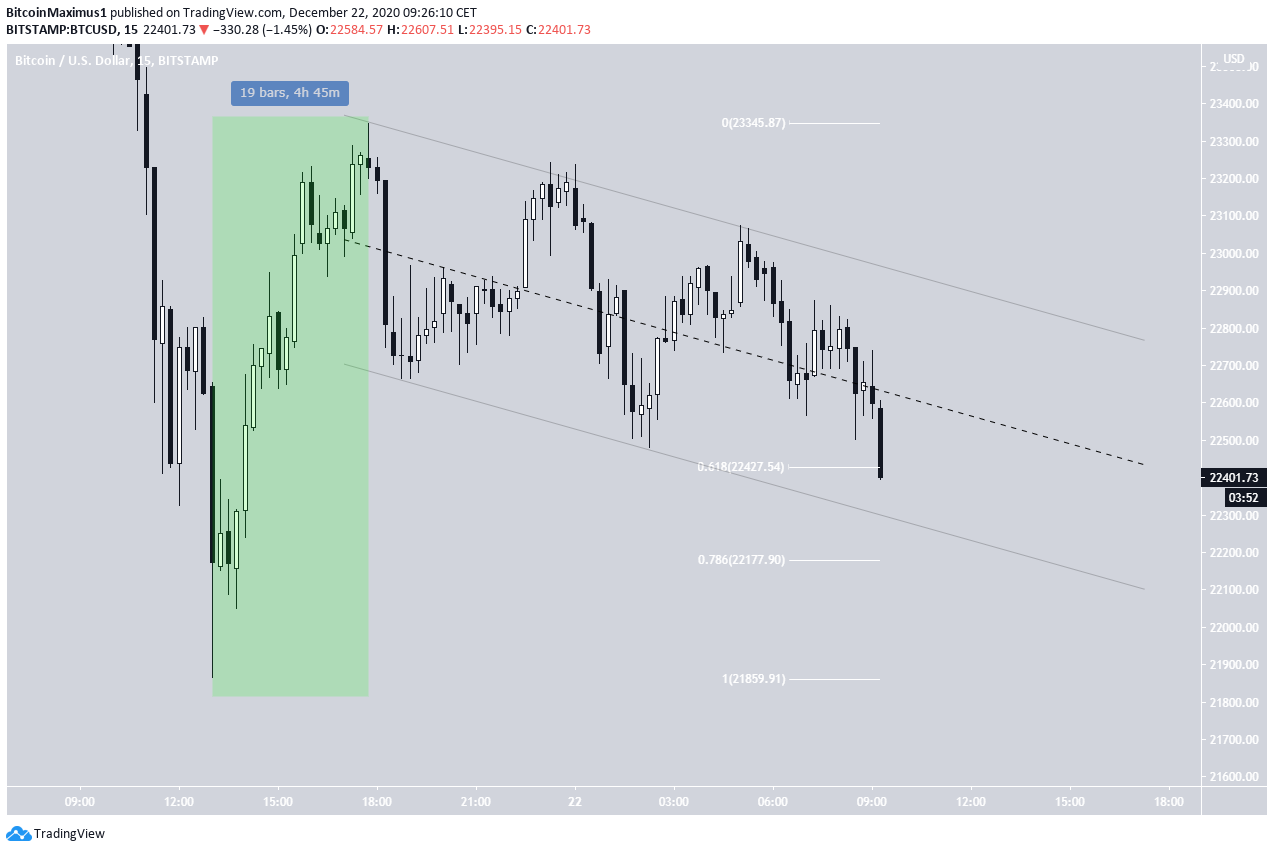
A look 30-minute time-frame supports the possibility that BTC is in sub-wave 4 and will soon reverse its bearish trend.
The reason for this is that the increase from yesterday’s lows (highlighted in green) looks impulsive, while the ensuing drop looks corrective.
As long as BTC does not break down from the channel, it is expected to move upwards and gradually head towards the targets near $26,000.
 Conclusion
Bitcoin is expected to soon reverse its trend and begin moving upwards. A decrease below $21,900 would postpone this possibility, suggesting that BTC is decreasing towards $21,000 before eventually moving higher.
For BeInCrypto’s previous Bitcoin (BTC) analysis, click here!
Disclaimer: Cryptocurrency trading carries a high level of risk and may not be suitable for all investors. The views expressed in this article do not reflect those of BeInCrypto.


