


The bitcoin (BTC) price decreased considerably on April 7 but bounced once it reached the $55,500 support area.
BTC is expected to break out from the current trading pattern and attempt to move above the $59,500 resistance area.
BTC Bounces At Support
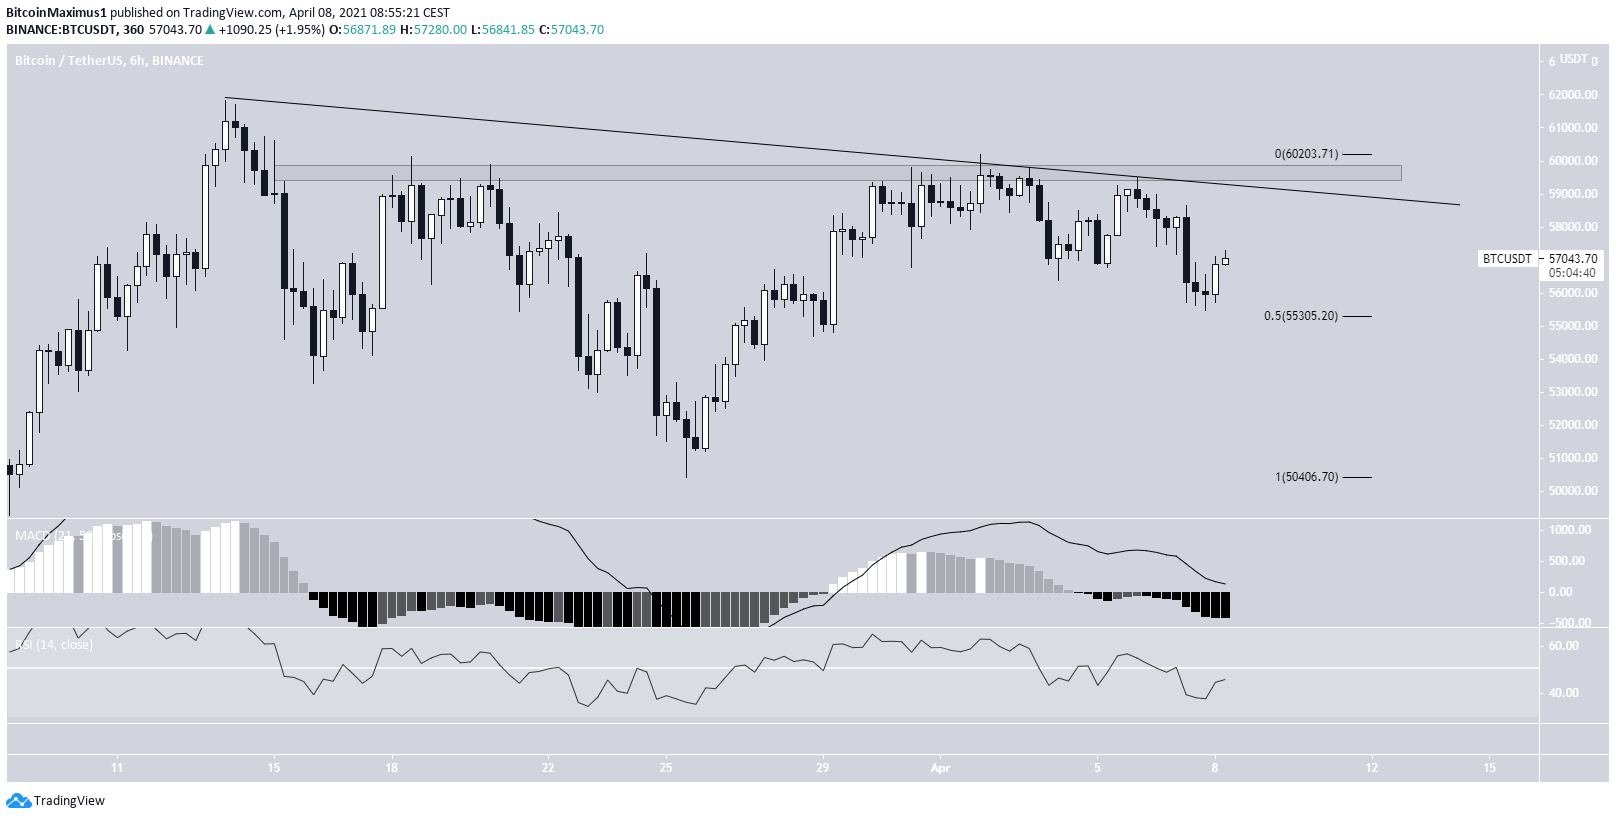
Bitcoin has been moving downwards since reaching an all-time high of $61,884 on March 13.
Throughout the decrease, it’s been following a descending resistance line, which so far has rejected BTC three times.
On April 6, BTC was rejected by the line for the third time and began to move downwards. It concluded this move when it reached a local low of $55,473, just above the 0.5 Fib retracement support level.
Despite the bounce, technical indicators do not confirm a bullish reversal.
The main resistance area is found at $59,500, just above this ascending resistance line.
We need to take a look at the shorter-term movement in order to determine if BTC could break out.
Short-Term Movement
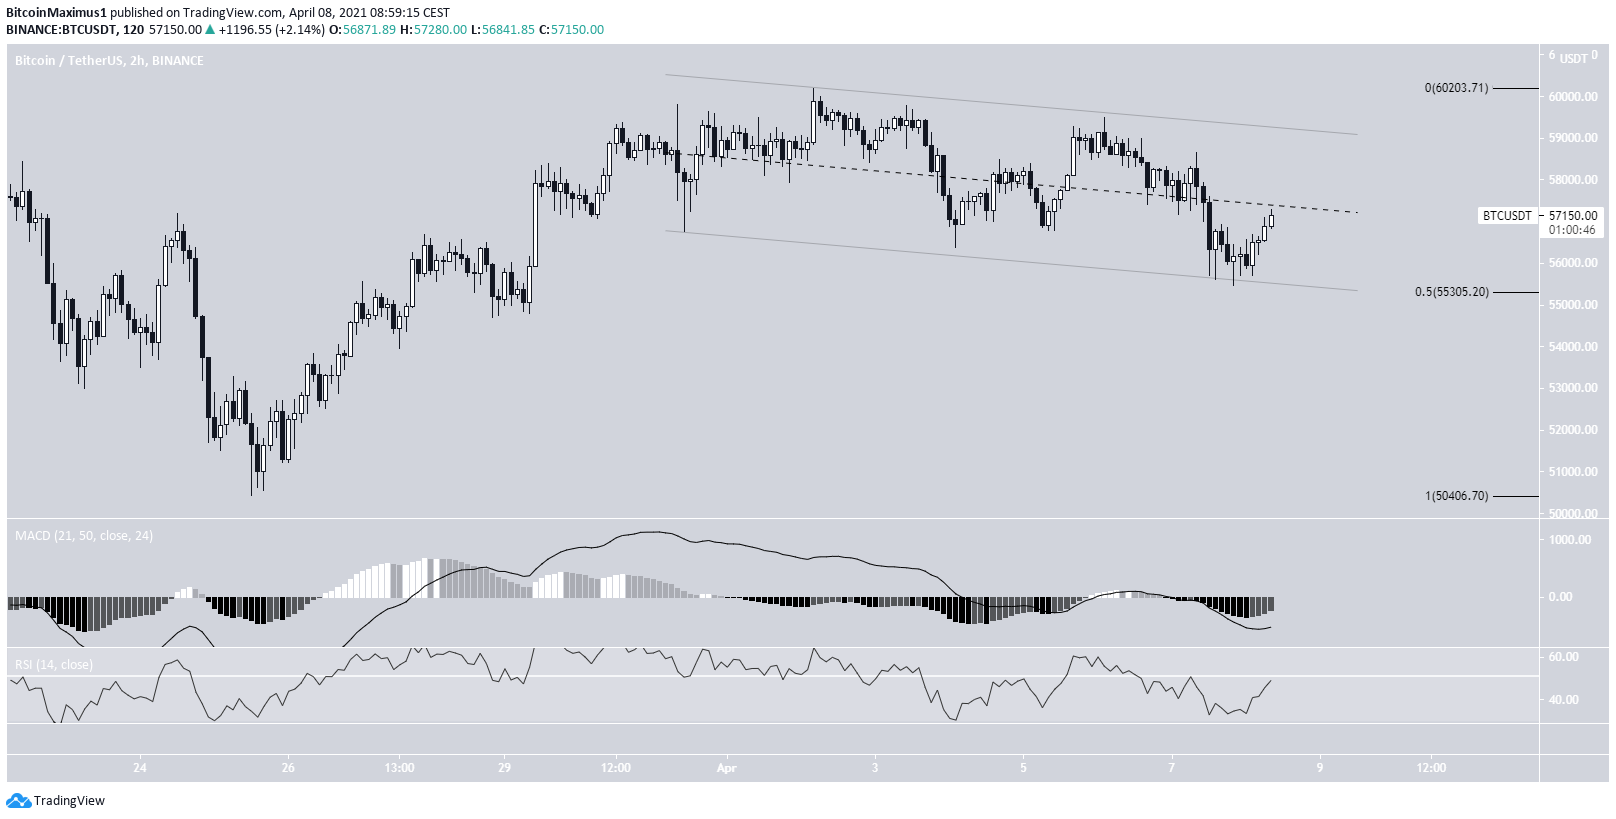
The two-hour chart shows that BTC is trading inside a descending parallel channel. This is often a corrective movement that leads to a breakout in the other direction.
Furthermore, this possibility is supported by technical indicators. The MACD is already showing a bullish reversal signal and is moving upwards.
Therefore, BTC is expected to break out from the channel.
Wave Count For BTC
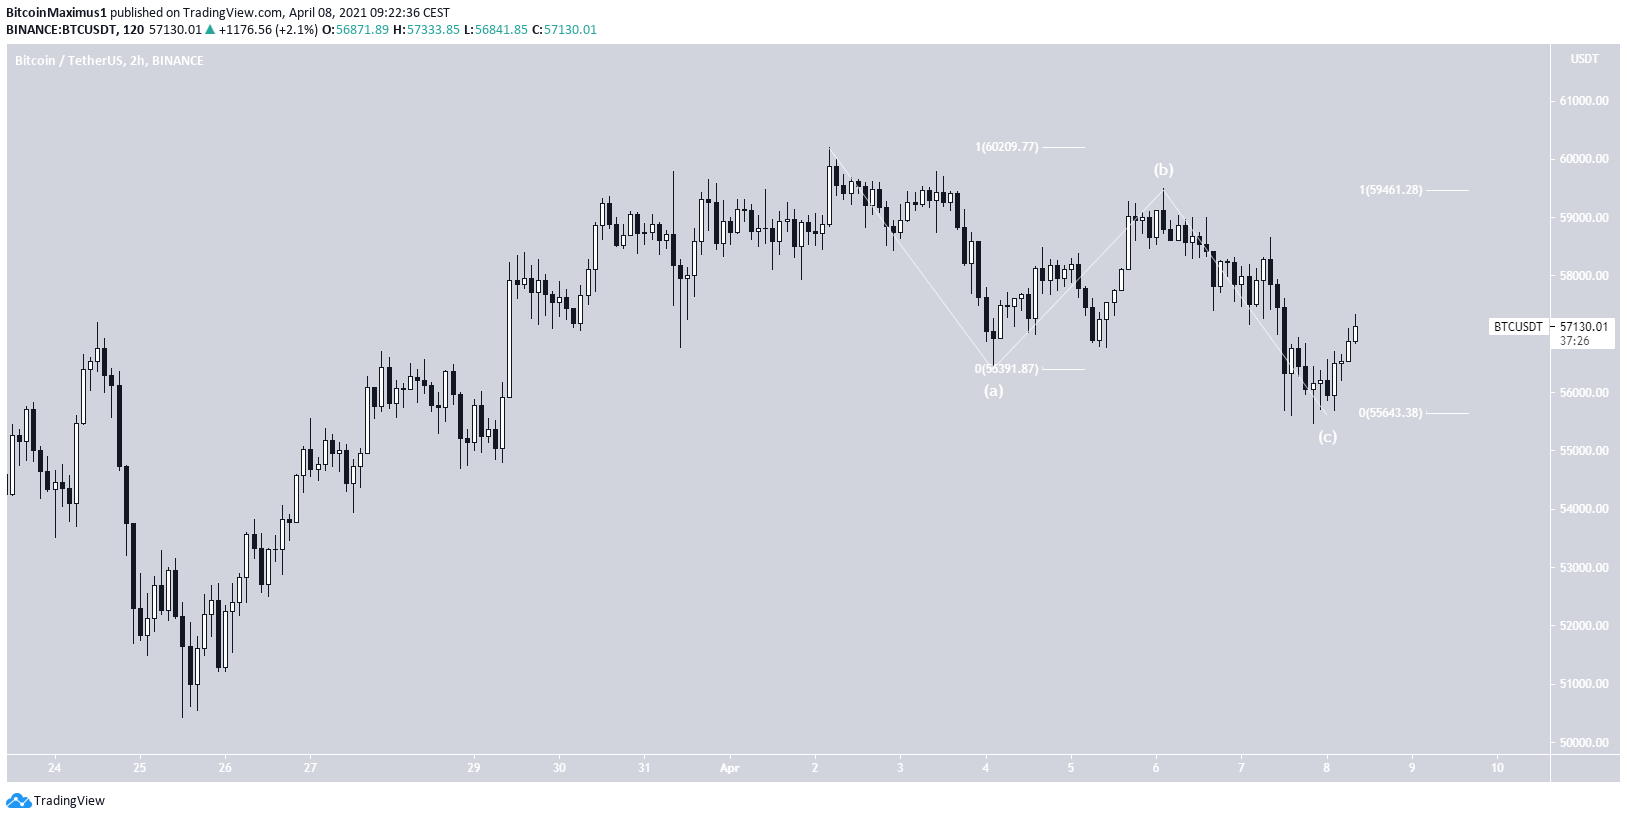
The ongoing decrease looks to be an A-B-C corrective structure, in which waves A:C have a 1:1 ratio.
This is very common in such corrections.
It further supports the possibility that the correction is now complete and the price will break out from the channel. A new all-time high is expected in the near future.
For the longer-term wave count, click here.
Conclusion
BTC is expected to break out from the descending channel that it’s currently trading in. Afterwards, it could make an attempt at moving above the $59,500 resistance area.
For BeInCrypto’s previous bitcoin (BTC) analysis, click here.


