


Bitcoin (BTC) is holding on above a horizontal and diagonal support area, a breakdown from which could trigger a very sharp downward movement.
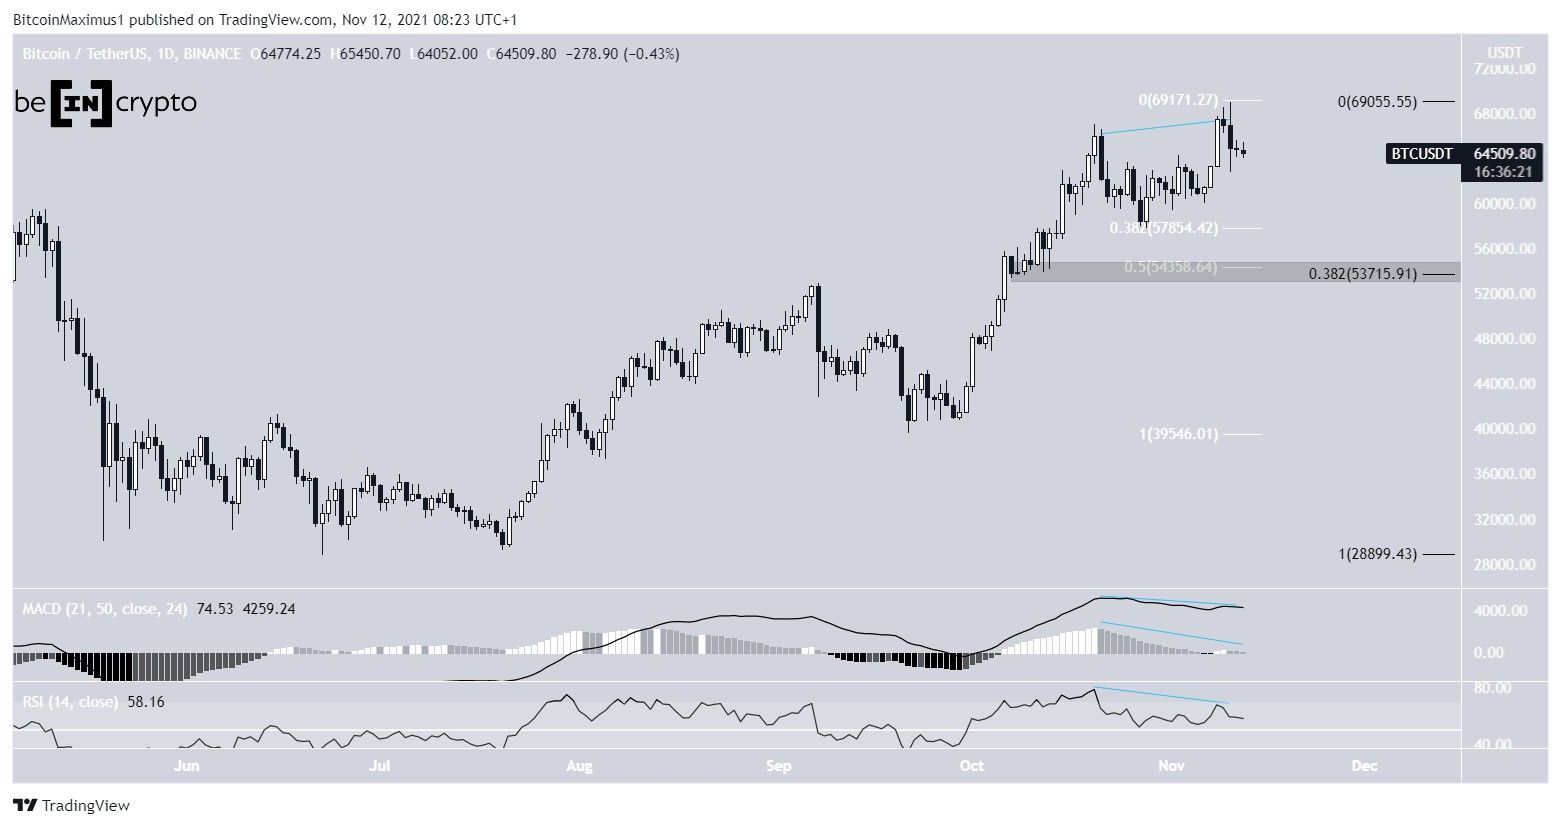
Bitcoin has been moving downwards since Nov 10, when it reached a new all-time high price of $69,000. So far, it has reached a local low of $62,822 on the same day.
Prior to the decrease, technical indicators showed considerable weakness in the form of bearish divergences in both the RSI and the MACD (blue lines). This means that the price increase was not accompanied by an increase in momentum. This often precedes trend reversals.
If BTC were to continue falling, the closest minor support level would be found at $57,750. This is the 0.382 short-term Fib retracement support level (white).
The closest major support area is between $53,700-$54,350. This target range is the short-term 0.5 Fib retracement support level and the long-term 0.382 Fib retracement support level (black).
Short-term support
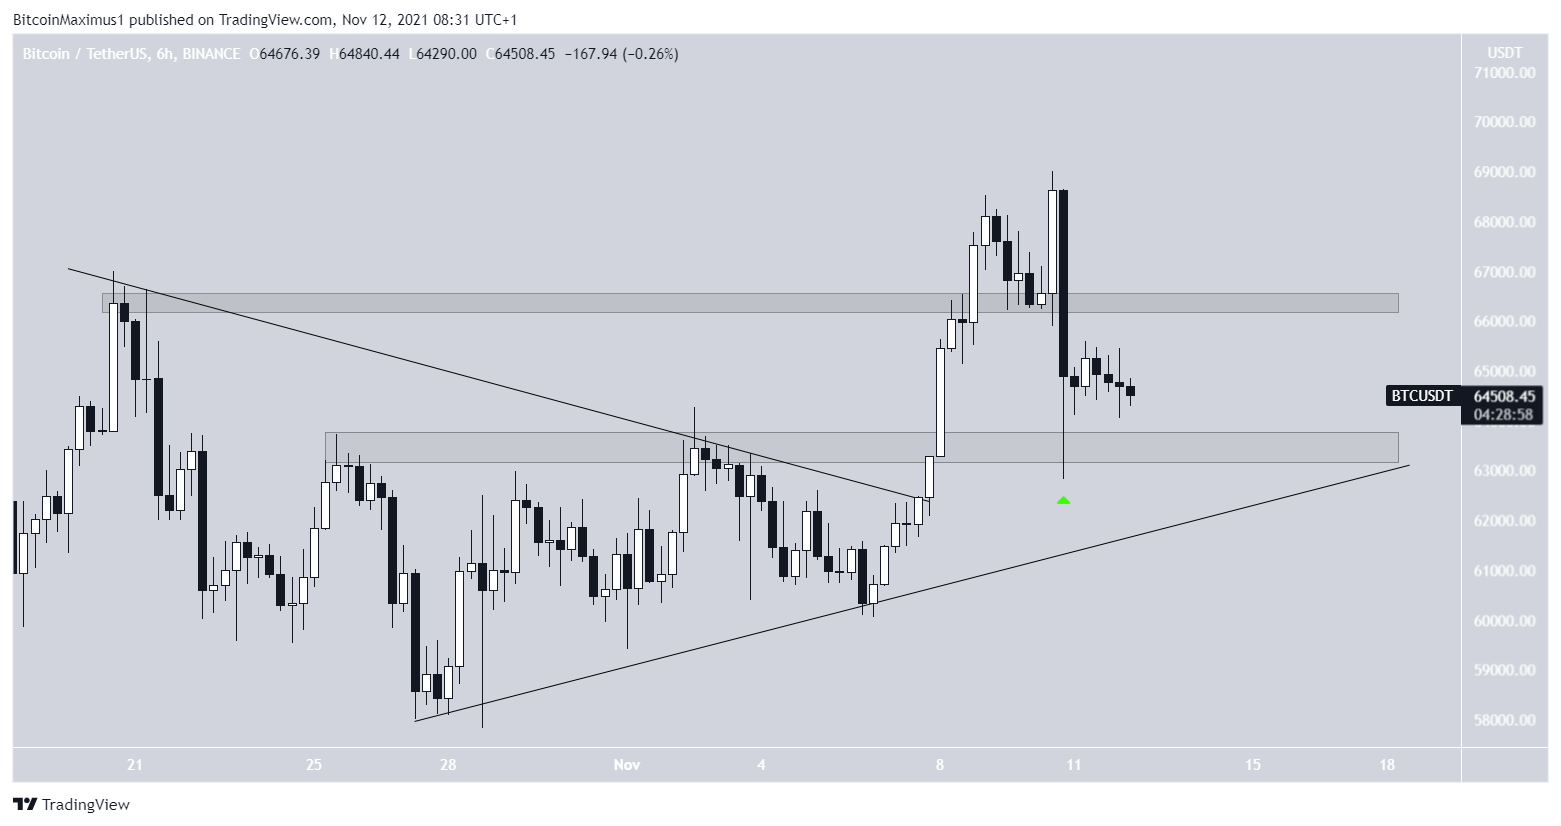
The six-hour chart shows that BTC broke out from a symmetrical triangle prior to reaching its aforementioned all-time high. However, it also created a bearish engulfing candlestick shortly after. This is a bearish candlestick in which the previous increase is completely negated by a larger drop. It also supports the possibility that BTC will continue falling.
Currently, BTC is trading just above the $63,500 horizontal support area, where it rebounded from on Nov 10 (green icon). The area also coincides with the ascending support line from the triangle and is a very strong support area.
A breakdown below it could be the catalyst for a sharp fall. The wave count also supports the possibility that BTC will continue decreasing.
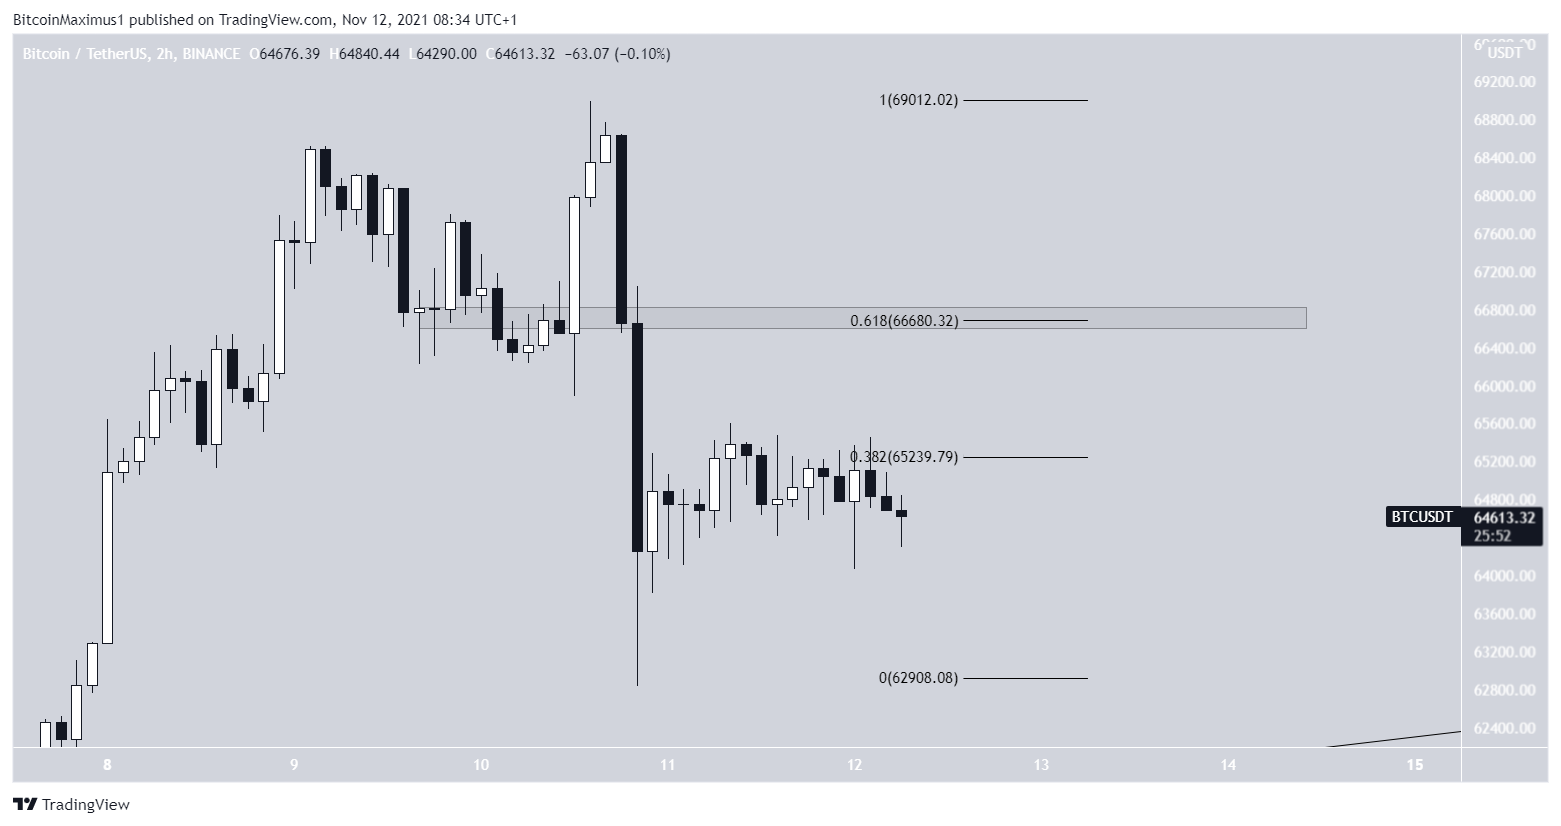
In the short term, BTC has been rejected by the 0.382 Fib retracement resistance level at $65,240. If the short-term upward move were to continue, there would likely be strong resistance at $66,680.
However, since the immediate BTC trend seems to be bearish, it does not seem likely that the price will break out above this level.
For BeInCrypto’s previous Bitcoin (BTC) analysis, click here.


