


Bitcoin (BTC) managed to reach a high of $50,500 on Aug 23. However, it failed to sustain the upward move and created a long upper wick.
While BTC is increasing alongside an ascending support line, it’s also showing considerable weakness. A breakdown from this line could be the catalyst for a sharp downward move.
Bitcoin approaches resistance
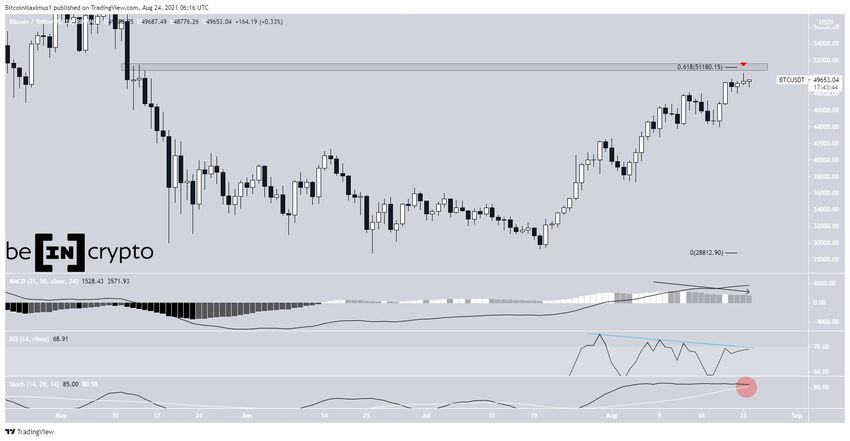
On Aug 23, BTC reached a high of $50,500. This was very close to the 0.618 Fib retracement resistance level and the $51,200 horizontal resistance area.
BTC created a long upper wick and a potential shooting star candlestick. Today’s close is crucial, since it can either confirm or reject the potential reversal from the shooting star.
Technical indicators are showing weakness. The MACD and RSI have created bearish divergences, and the former is giving a bearish reversal signal. The Stochastic oscillator is also very close to making a bearish cross.
Future movement
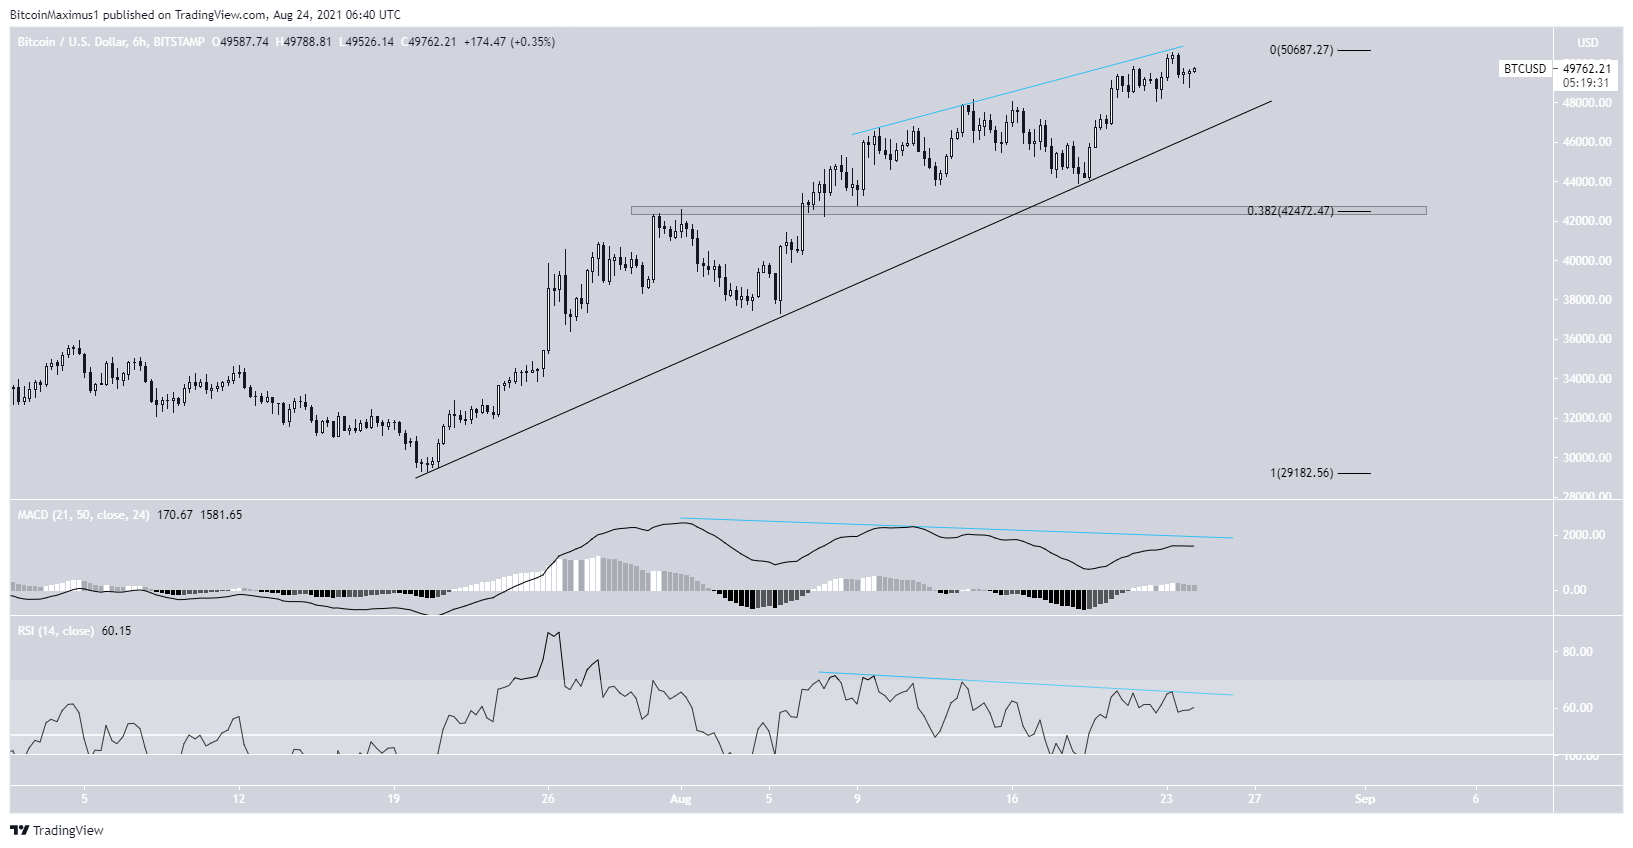
The six-hour chart provides a similar outlook. Both the RSI and MACD have generated bearish divergences — signs of a potential reversal.
However, BTC is still following an ascending support line. As long as it remains above this the support, the upward trend remains intact.
However, a breakdown from the line could be the catalyst for a sharp downward move. In that case, the closest support area would be found at $42,500. This target is the 0.382 Fib retracement support area and a horizontal support level.
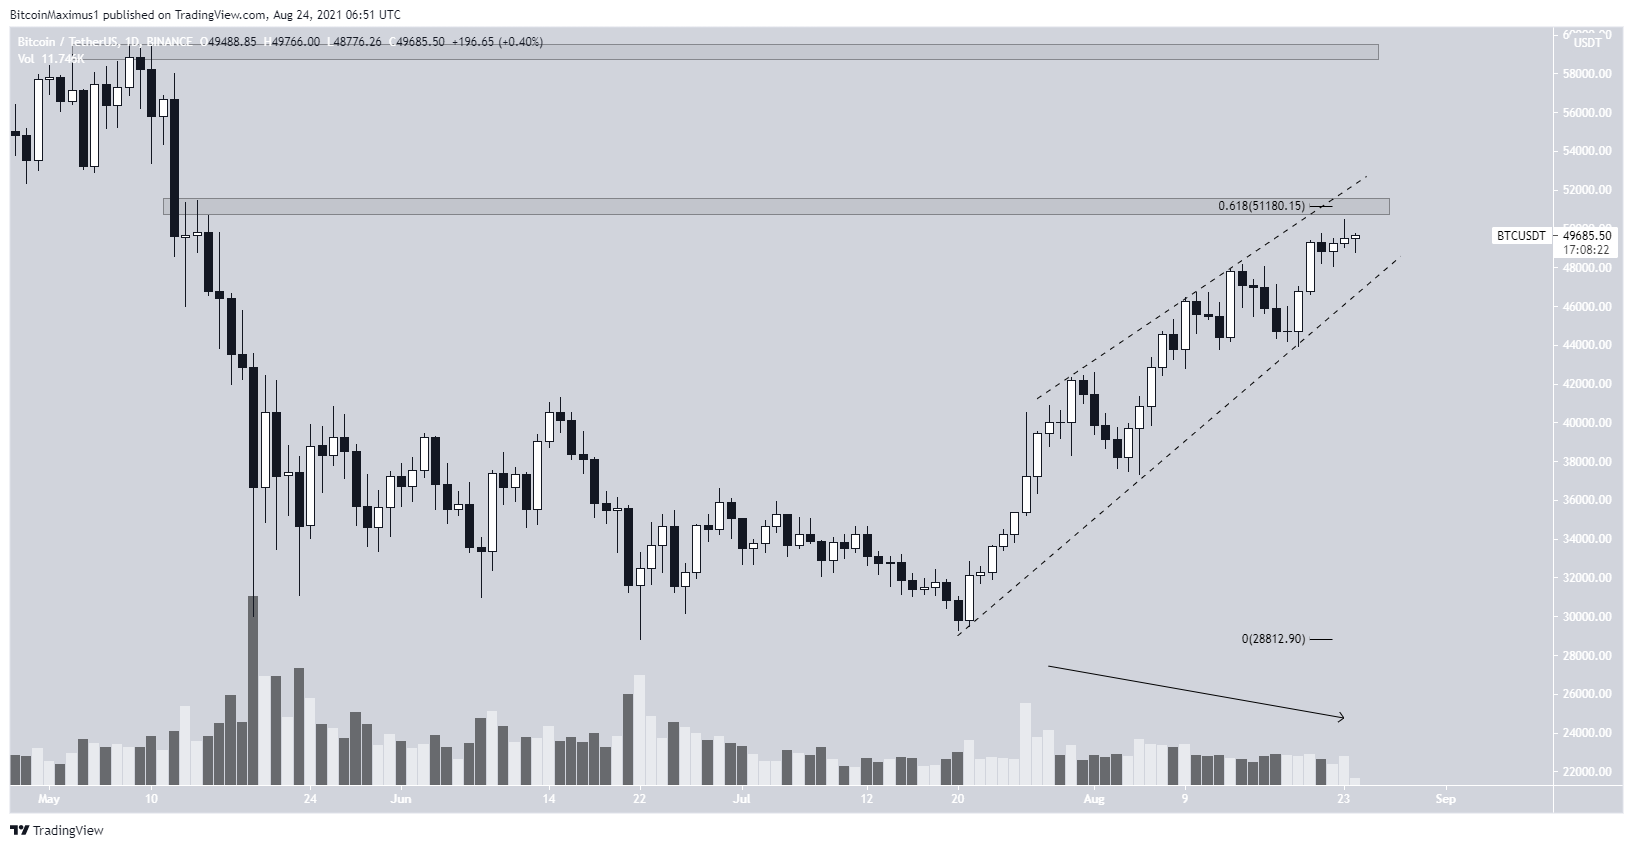
Conversely, a breakout above the $51,200 area could trigger a sharp increase toward $59,200. At the time of press, this seems unlikely.
On top of the decreasing volume, there is a potential wedge formation in place throughout the entire upward move. This is often considered a bearish pattern.
Therefore, there is significant resistance just above the current price. and the path of least resistance is down.
For BeInCrypto’s latest Bitcoin (BTC) analysis, click here.


