


Bitcoin (BTC) is trading around the $30,000 level. Last week between May 16 and 22, it generated its eighth consecutive bearish weekly candle. Such a situation has never happened before in the history of cryptocurrencies.
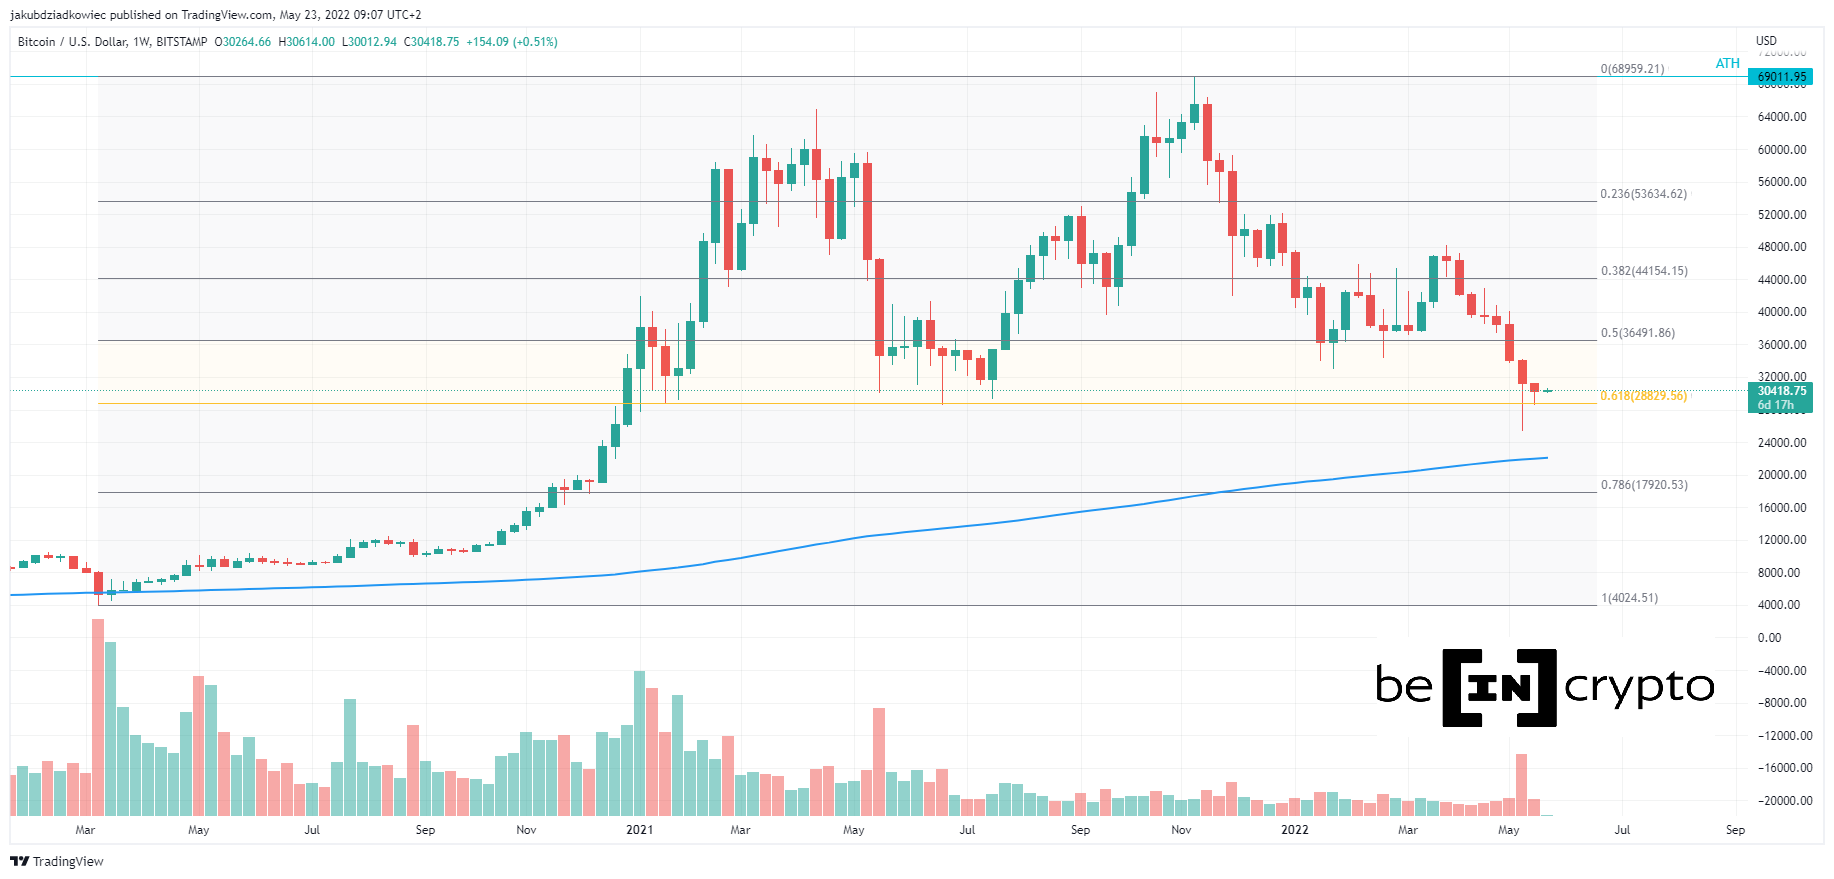
Since reaching a local peak at $48,234 on March 28, only red candles have appeared on bitcoin’s weekly chart. The price reached a low of $25,400 on May 12 and rebounded to its current level. This represents a decline of 47% at the extremes.
Along with hitting long-term support at $28,800, BTC has reached the 0.618 Fib retracement as measured from the COVID-19 crash in March 2020. If this level fails to hold as support, the next targets are the 200-week moving average (200W MA, blue line) at $22,000 and the 0.786 Fib retracement at $18,000.
Long-term technical indicators
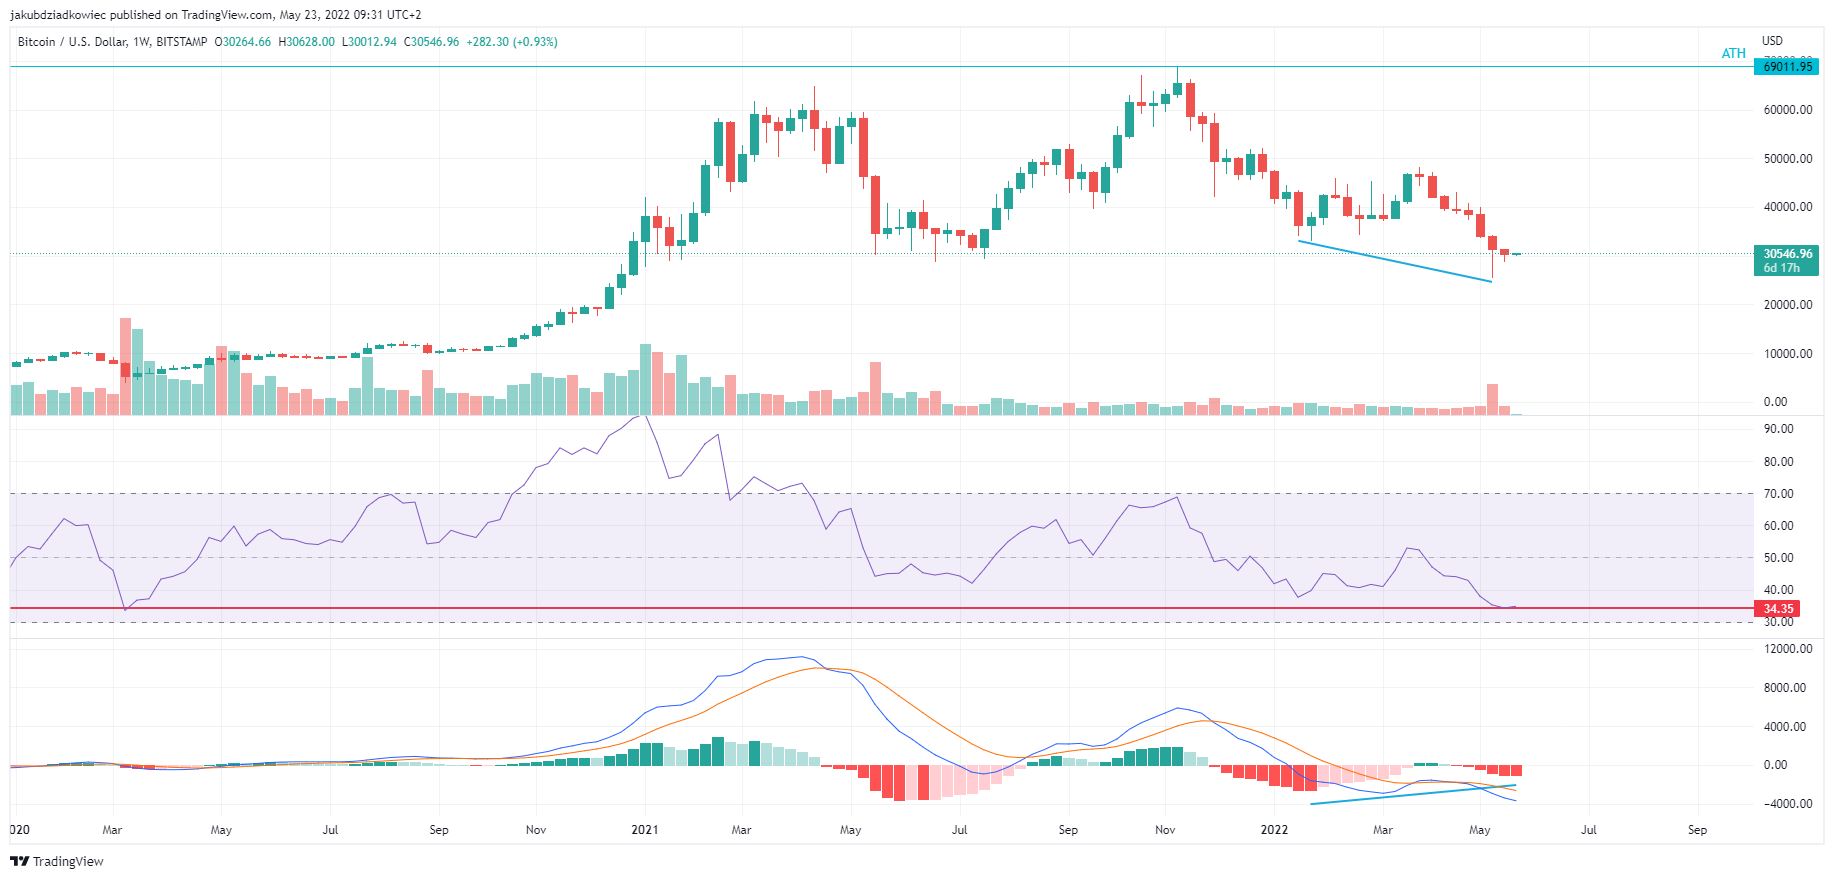
The technical indicators on the weekly chart are bearish. RSI is at the overbought zone of 34.50 (red line), which is comparable to the March 2020 level of 33.
MACD is in the process of generating a sixth red momentum bar. However, a bullish divergence is developing on it compared to the second half of Jan (blue lines). Then, bitcoin was looking for support near $36,500, the 0.5 Fib retracement level, and the MACD momentum was lower.
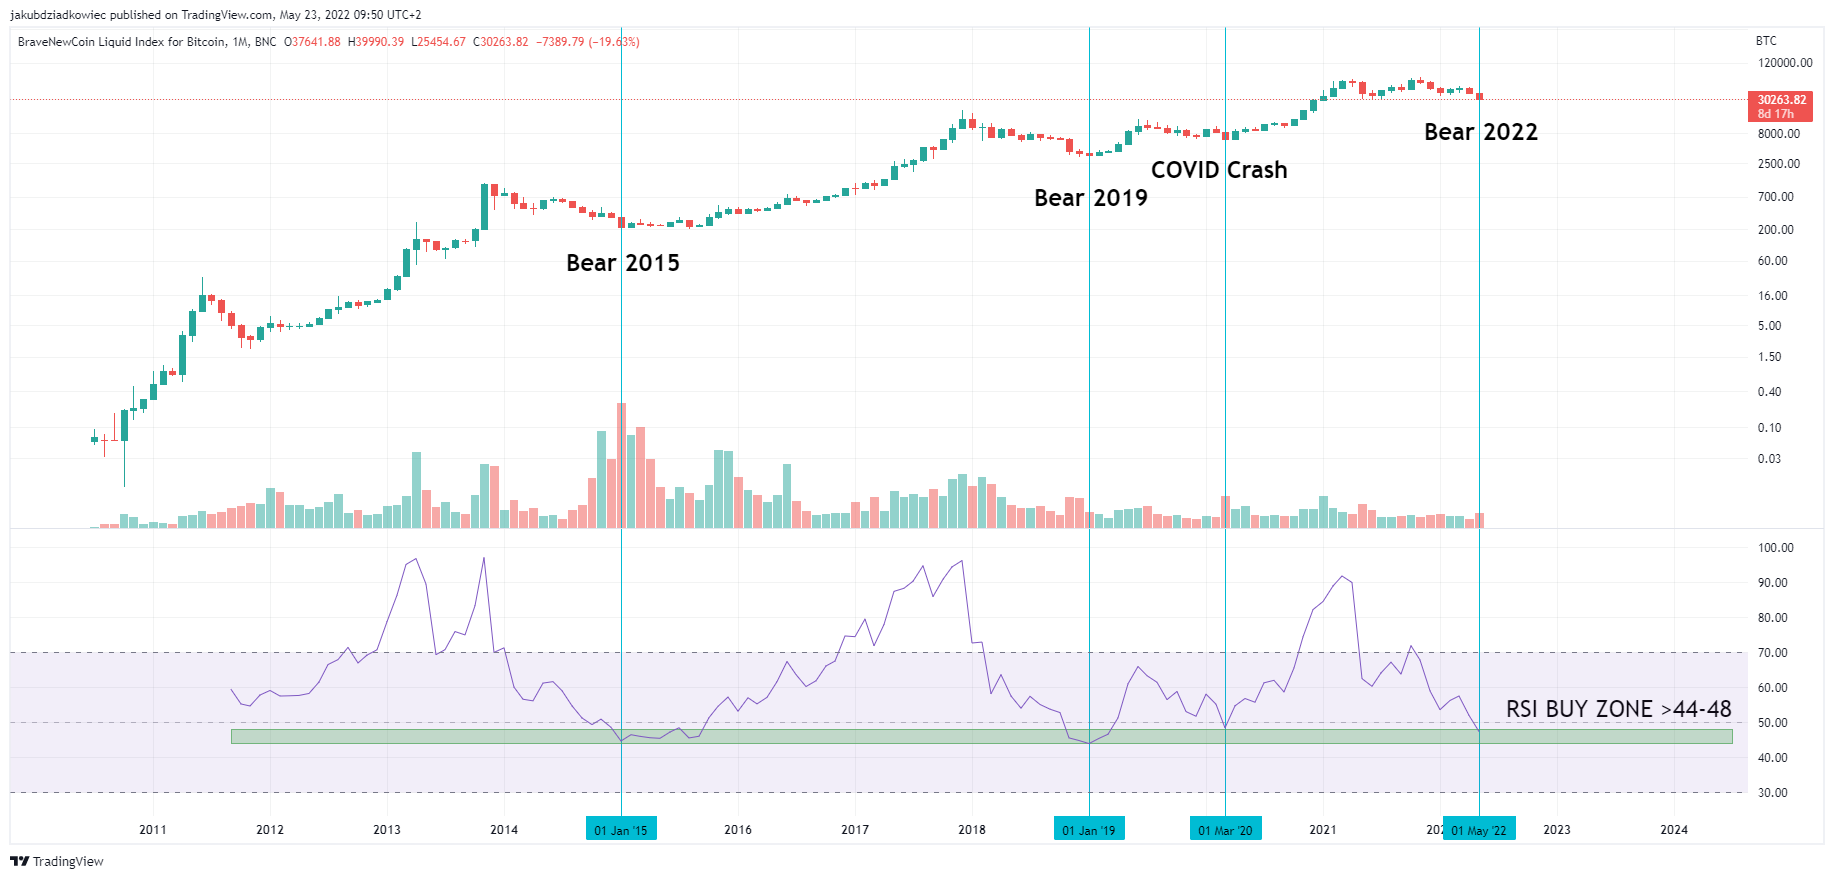
It is worth mentioning that the RSI on the monthly chart has reached a long-term buy zone in the 44-48 range (green rectangle). So far in bitcoin’s history, the monthly RSI has been there twice – in Jan 2015 and Jan 2019. In addition, it bounced off this area once in March 2020.
Currently, the monthly RSI is at 47.30 and is just entering the green area. In historical bear markets, this event was the start of accumulation near the absolute lows of the BTC price (blue vertical lines). If the pattern were to repeat itself, the market is in for multi-month accumulation and the BTC price bottom is near or has already been reached.
Bitcoin future movement
Cryptocurrency trader @nihkalowz tweeted a weekly chart of bitcoin, in which he used Heikin-Ashi candles. In his opinion, the structure of the BTC price since the beginning of 2021 follows a bullish megaphone pattern. Its shoulders are expanding over time, similar to the broadening wedge pattern.
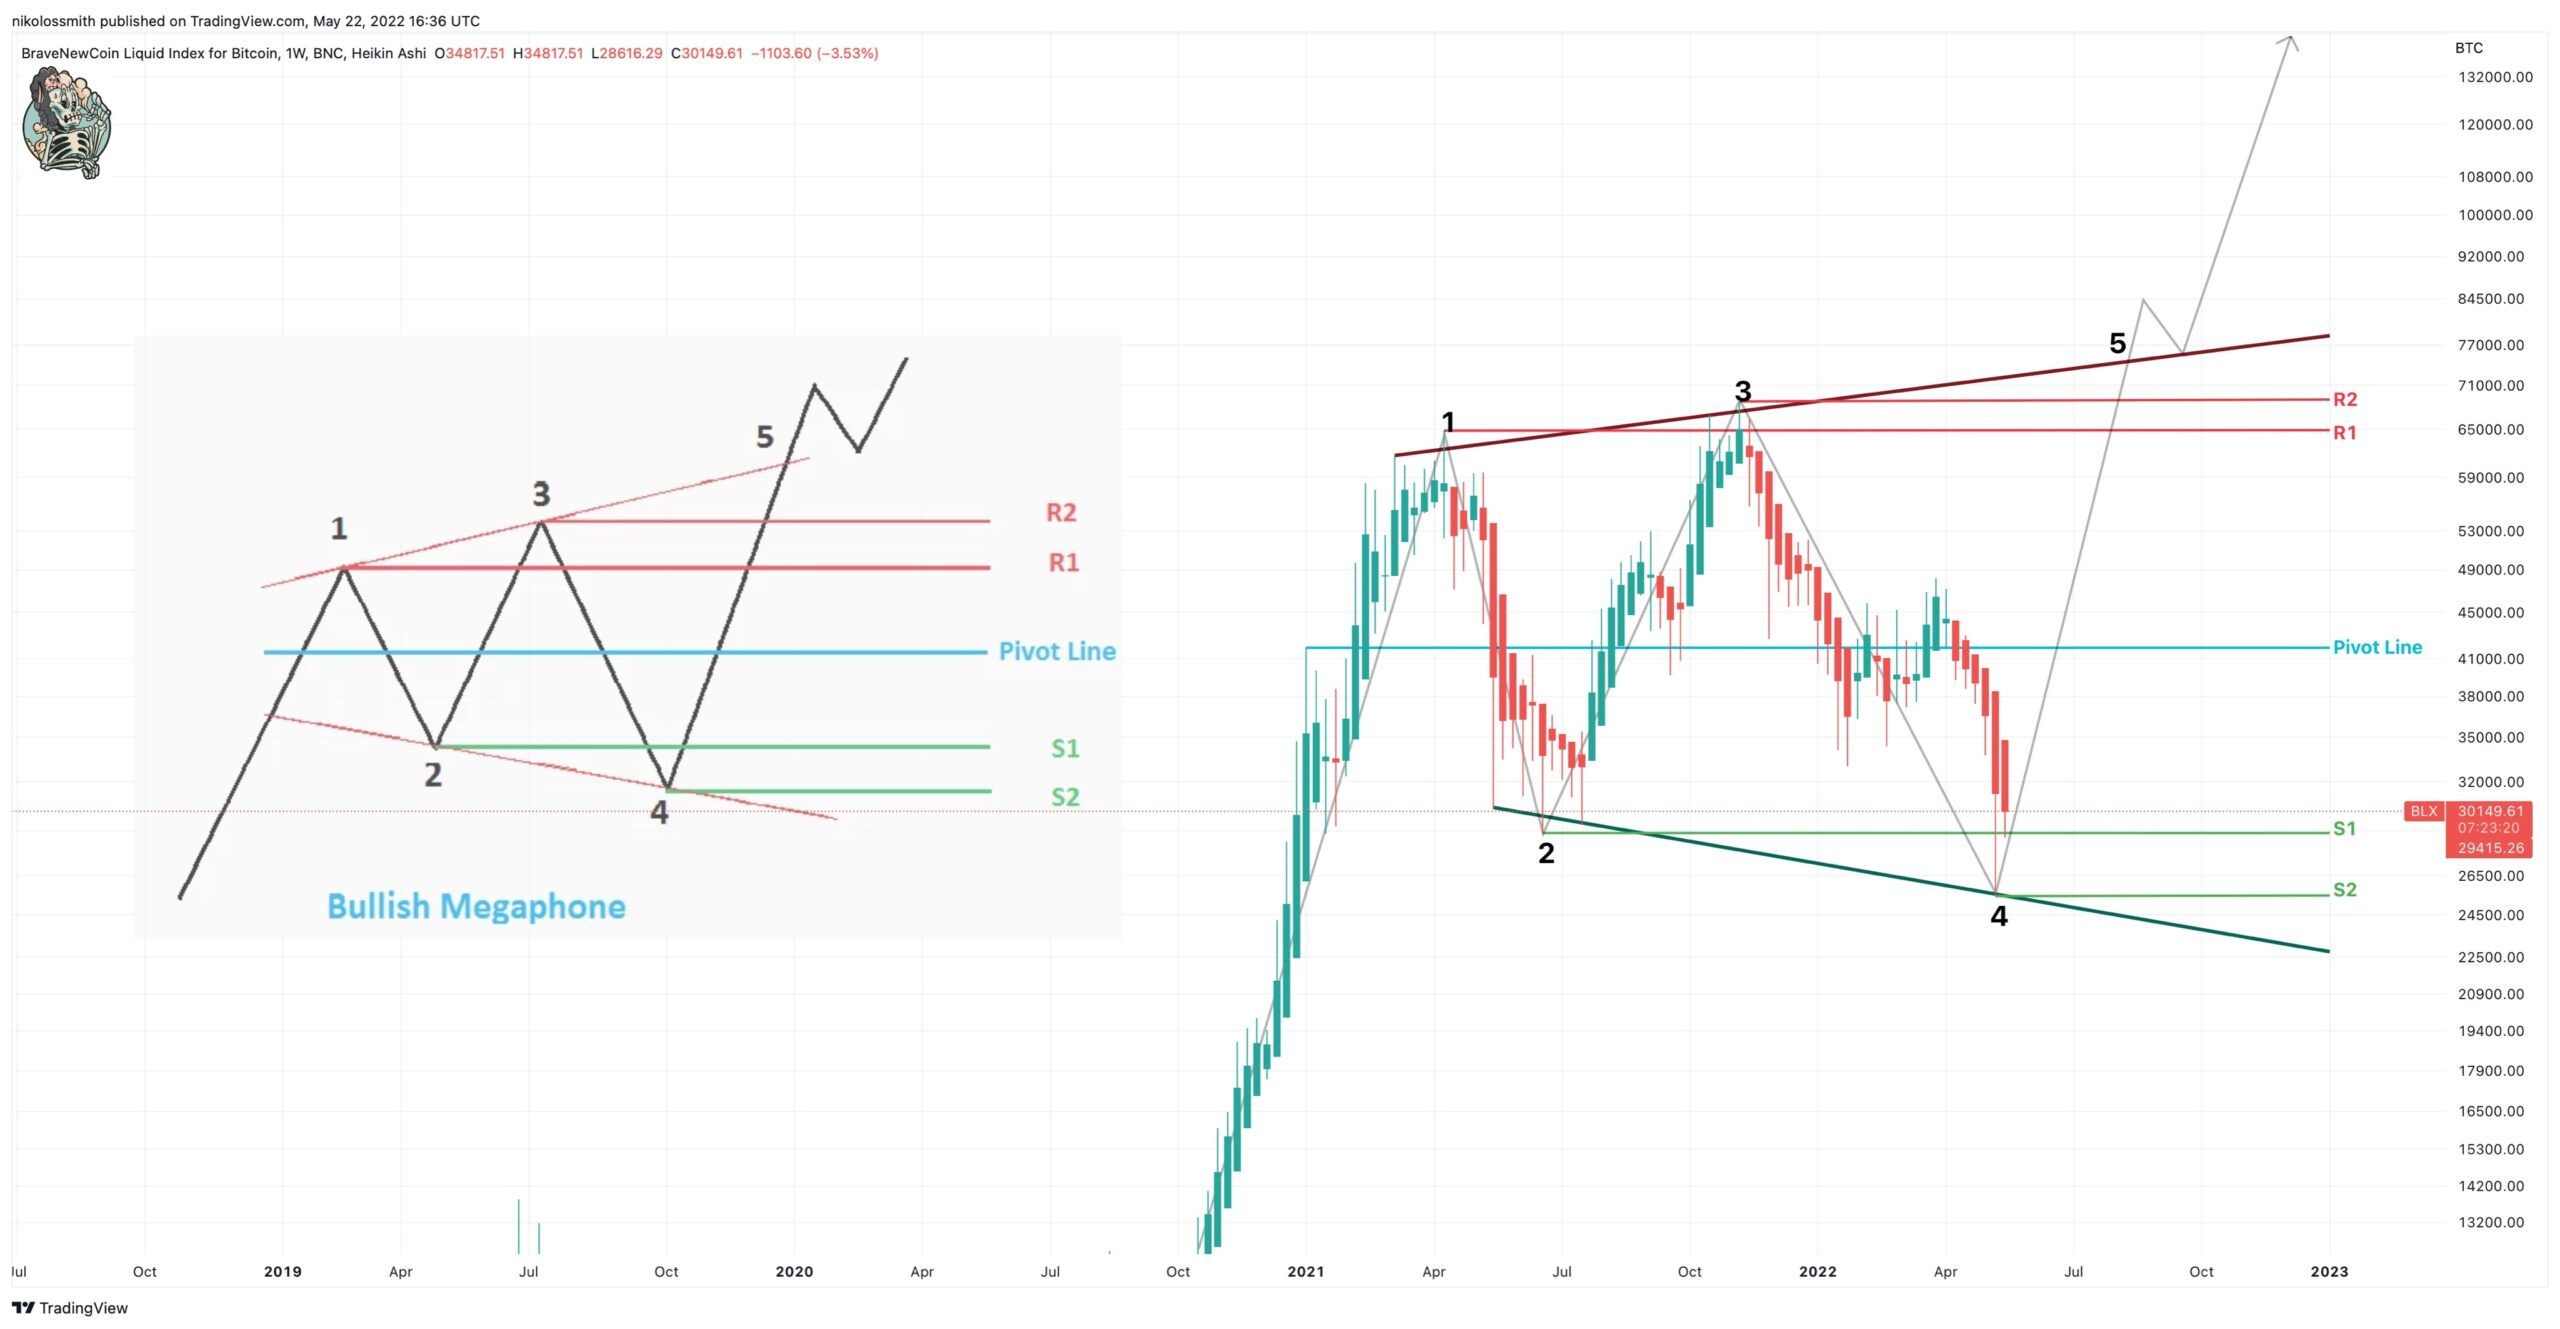
The trader marked two support levels for the bottom of the fourth wave, which he believes is nearing completion. The first one is around $28,500 and the second one is $25,000. If this scenario turns out to be correct, the next move of BTC would be towards the resistance from the historical all-time highs at the levels of $64,500 and $69,000. It is worth adding the importance of the pivot line at the $42,000 level (blue).
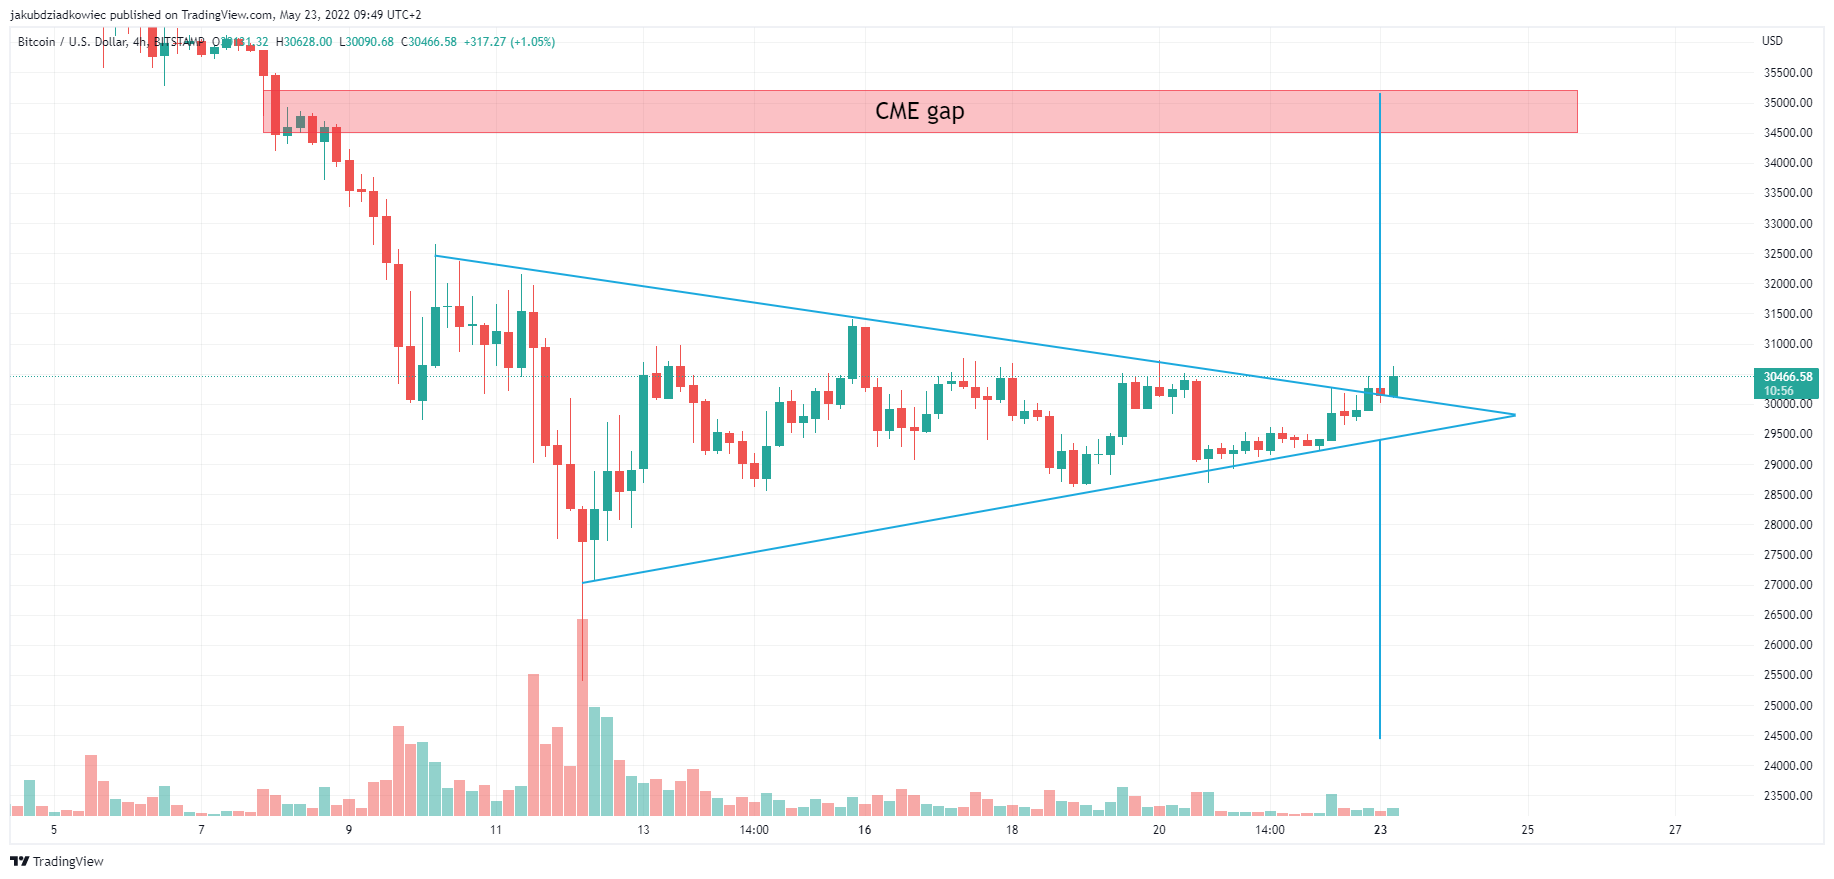
Meanwhile, on the short-term four-hour chart, we see an ongoing breakout from a symmetrical triangle pattern. The pattern has been in place since the May 12 lows and has a technical target near $35,000. This area coincides with the CME gap from May 6 to 9. However, if this is a fakeout and there will be a breakdown from this pattern, the bearish target is around $24,500.
For Be[in]Crypto’s previous bitcoin (BTC) analysis, click here.


