


Bitcoin (BTC) fell on Sept 14, reaching a low of $43,400 before bouncing and closing near $45,000.
While long-term indicators are turning bearish, short-term signals suggest that a rebound is in store.
BTC hovers above support
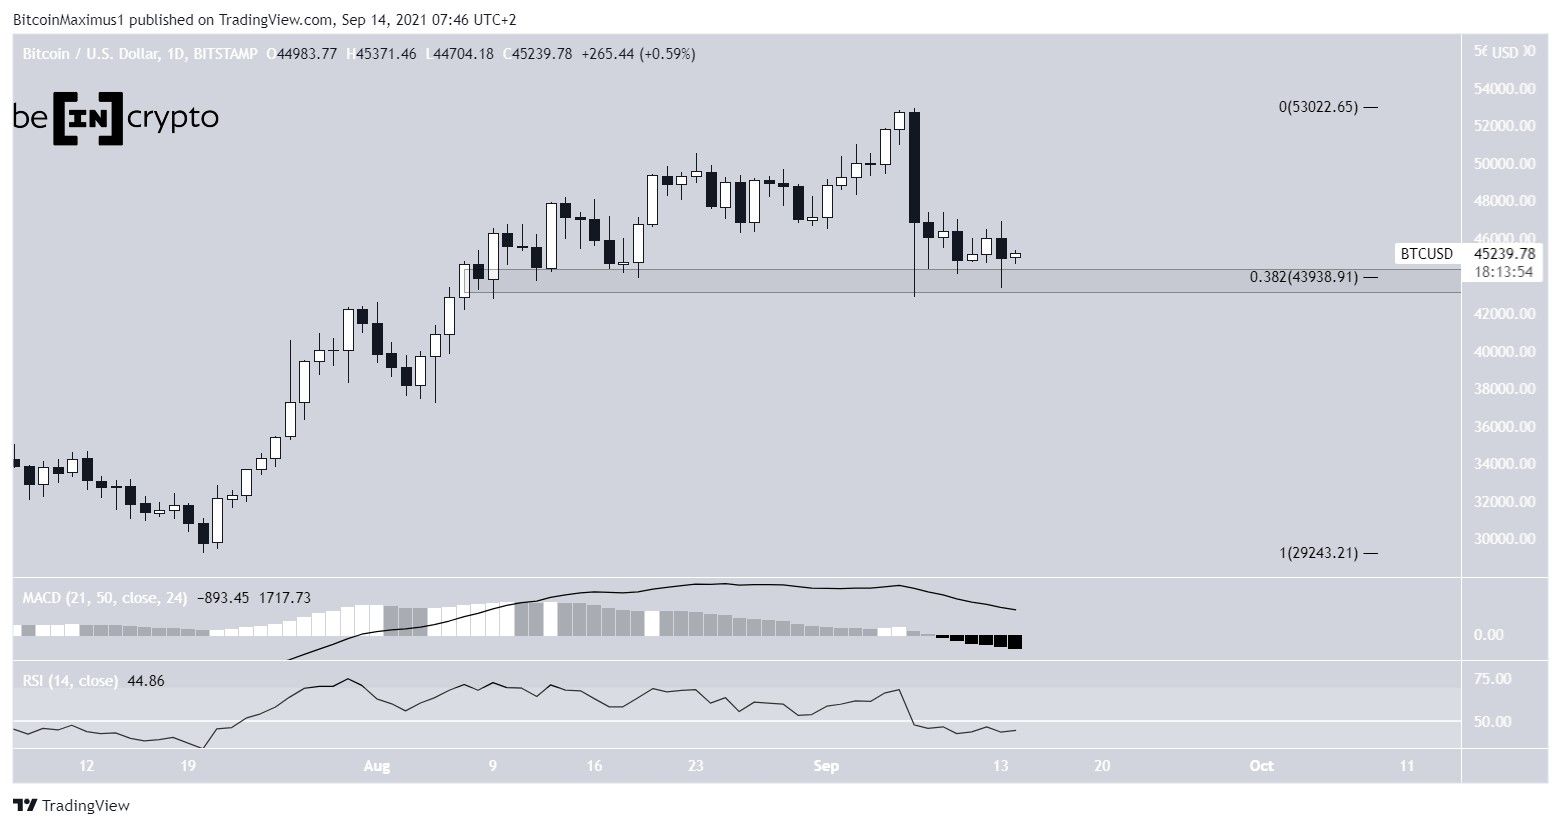
BTC decreased considerably yesterday, reaching a low of $43,400. However, it created a long lower wick and bounced back, reaching a close near $45,000.
The bounce served to validate the $43,950 area as support. This is both a horizontal support area and the 0.382 Fib retracement support level.
Despite the bounce, technical indicators in the daily time frame have turned bearish. The MACD is almost negative and the RSI is below 50. Furthermore, both are moving downwards.
Therefore, while the price action still shows BTC above support, indicator readings are bearish.
Short-term movement
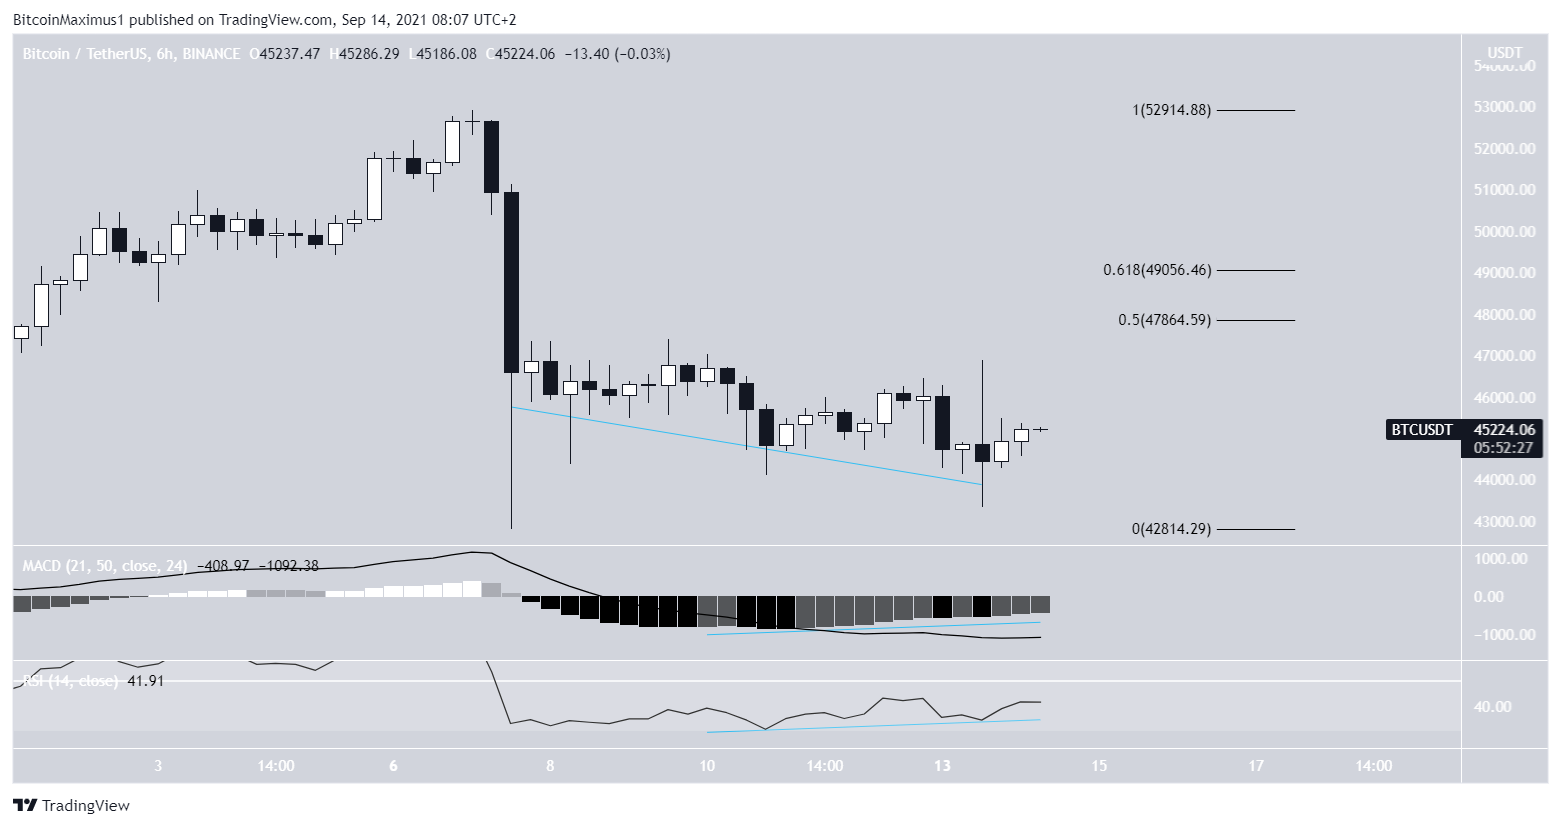
Despite the bearishness from the daily time frame, a look at the six-hour chart suggests that a bounce is in store.
Both the RSI and MACD have generated bullish divergences, an occurrence that often precedes price increases.
If an upward move transpires, the closest resistances would be found at $47,850 and $49,050. These are the 0.5 and 0.618 Fib retracement support levels, respectively.
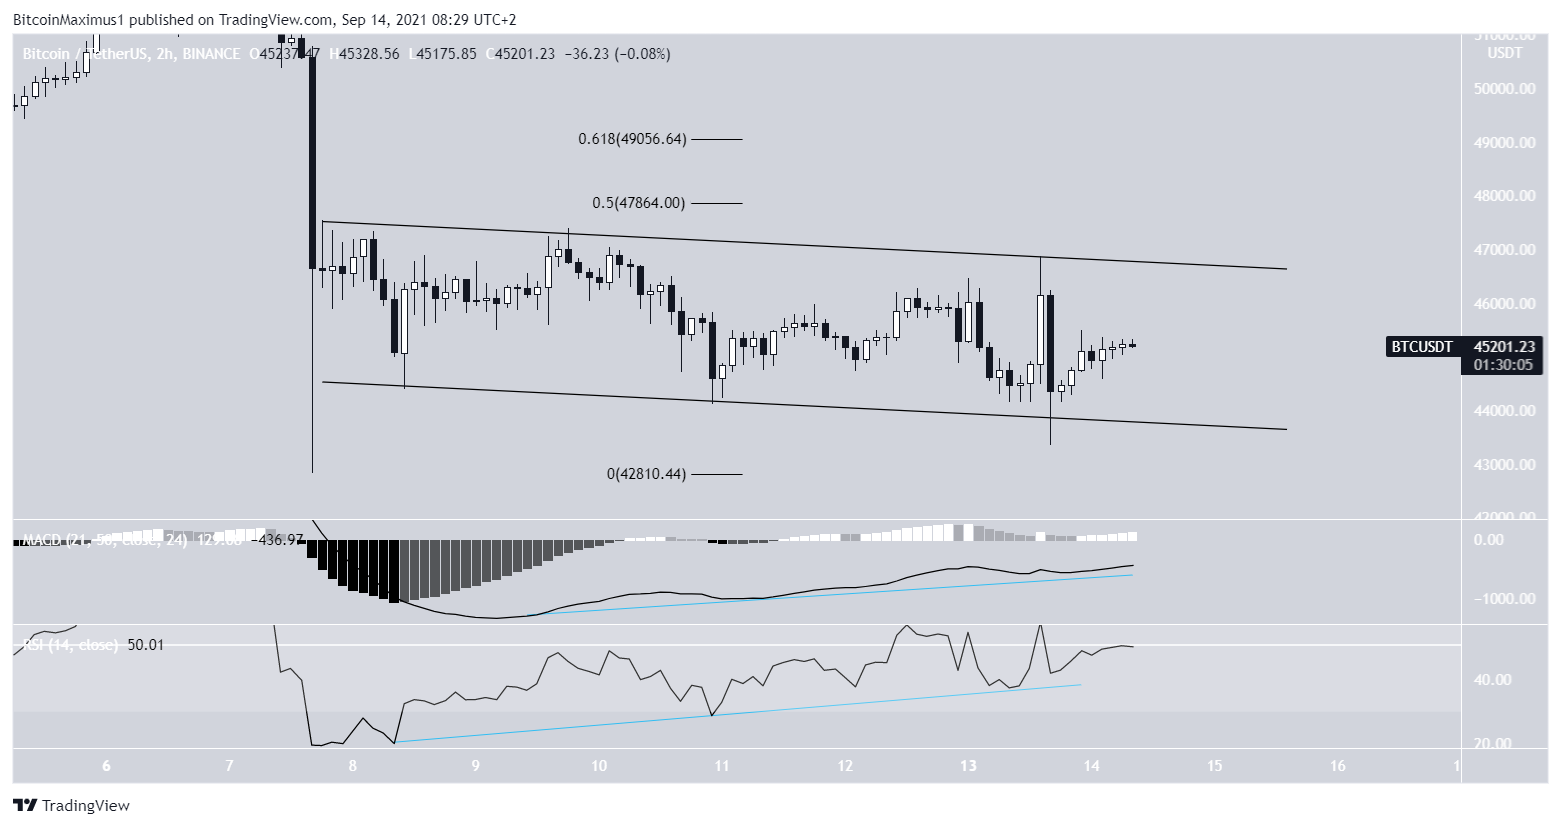
Readings from the two-hour chart also support this. It shows a descending parallel channel, a structure that often contains corrective movements.
The structure is also combined with a bullish divergence in both the RSI and MACD line.
Therefore, an eventual breakout is likely.
Wave count
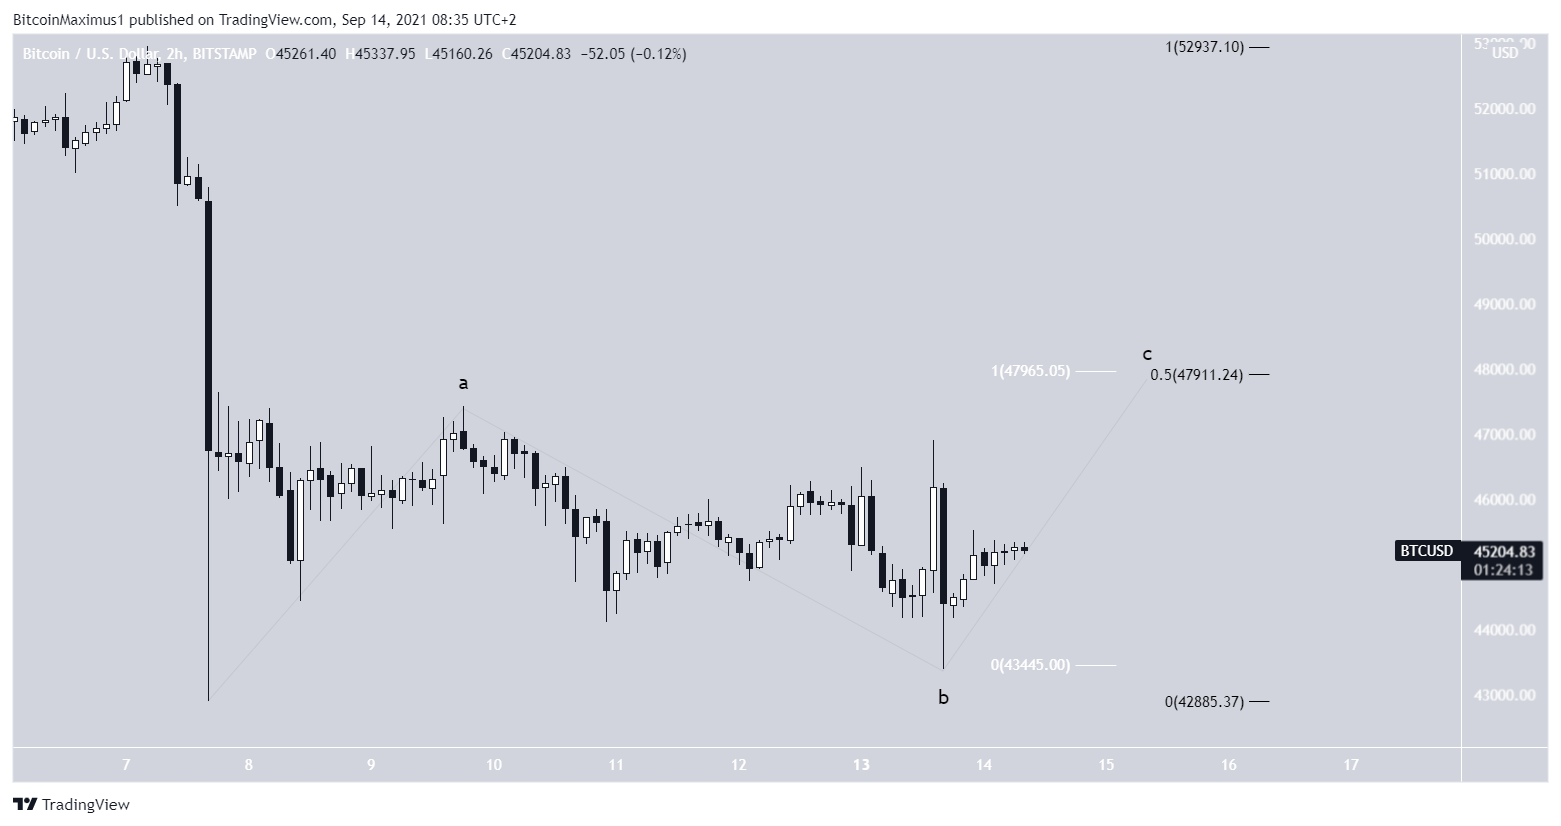
The wave count suggests that the current movement is a flat A-B-C corrective structure. If so, BTC is currently in wave C of this structure.
A likely target for the top of the move is between $47,900-$47,950. This is the 0.5 Fib retracement resistance level (black) and the 1:1 length of wave A (white).
After this, another downward move would be expected.
For BeInCrypto’s previous Bitcoin (BTC) analysis, click here.



