


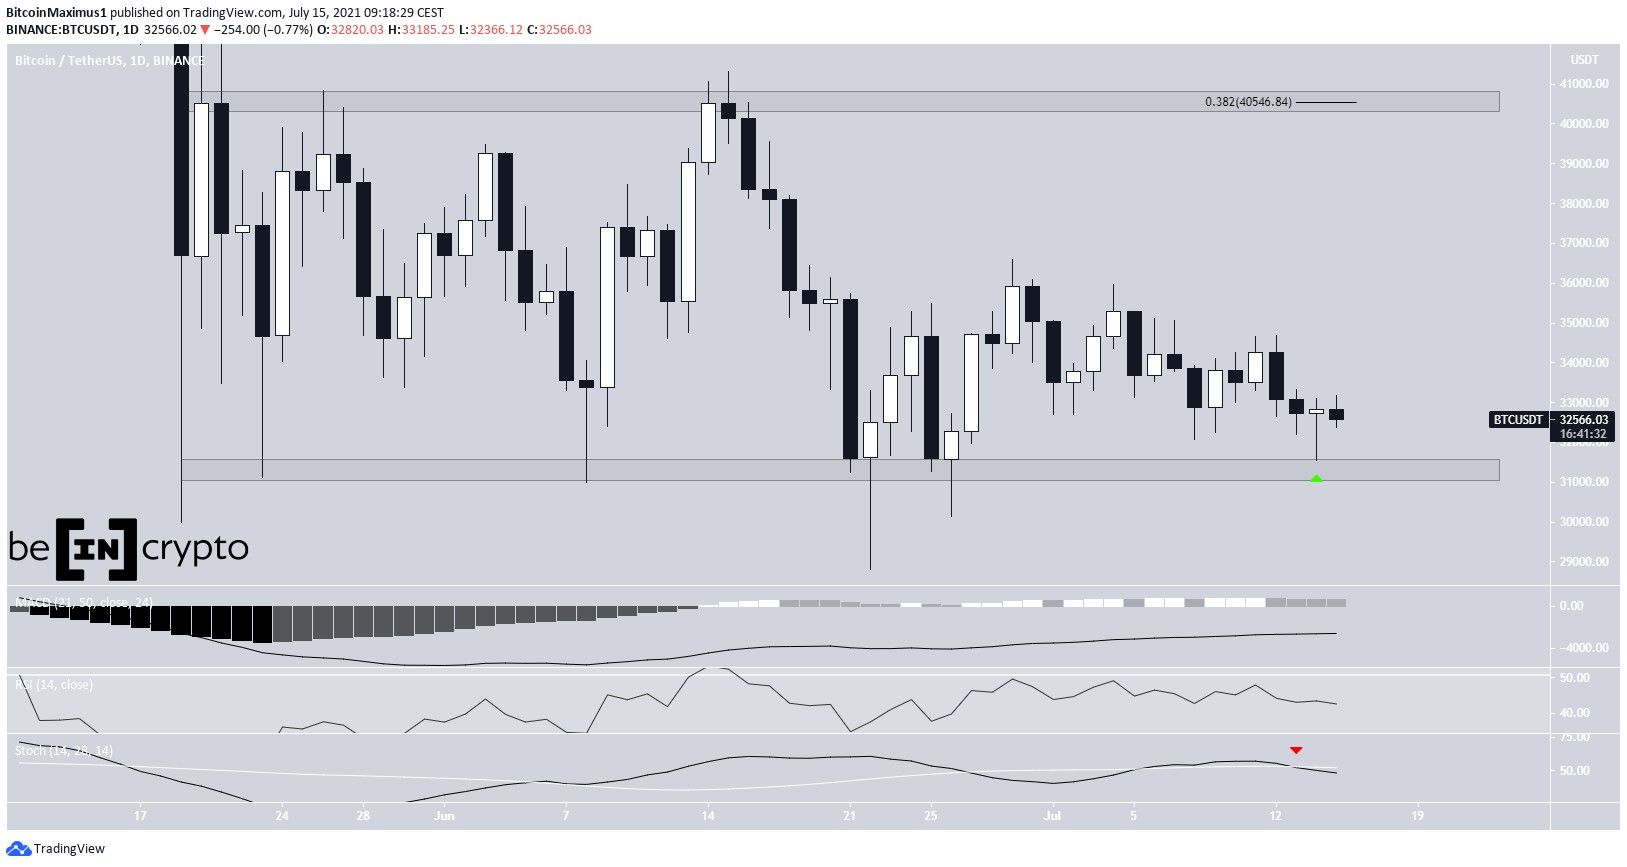
Bitcoin (BTC) created a bullish hammer candlestick on July 14, dropping to a low of $31,550 before reaching a close of $32,820.
It’s currently trying to reclaim the middle of a descending parallel channel. Doing so would confirm that a breakout is likely imminent.
Bitcoin creates bullish hammer
BTC began July 14 by decreasing considerably. It initially fell to a low of $31,550, nearly touching the horizontal support area of $31,300.
However, it bounced back almost immediately and proceeded to reach a close of $32,820. The movement created a long lower wick and a bullish hammer candlestick (green icon).
Despite the bullish candlestick, technical indicators in the daily time frame are bearish. This is especially evident by the bearish cross in the Stochastic oscillator (red icon).
The main resistance area is found at $40,550. This target is the 0.382 Fib retracement level and a horizontal resistance area.
Short-term channel
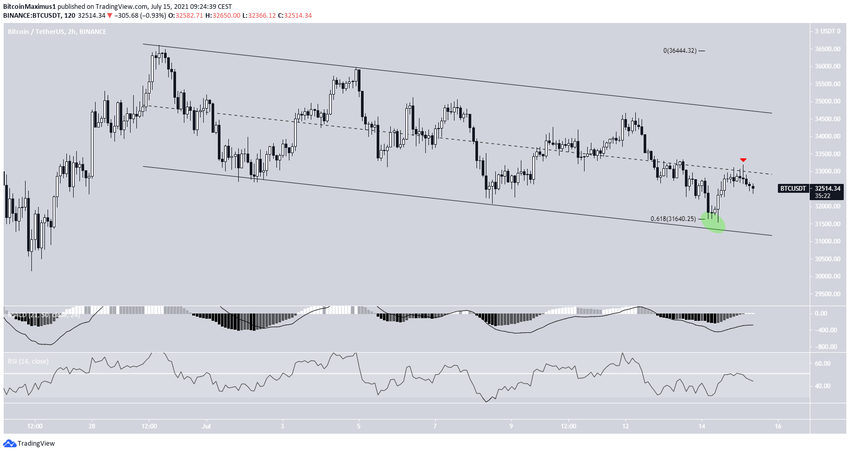
The two-hour chart shows that BTC has been trading inside a descending parallel channel since June 30. Such channels usually contain corrective movements, therefore a breakout from it would be likely.
On July 14, it bounced very close to the support line of the channel (green circle) at the 0.618 Fib retracement support area.
It’s currently facing resistance from the middle of the channel (red icon). In order to confirm a breakout, it has to reclaim this level.
This would also cause both the two-hour MACD and RSI to turn bullish.
Wave count
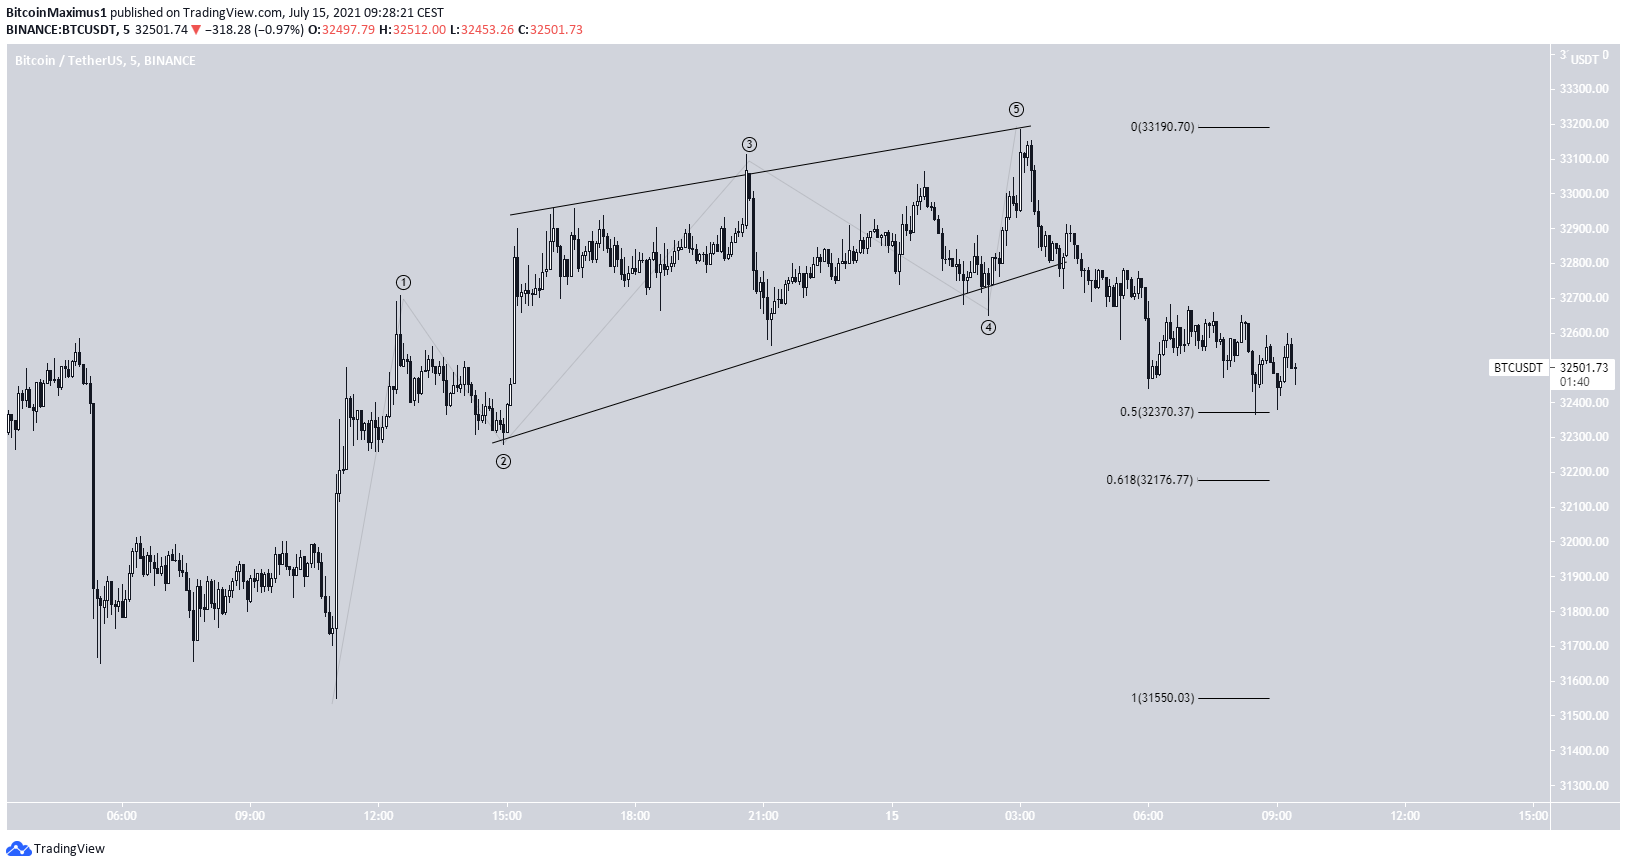
The bounce from the July 14 lows looks like a five-wave structure, though it resembles a diagonal. If this is correct, BTC could find support at either the 0.5 Fib retracement level at $32,370 or the 0.618 Fib at $32,176 before moving upwards.
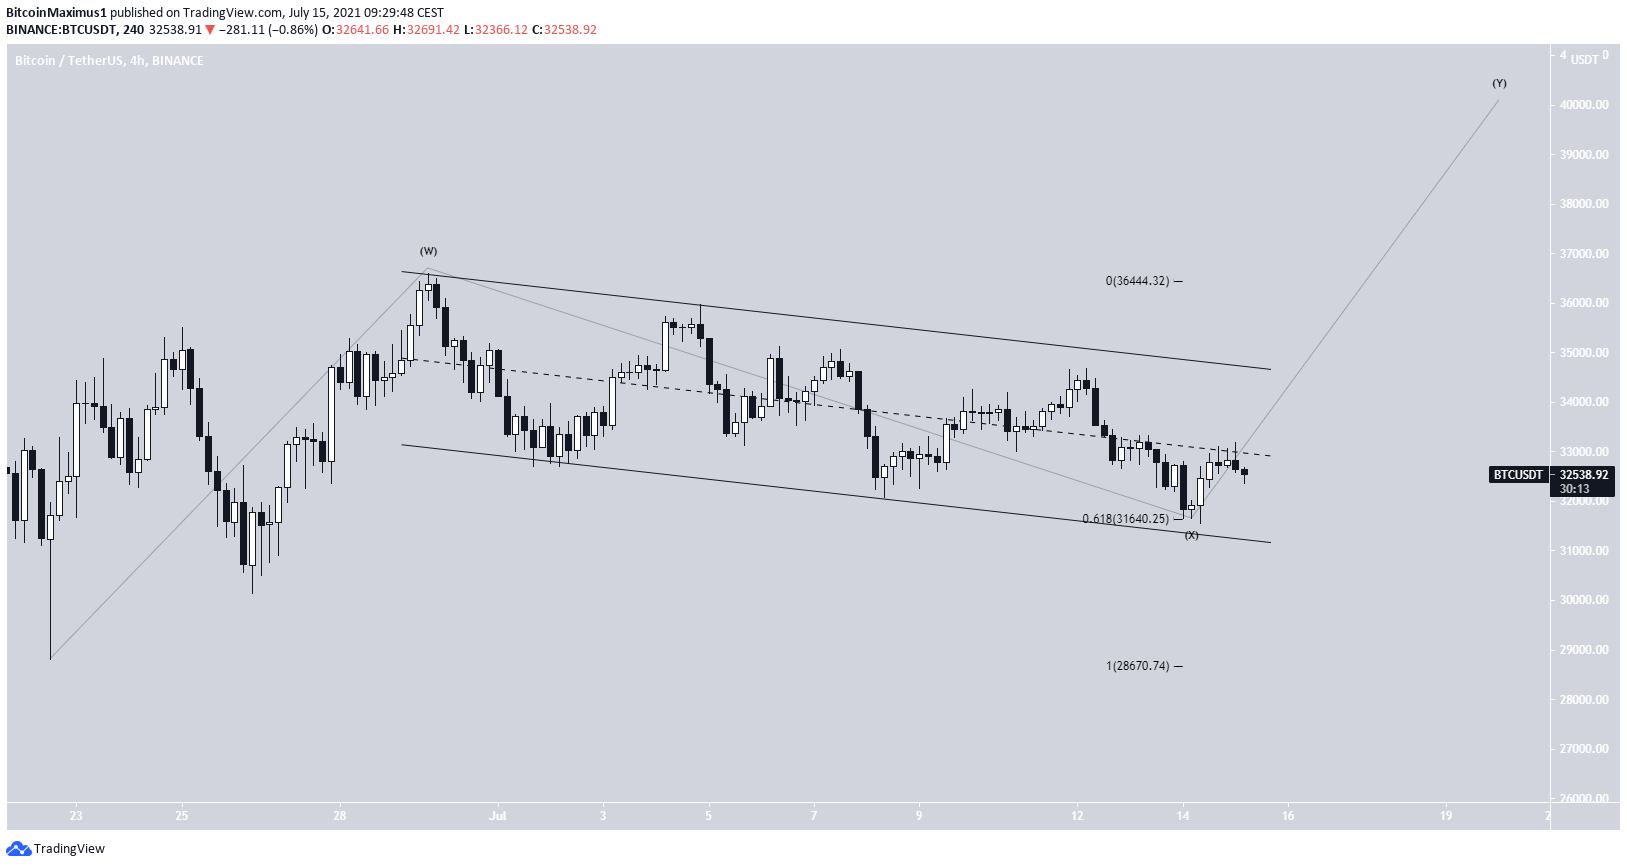
It’s likely that the entire channel is part of a complex, W-X-Y corrective structure. A breakout from the channel would confirm this and could take BTC toward the range highs near $40,550.
For BeInCrypto’s previous bitcoin (BTC) analysis, click here.


