


The Bitcoin (BTC) price has been consolidating inside a symmetrical triangle pattern since reaching a local bottom on May 19.
Currently, BTC is in the process of breaking out amid a bullish engulfing candlestick.
BTC attempts breakout
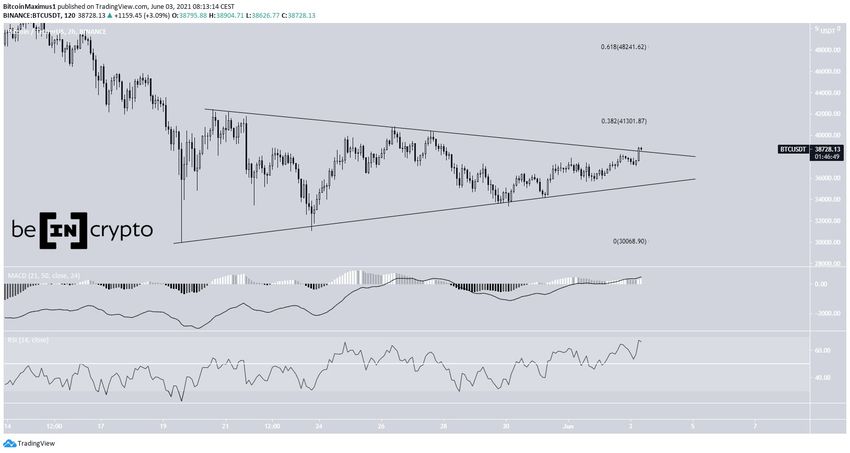
BTC has been trading inside a symmetrical triangle since reaching a low on May 19. Currently, it’s in the process of breaking out of this pattern.
If successful, the next resistance levels would likely be found at $41,300 and $48,250. These targets are the respective 0.382 and 0.618 Fib retracement resistance levels.
The MACD and RSI readings support the continuation of the upward movement, as both are moving upwards. The former is above 0 while the latter is above 50.
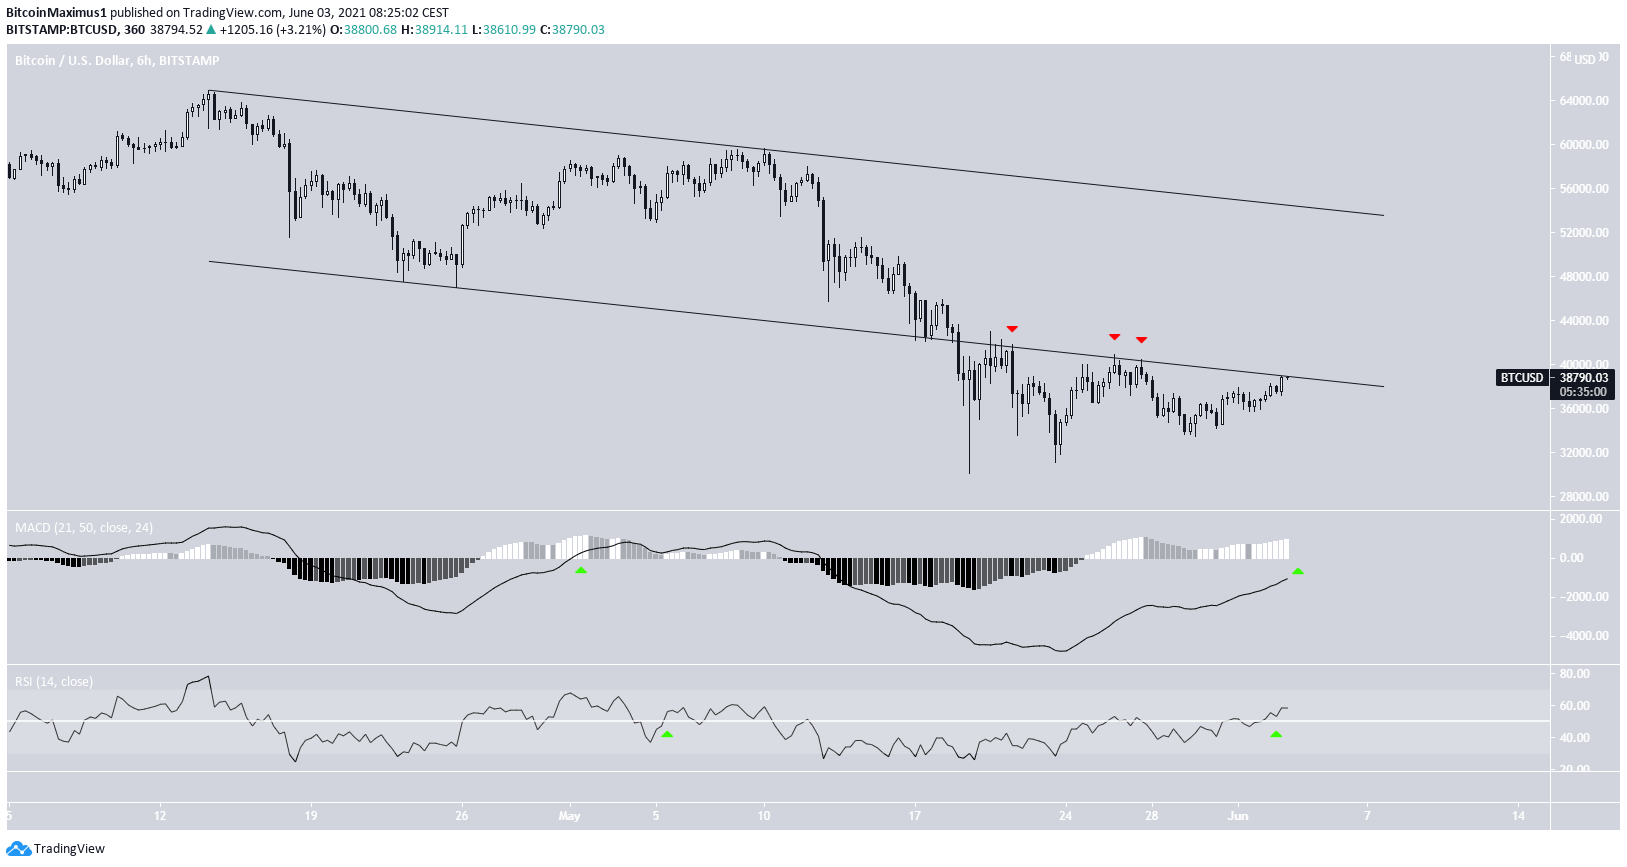
The six-hour chart also aligns with this reading. The RSI has crossed above 50 for the first time since May, while the MACD is in the process of moving above the 0-line.
More importantly, BTC could soon reclaim the support line of a descending parallel channel from which it previously broke down.
Prior to this, the support line rejected the price multiple times (red icons), confirming it as a resistance.
Reclaiming the channel would be a major bullish development.
Long-term outlook
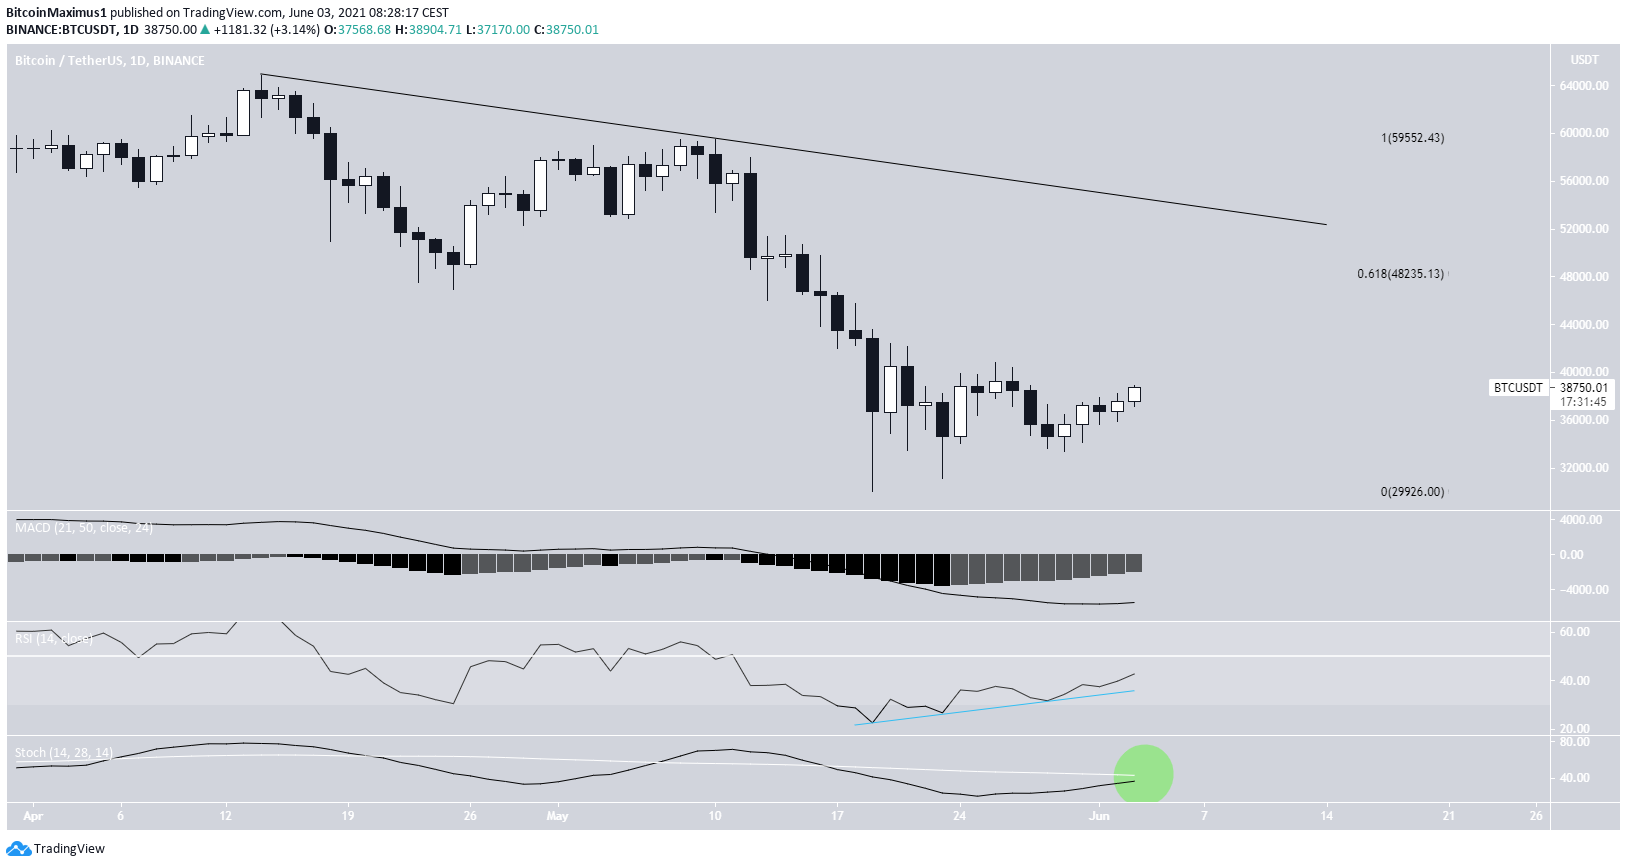
The longer-term daily chart for BTC also supports this scenario since technical indicators are in the process of turning bullish. This is especially evident by the impending bullish cross in the Stochastic oscillator (green).
In addition to this, the RSI has generated a considerable bullish divergence alongside an ascending trendline (blue).
Finally, the MACD is close to turning positive.
Finally, BTC is potentially following a descending resistance line, which is close to the previously outlined $48,200 resistance area. This further strengthens its significance, making it a crucial resistance level for the continuation of the bull run.
For BeInCrypto’s previous bitcoin (BTC) analysis, click here.


