


Bitcoin (BTC) made another failed attempt at reaching a new all-time high on April 12.
Nevertheless, BTC is expected to be successful in breaking out and reach a new all-time high in the process.
BTC aims for all-time high
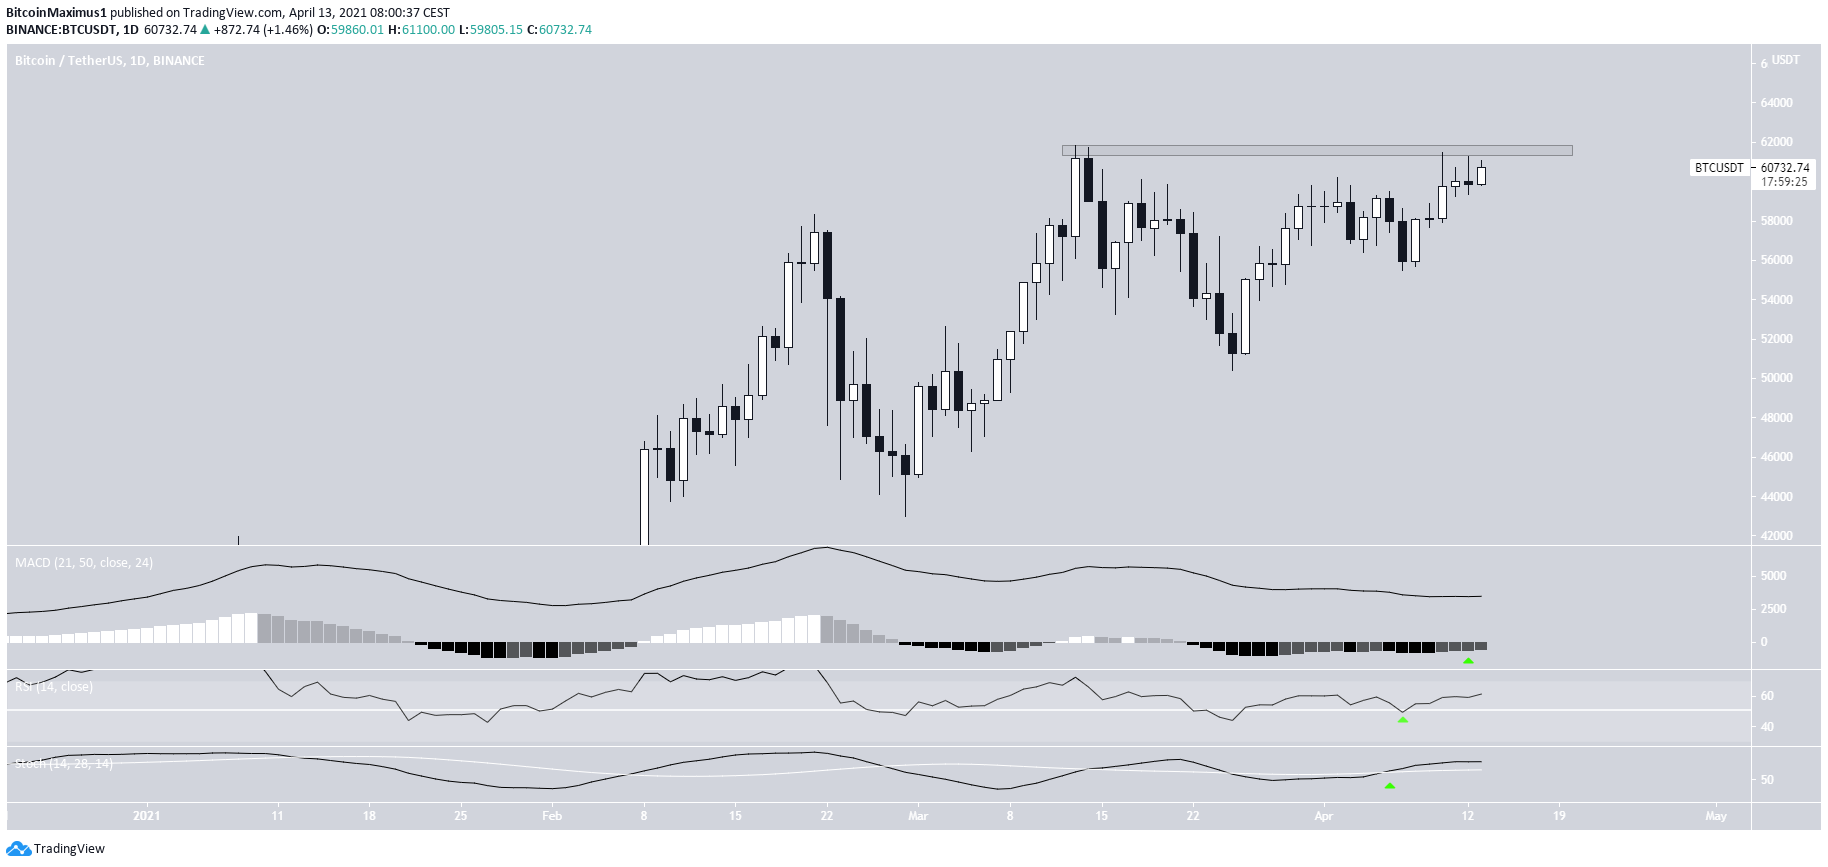
On April 10, bitcoin made an attempt at reaching a new all-time high but was stopped by the $61,600 resistance area. This created a long upper wick.
It made a similar attempt on April 12 but was stopped once again.
Today, BTC appears to be gearing up for yet another breakout attempt.
The MACD has given a bullish reversal signal and the RSI and Stochastic oscillator are both increasing.
Therefore, the price is expected to be successful in breaking out above this area and reach a new all-time high price.
Short-term movement
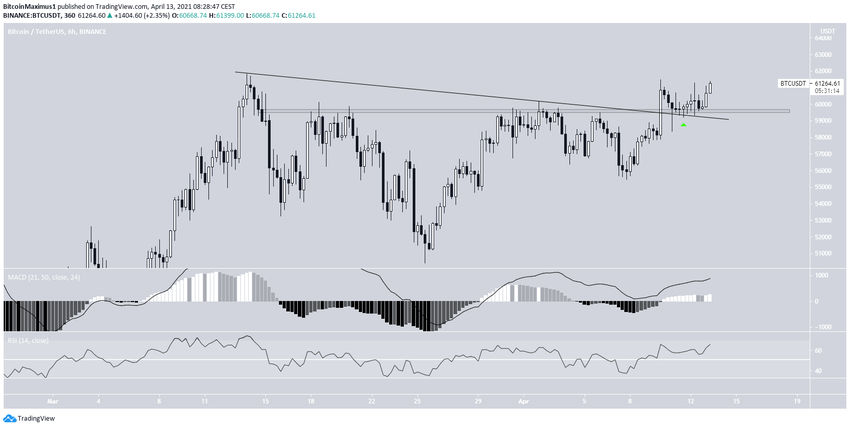
The six-hour chart shows a descending resistance line that has been in place since the all-time high price on March 13.
It broke from the line on April 10 and validated it as support after (green arrow). It has been moving upwards since.
Similar to the daily time frame, short-term indicators are bullish. Therefore, a new all-time high price is expected.
BTC wave count
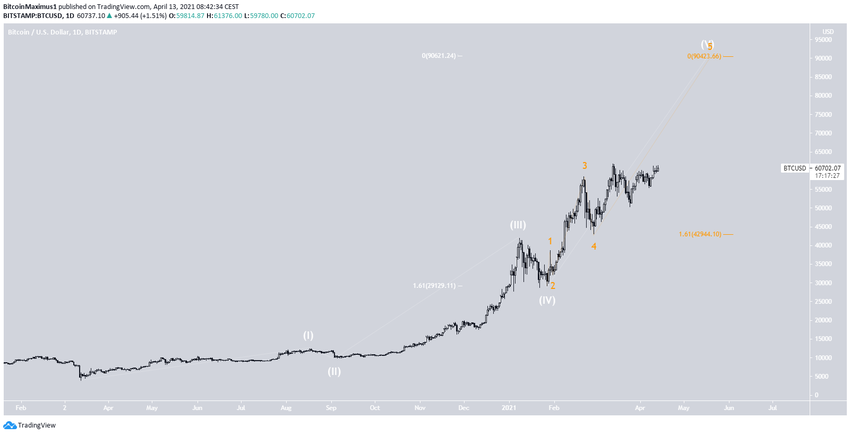
The wave count suggests that BTC is in wave five (white) of a long-term bullish impulse.
A potential target for the top of this move is found near $90,000. This is found by using both a Fib projection and external retracement.
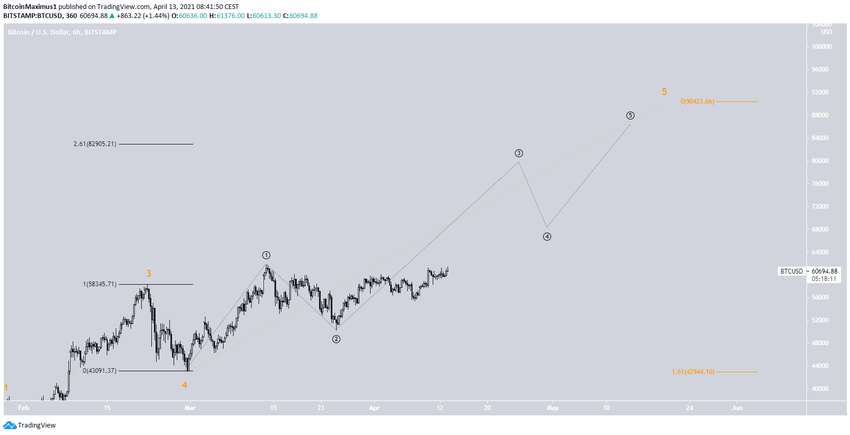
The sub-wave count is shown in orange. It also indicates that BTC is in sub-wave five (orange).
Similarly, the shorter-term count (black) indicates that the price is in minor sub-wave three.
Using an external Fib retracement gives a slightly lower target of $82,900.
Conclusion
BTC is expected to break out from the current horizontal area and reach a new all-time high in the process.
For BeInCrypto’s previous bitcoin (BTC) analysis, click here.


