


Throughout 2019, Bitcoin has surged at least three times. On May 23, a fourth surge may have begun with the most significant gains occuring during the spike on May 26.
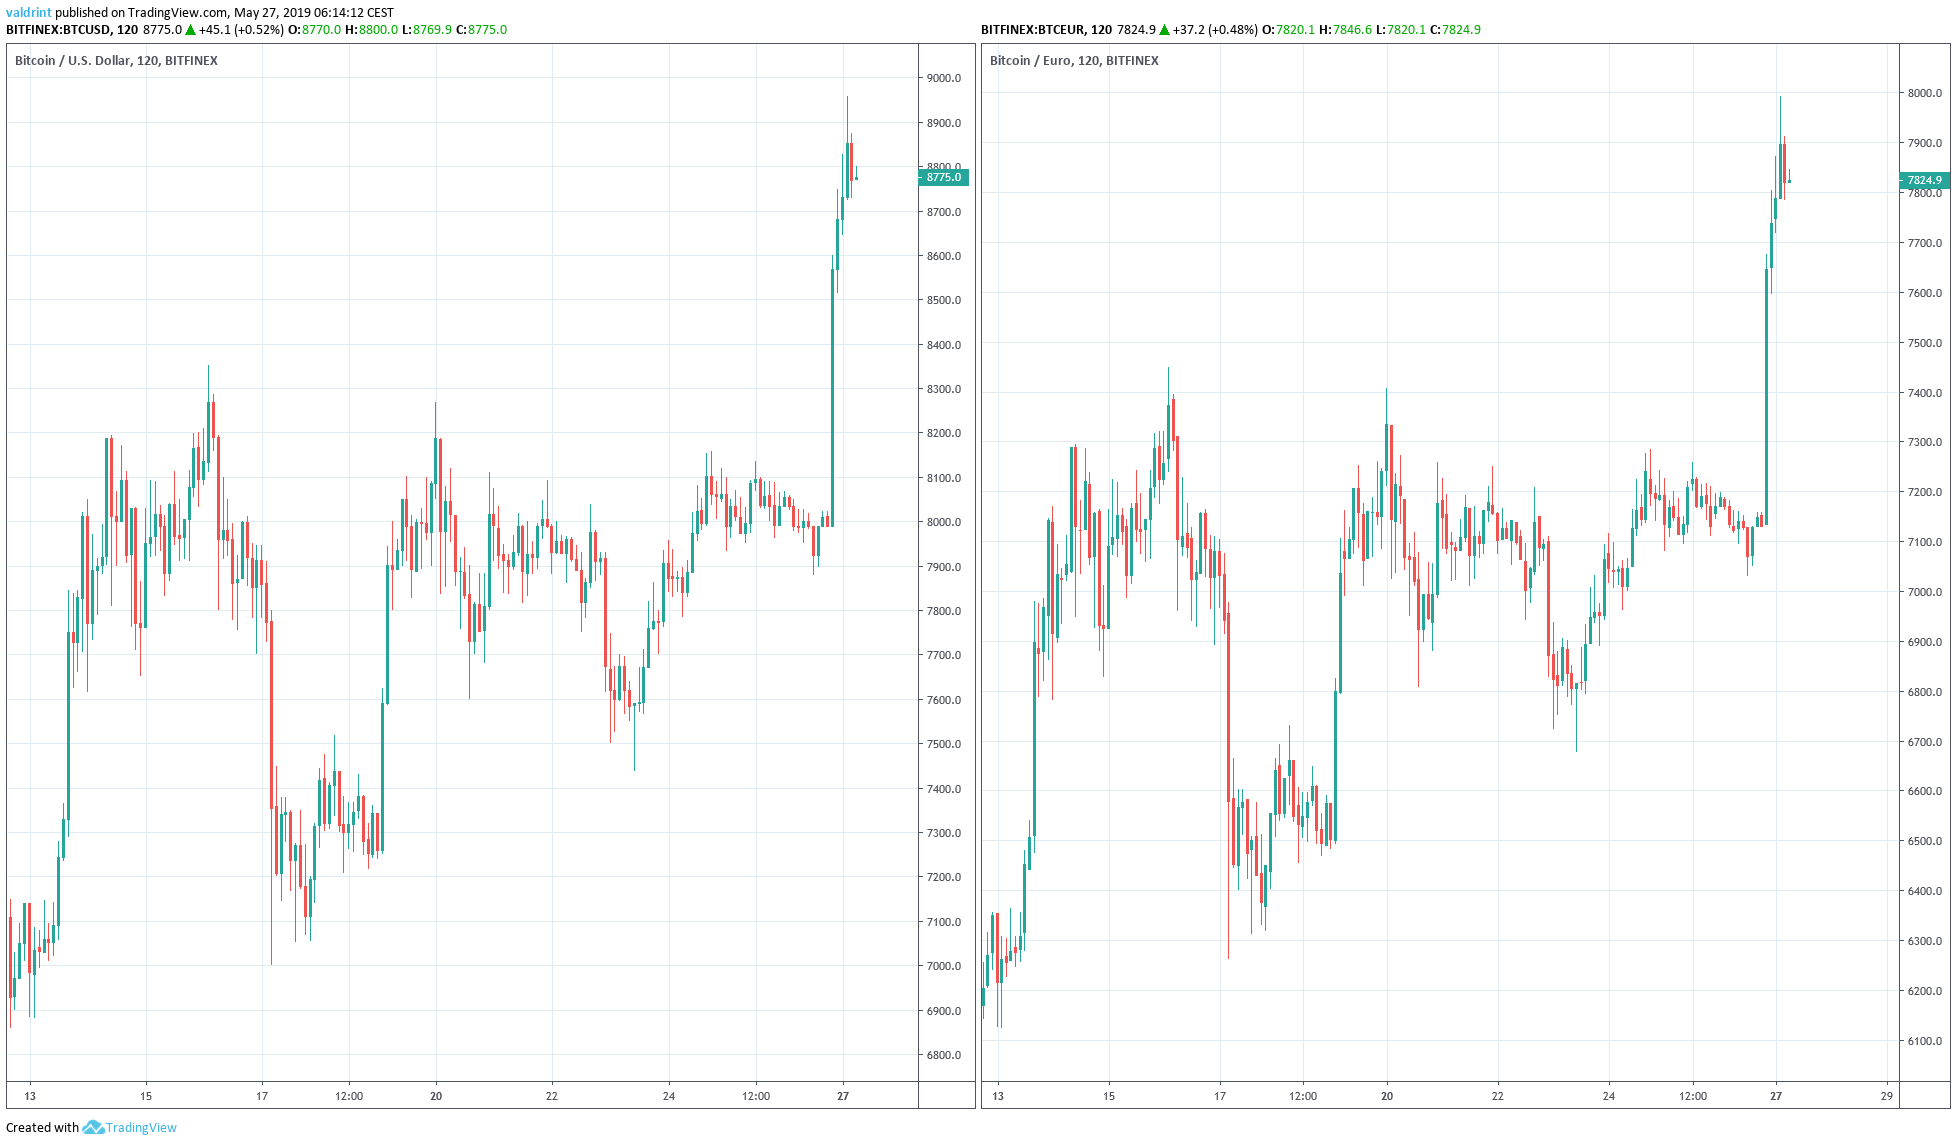
This surge followed a slight retracement from the previous one. After reaching a yearly high of $8325.30/€7449.10 on Bitfinex on May 16, the price hit a daily low of under $7000 the following day. What appeared to be a double top emerged on May 20 when prices pushed back toward May 16 highs.
However, instead of drops as anticipated, the price began rising. At the time of writing on May 27, yearly highs of $8958.3/€7998.1 had been reached.
BTC: Trends And Highlights For May 27, 2019
- The price broke out from a symmetrical triangle on May 26.
- It reached yearly highs the next day.
- The breakout occurred with significant volume.
- Bearish divergence is developing in the RSI.
- We are potentially in a fifth and final wave.
- There is resistance near $10000/€9500 and support near $7200/€6500
Tracing the Current Trading Pattern
On May 16, the price reached a high of $8325.3. A rapid decrease began. The next day, the price made a low of $6999.9.
It has been increasing since, trading inside the symmetrical triangle outlined below:
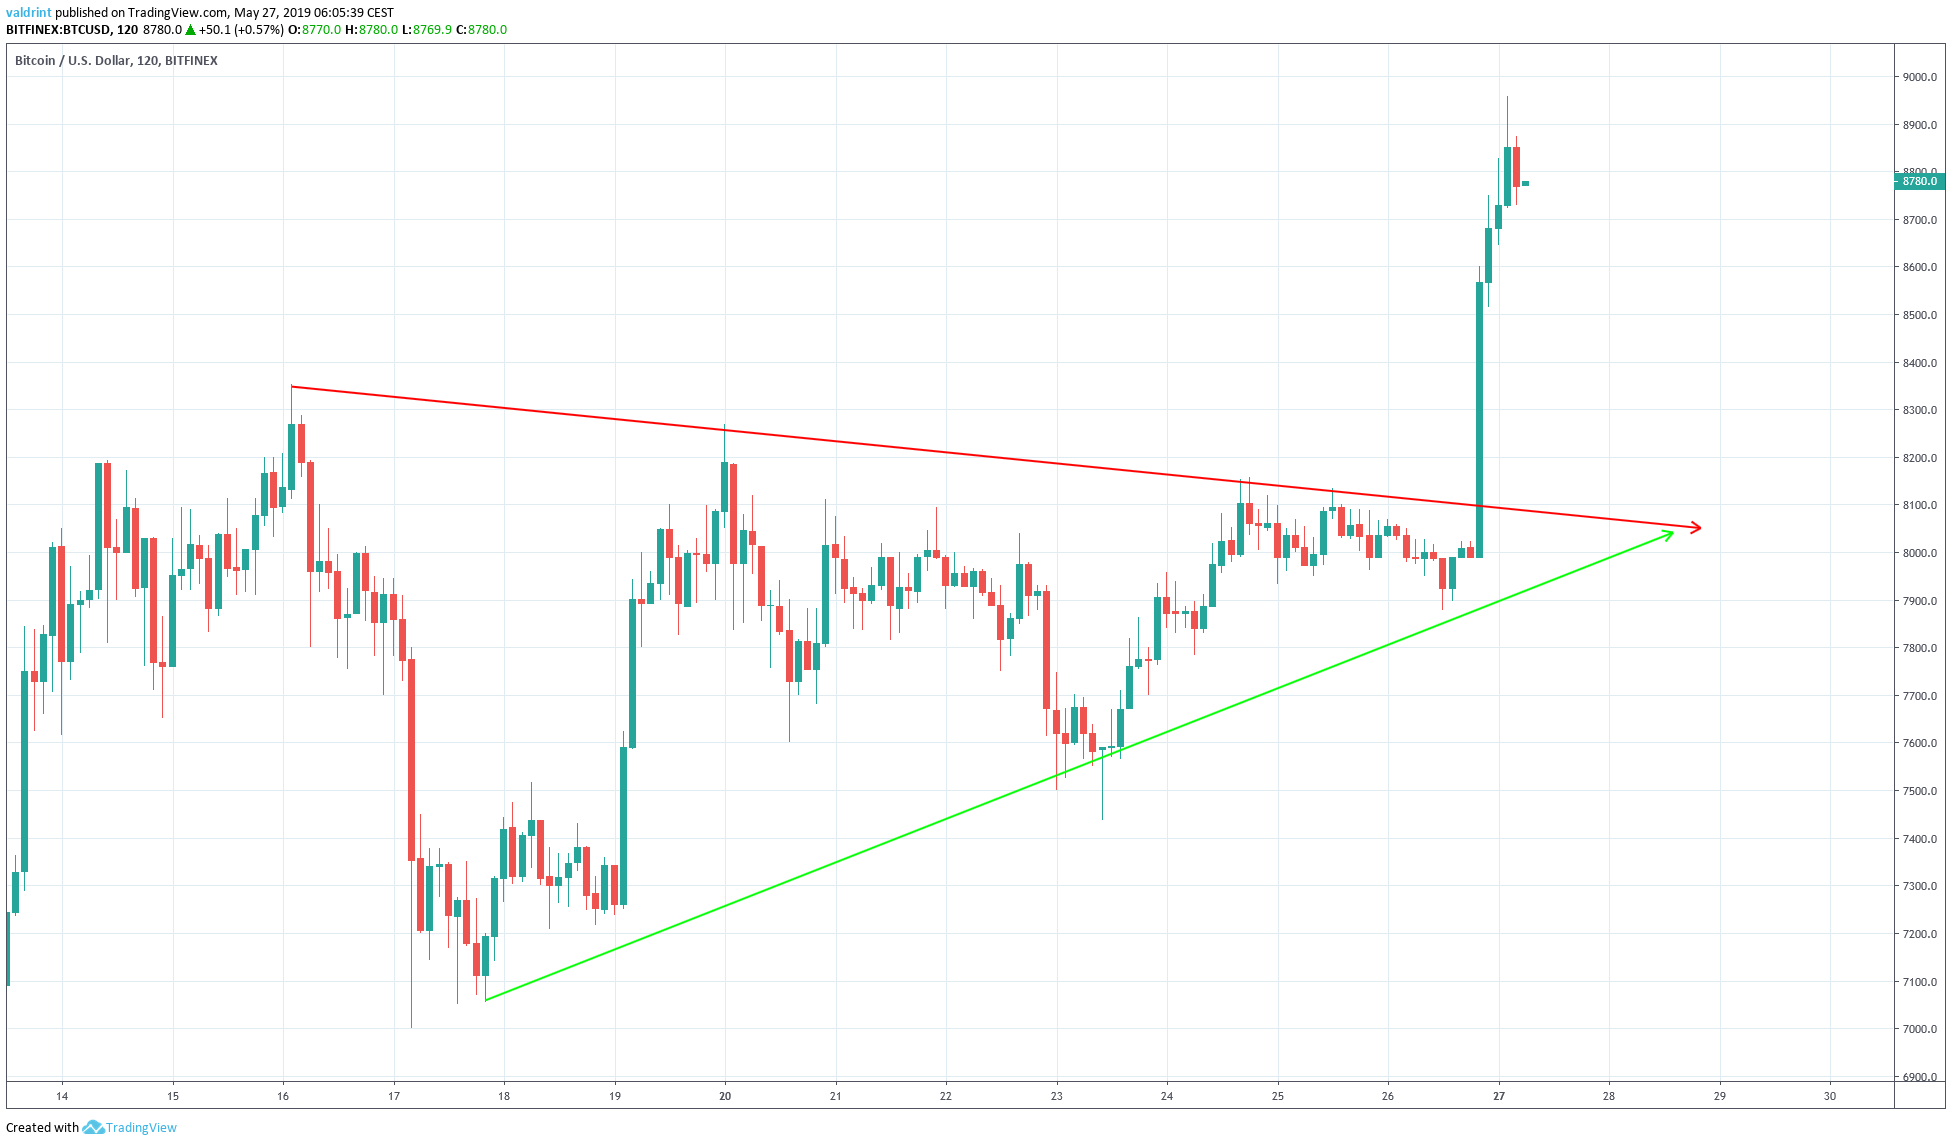
The price broke out from the triangle on May 27 and reached highs of $8958.3 the same day.
Volume
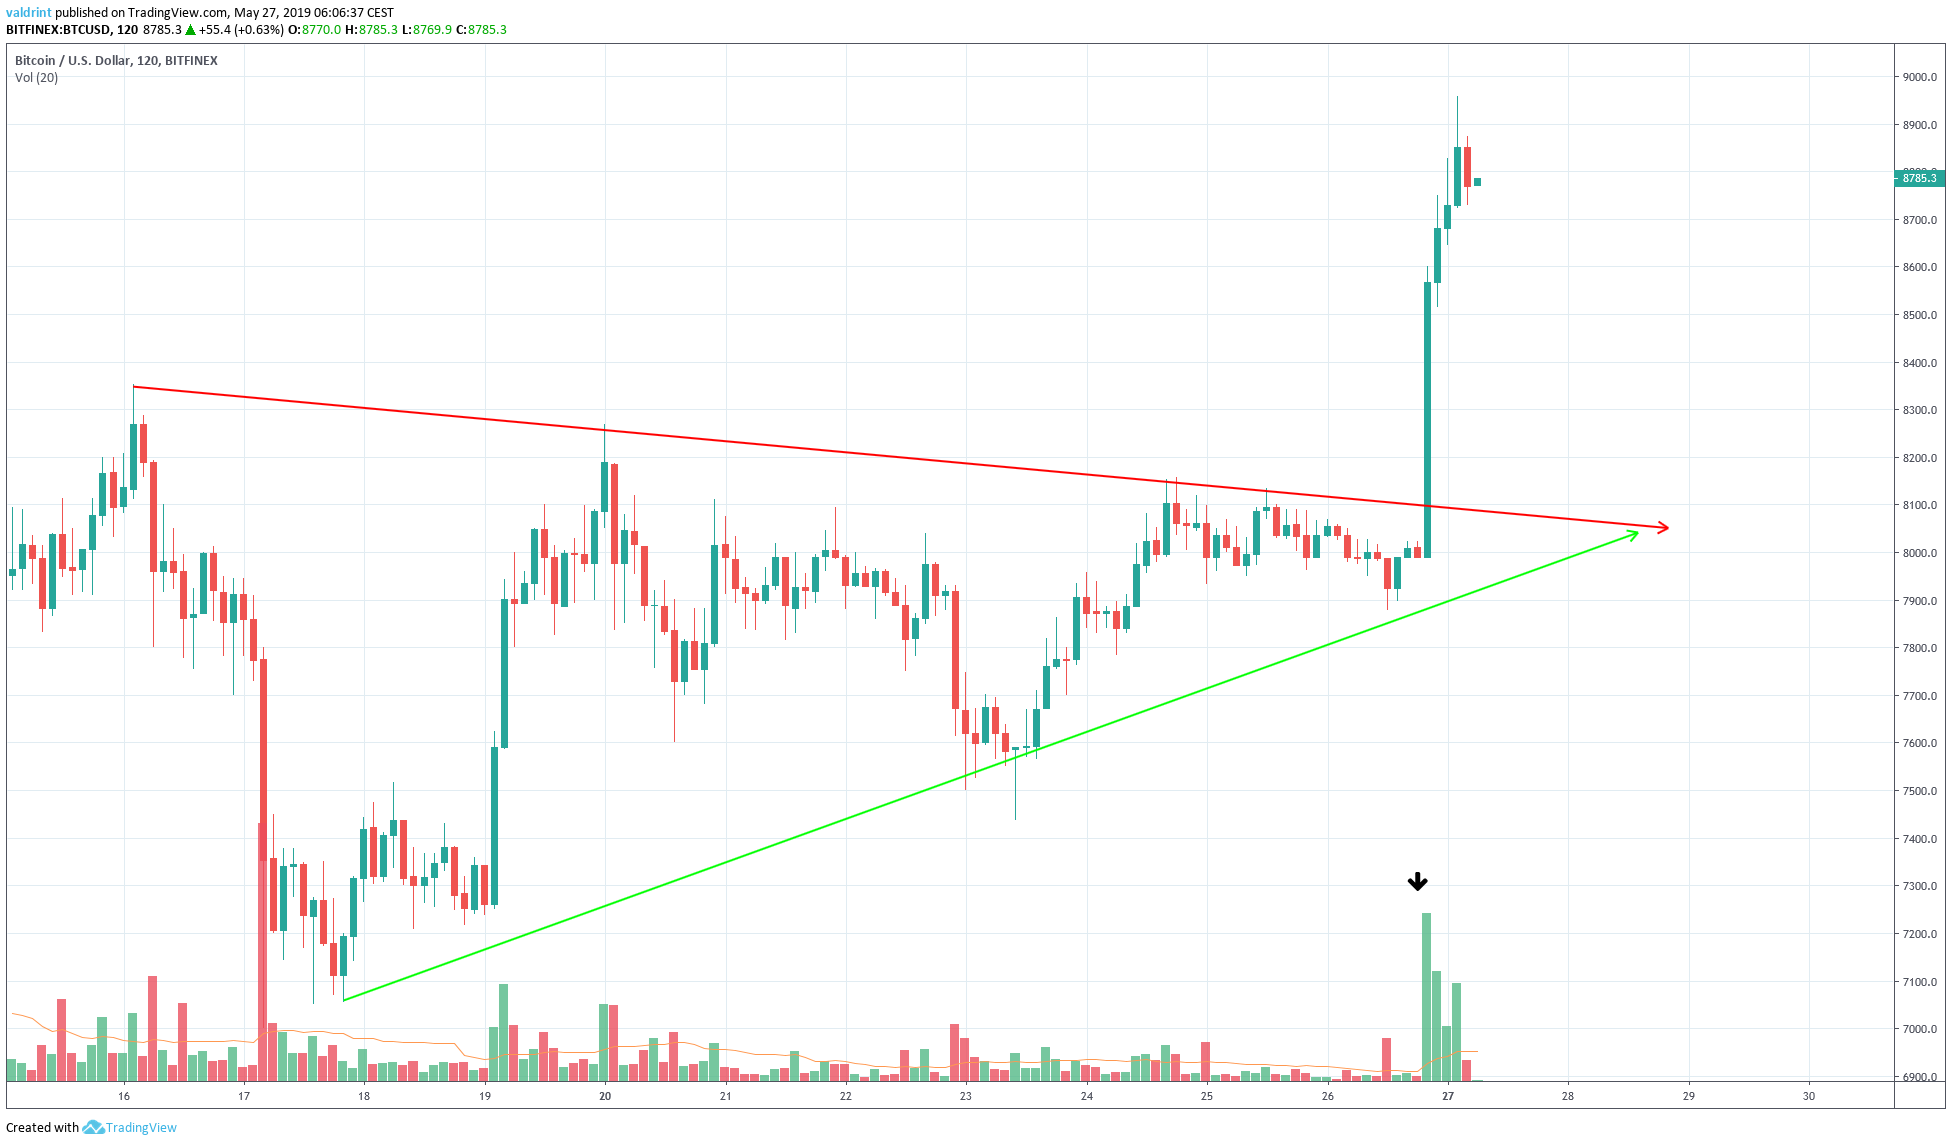
We can see that the breakout occurred with very significant volume. This is a sign that there is buying power in the market.
To determine whether these will be short- or long-term gains, the price of Bitcoin is analyzed at daily intervals alongside the RSI below:
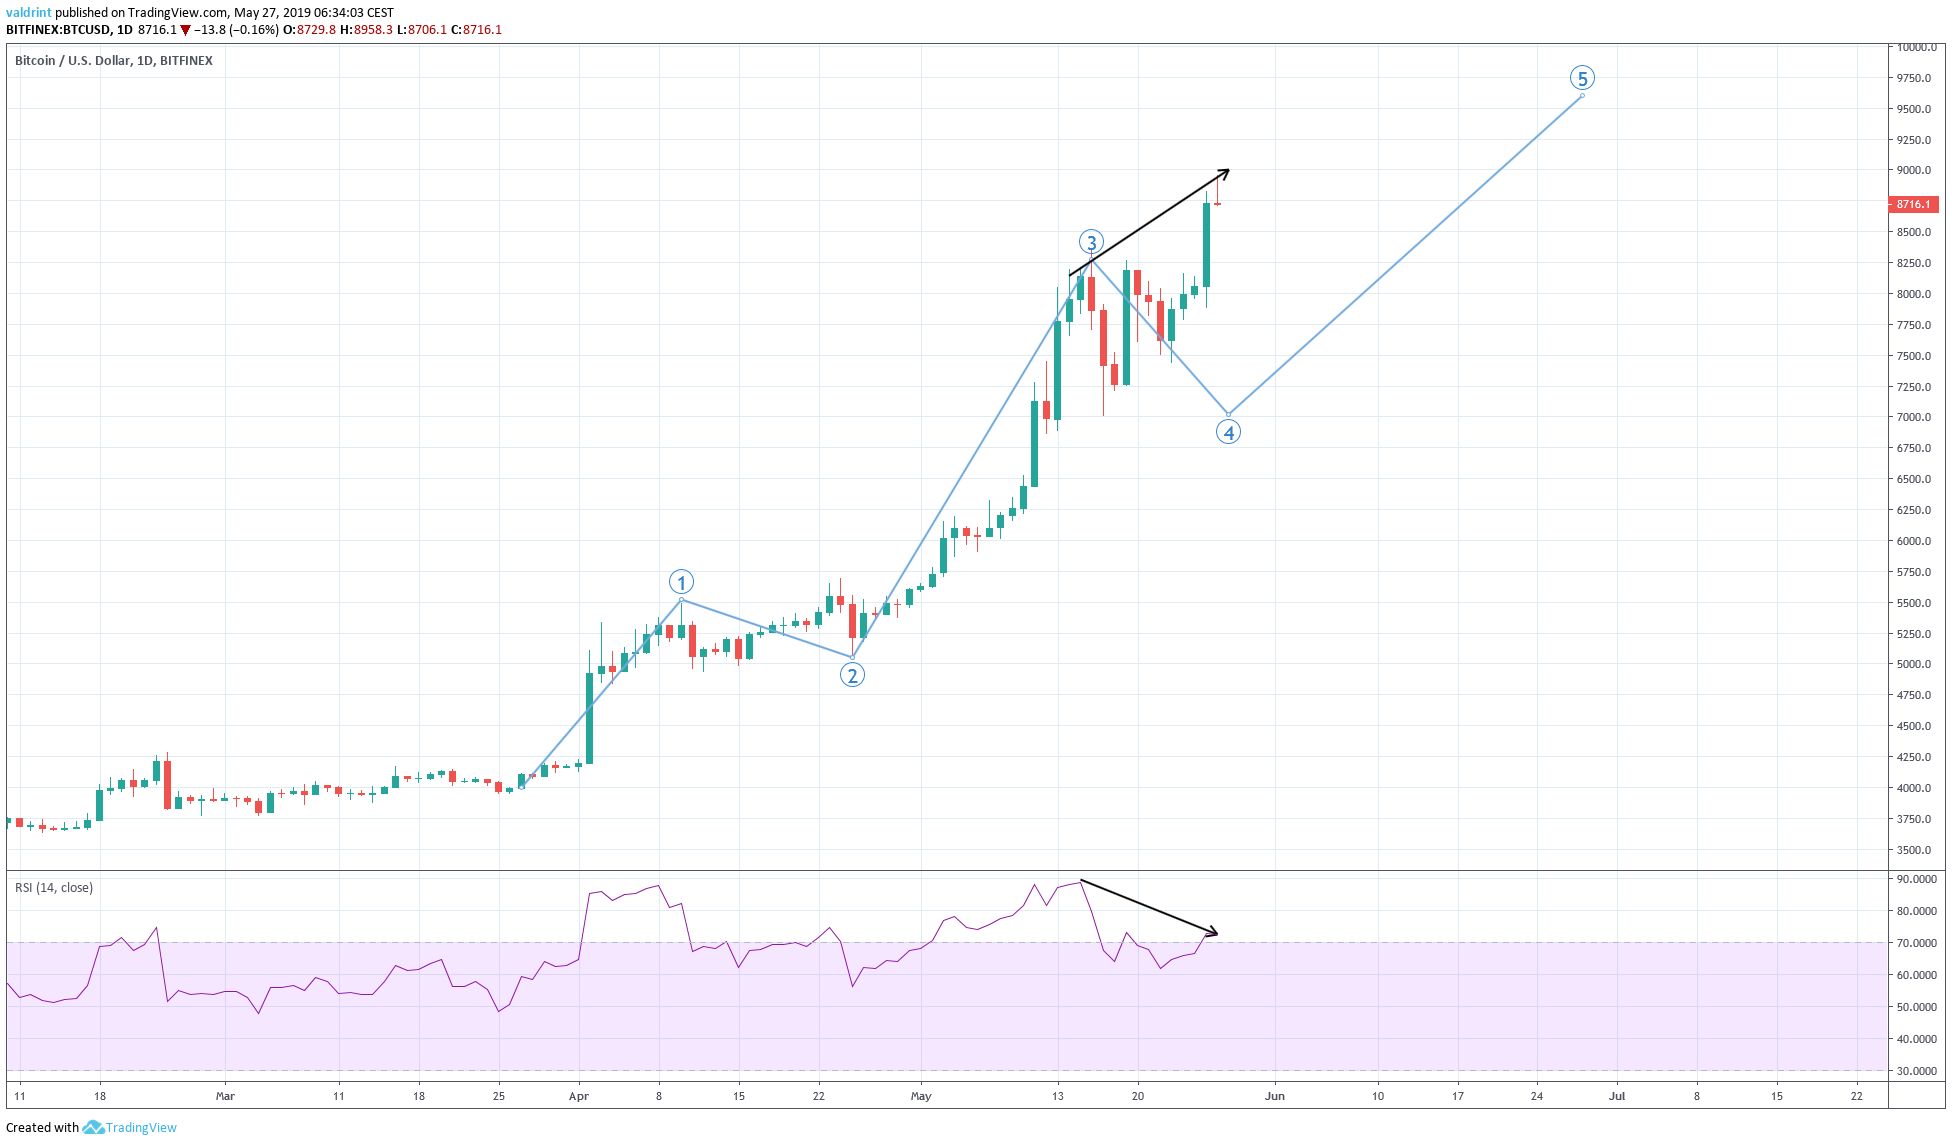
Since reaching the high on May 16, the RSI has been generating lower values. This is in stark contrast to the significantly higher highs we’ve observed with the price.
This is known as bearish divergence and often precedes price decreases. This divergence is also present in the 3-day time-frame, but not in the weekly one.
Furthermore, if we analyze a potential Elliott Wave formation, we are most likely in the fifth and final upward wave. The RSI movements support this hypothesis.
Together, these indicators suggest that price will continue to increase in the short-term, completing the fifth wave. Eventually, a reversal is likely.
Future Movement
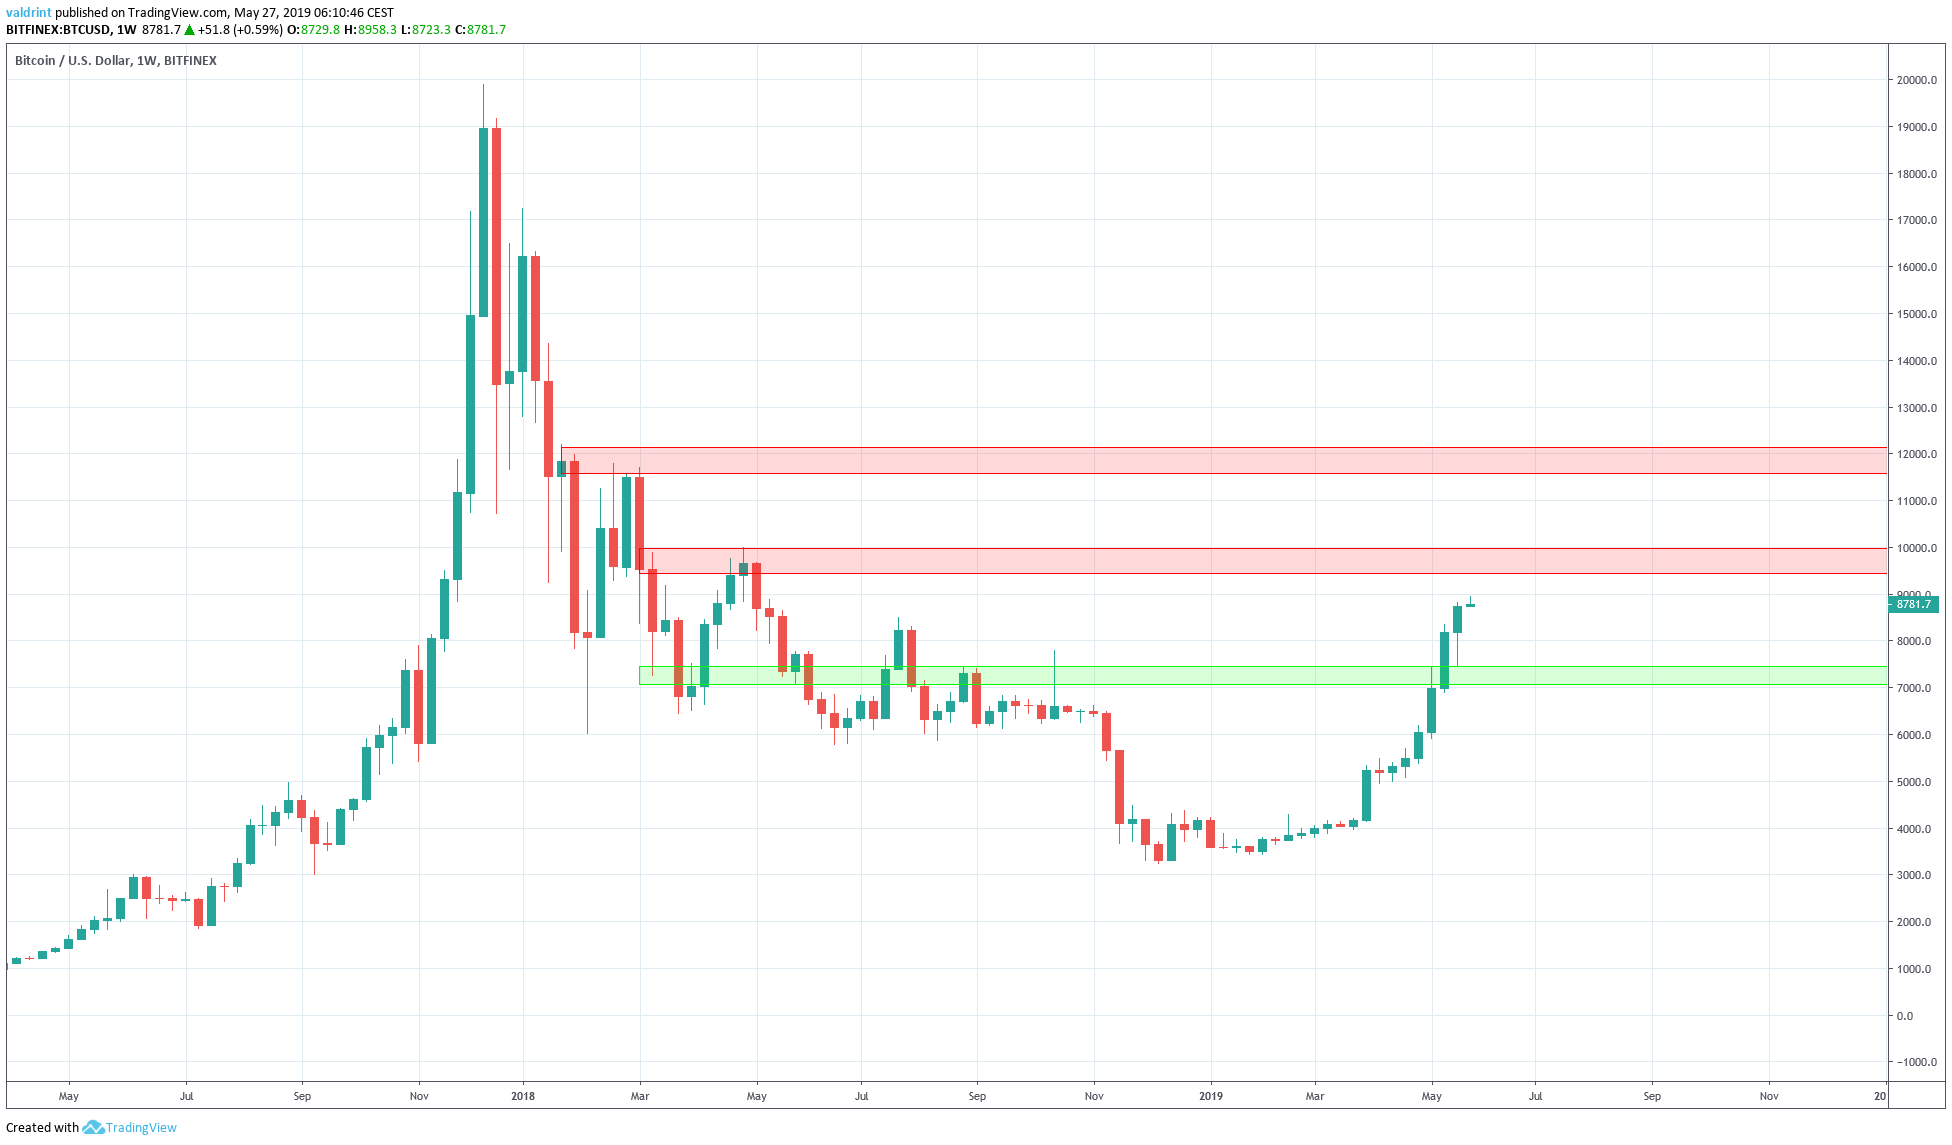
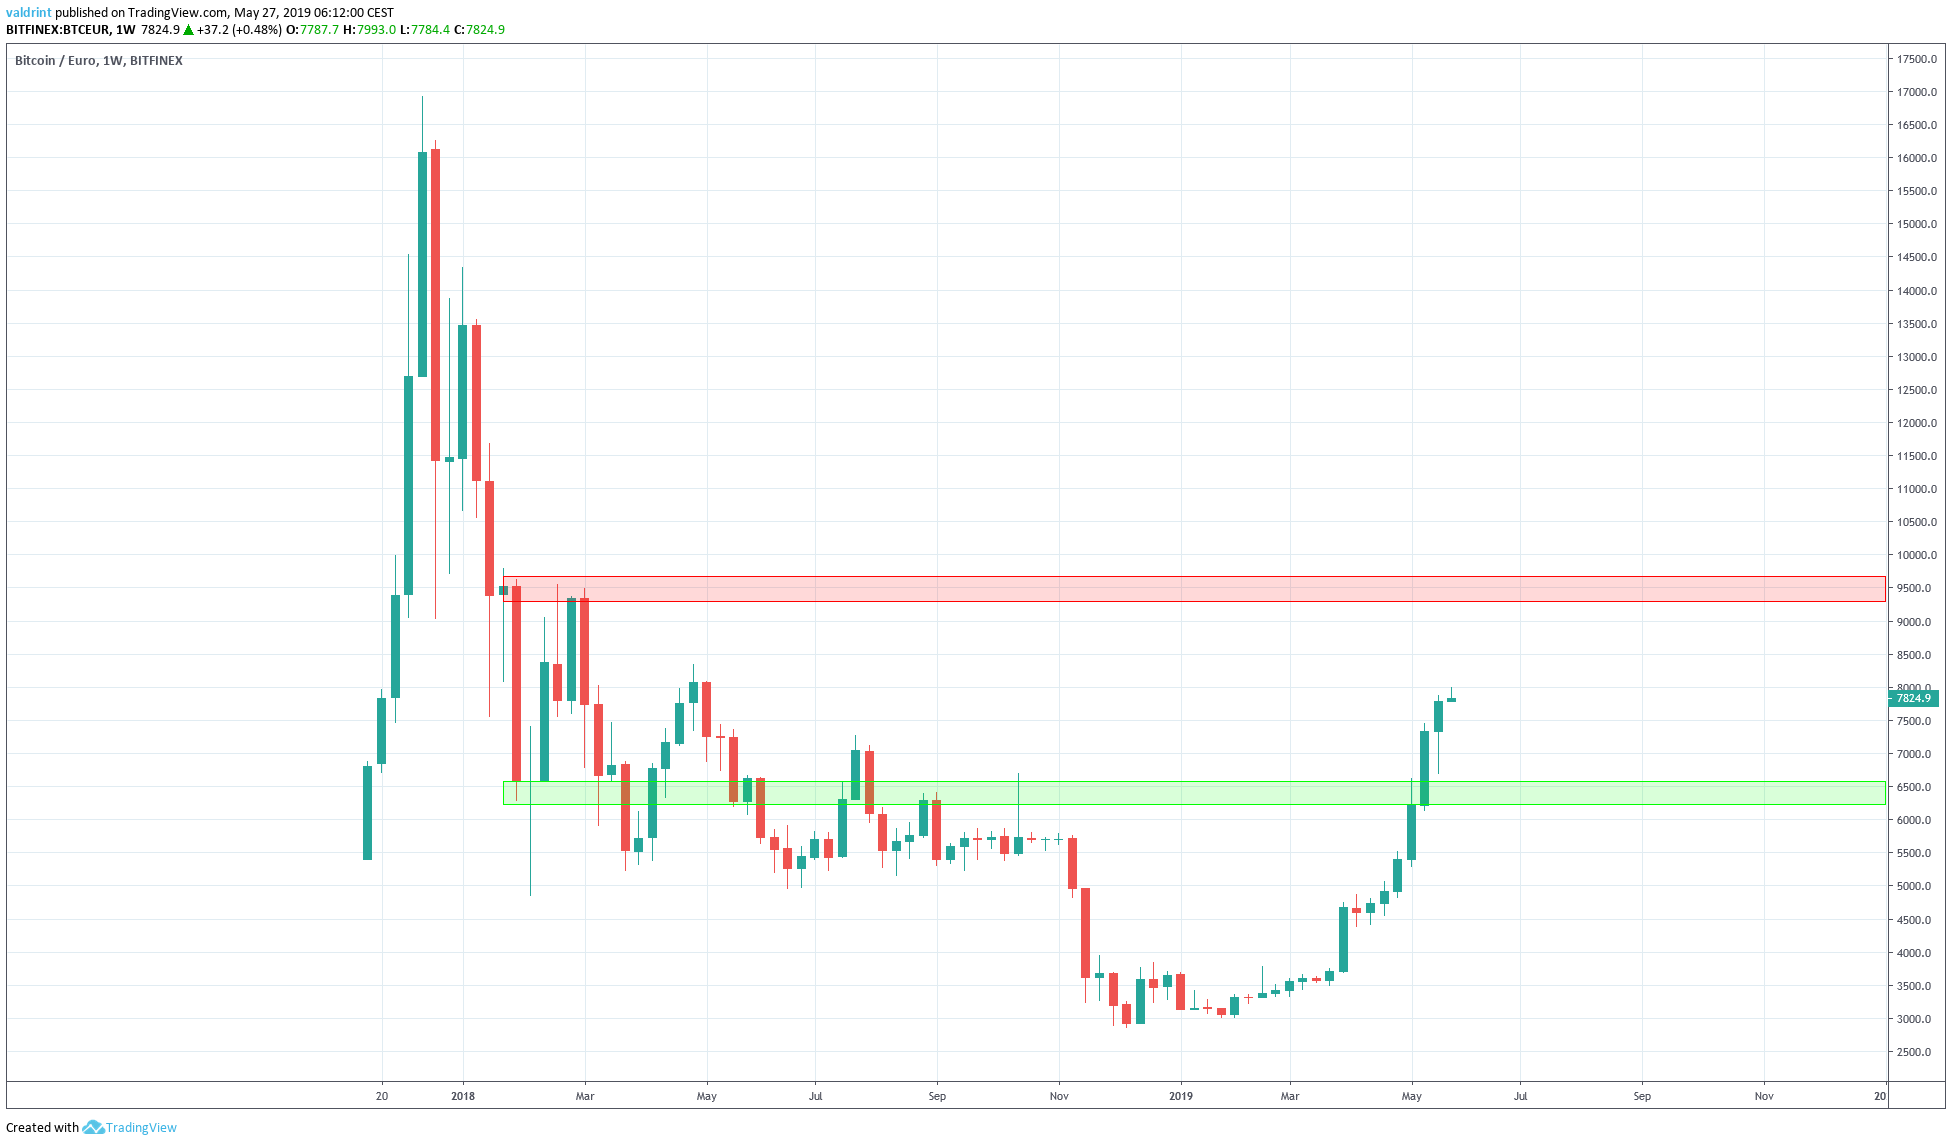
The closest resistance area is found near $10000 and €9500. If the price continues its current movement, it is likely to reach this area. It is worth mentioning that this is the 7th bullish weekly candle in a row. No reversal candlesticks have been created yet. To the contrary, last week’s candle was a bullish hammer.
The closest support area is found near $7200 and €6500. In the short-term, it seems unlikely that the price will reach this area.
Do you think the price of BTC will continue to increase? Let us know your thoughts in the comments below!
Disclaimer: This article is not trading advice and should not be construed as such. Always consult a trained financial professional before investing in cryptocurrencies, as the market is particularly volatile.


