


Bitcoin (BTC) decreased significantly on Jan. 11, reaching a low of $30,402 after opening the day above $38,100.
While Bitcoin has regained some ground today after yesterday’s losses, it’s likely just a retracement in response to the prior downward movement.
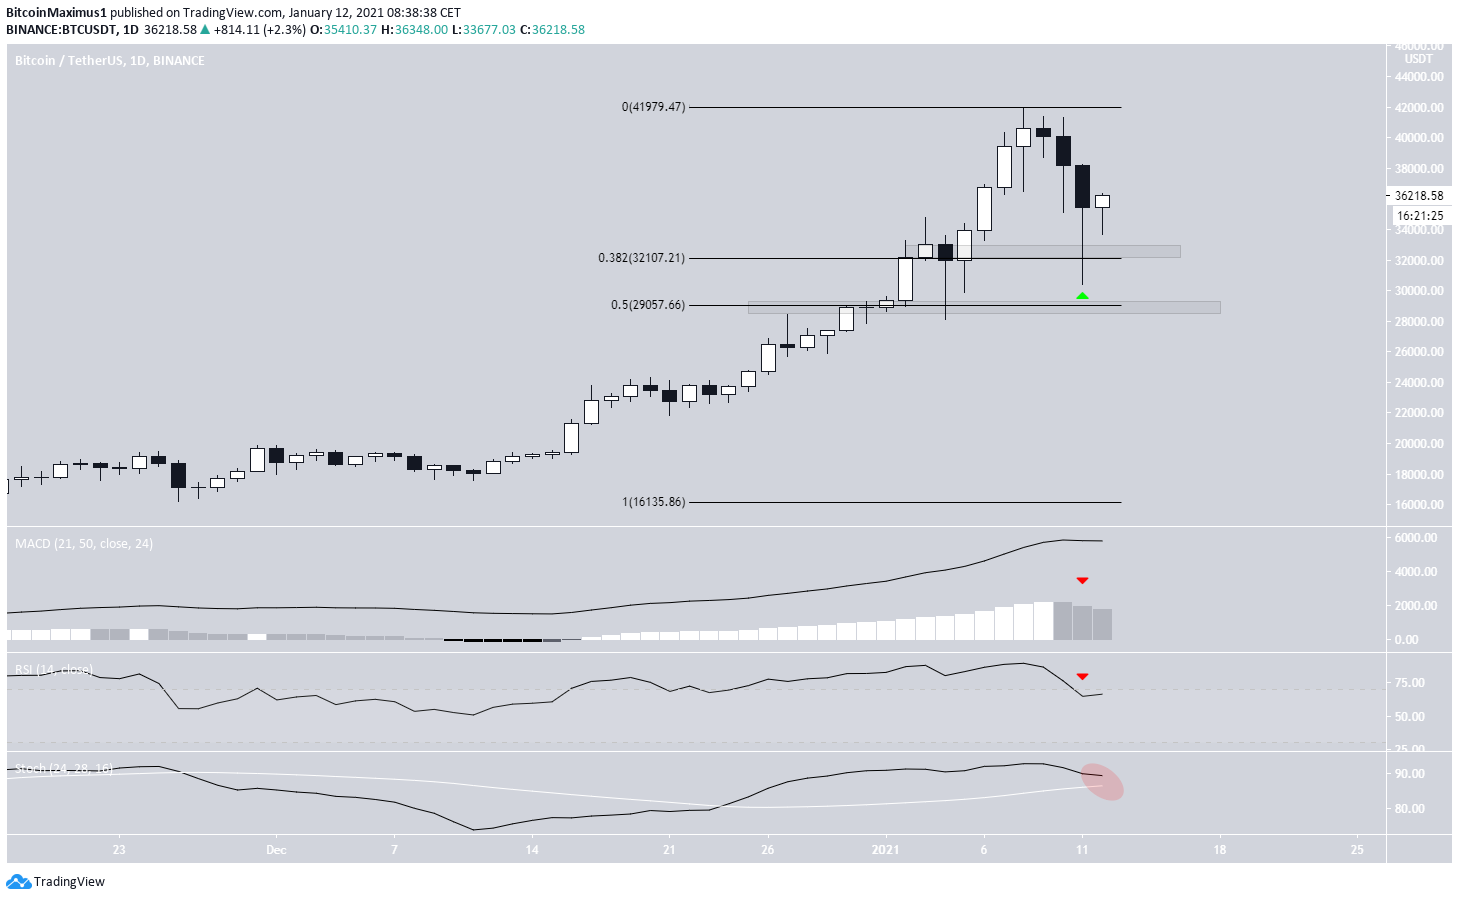
Bearish Bitcoin Daily Reversal
Bitcoin decreased considerably on Jan. 11, continuing the descent that began on Jan. 8 to reach a low of $30,402.
The low took BTC considerably below the 0.382 Fib retracement support area of $32,107. However, the lower prices were bought up quickly, leaving a long lower wick in place, a sign of buying pressure.
At the time of press, BTC was trading near $36,000.
Despite the considerable bounce, technical indicators have turned bearish.
The MACD has created the first pair of successive lower momentum bars since the most recent portion of the upward movement began on Dec. 11. This is a sign of a bearish trend reversal, also strengthened by the fact that the RSI has dropped below 70.
If a bearish cross in the Stochastic oscillator were to occur, it would likely confirm that the trend has turned bearish.
The next support level is found at the 0.5 Fib retracement level at $29,000.
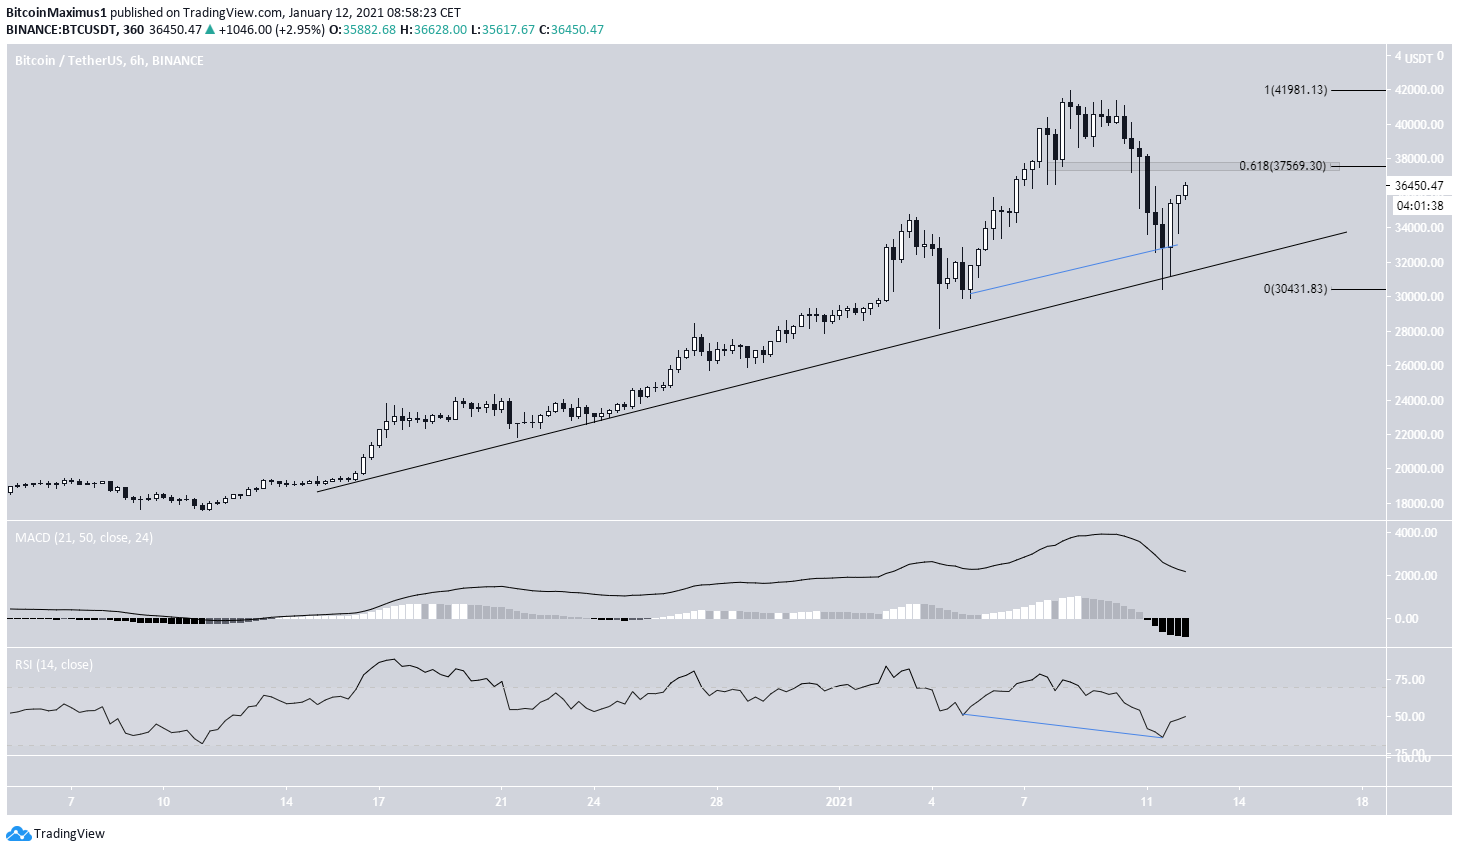
Ascending BTC Support
The six-hour chart shows that BTC also bounced on the ascending support line that has been in place since Dec. 14. Furthermore, the bounce was preceded by a significant hidden bullish divergence in the RSI, a strong sign of trend continuation. Despite this, the MACD is still decreasing.
Bitcoin is approaching the 0.618 Fib retracement level of the entire downward movement, which is expected to provide resistance. Until BTC manages to clear it, we cannot consider the trend bullish.
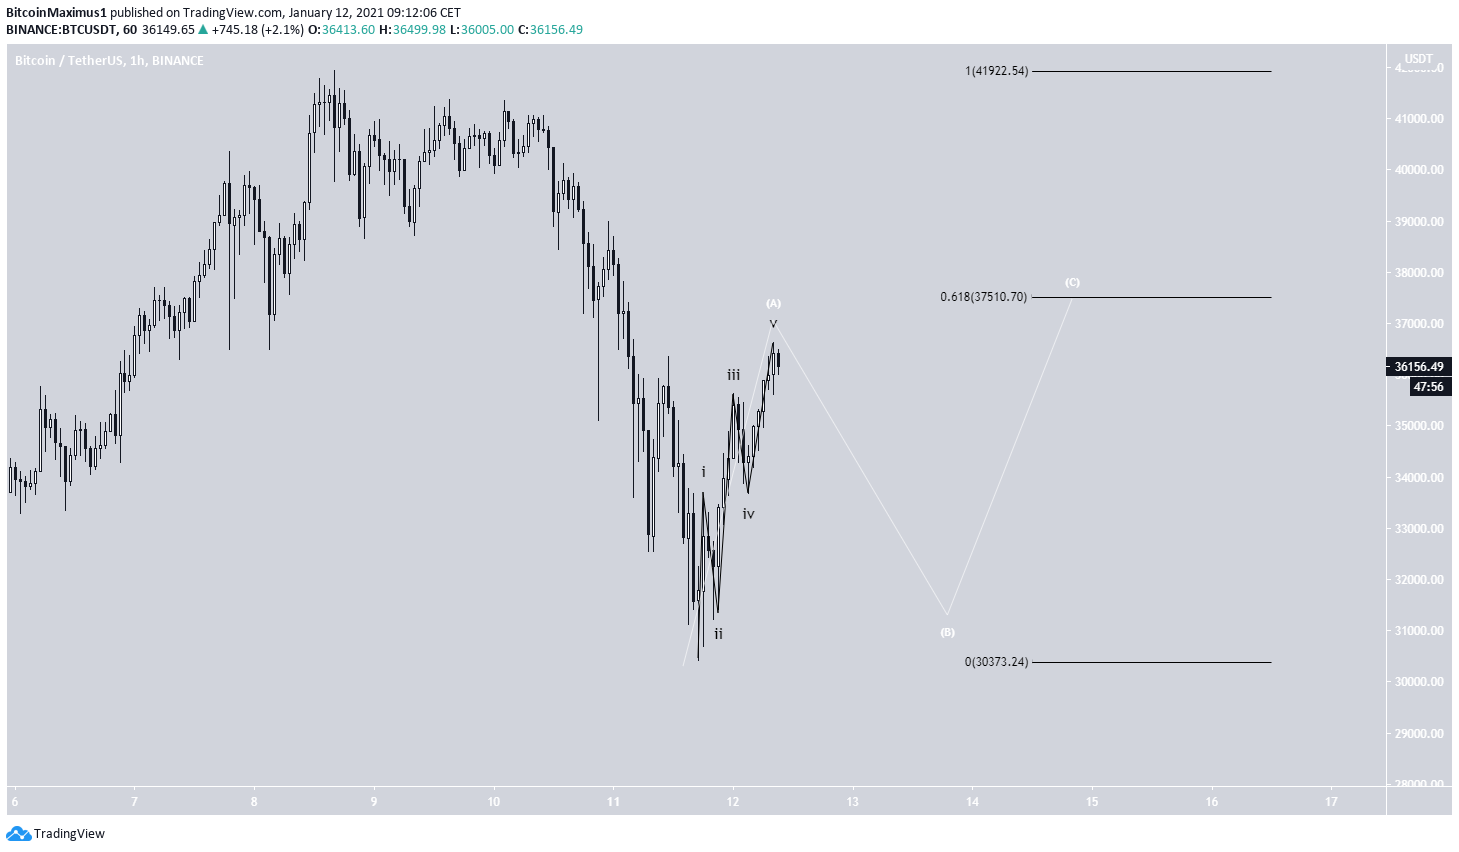
Wave Count
As explained in BeInCrypto’s wave count article from yesterday, BTC has probably begun a longer-term corrective movement.
The bounce from yesterday clearly shows the completion of five waves, a sign of either the beginning of a bullish impulse or the A portion of an A-B-C corrective structure (shown in white below). Due to the possibility of a longer-term correction, the A-B-C correction is more likely.
Therefore, we would expect the retracement to be complete near the 0.618 Fib level before another drop.
Conclusion
Despite today’s retracement, it’s likely that Bitcoin has begun a long-term correction.
For BeInCrypto’s latest Bitcoin (BTC) analysis, click here!
Disclaimer: Cryptocurrency trading carries a high level of risk and may not be suitable for all investors. The views expressed in this article do not reflect those of BeInCrypto.


