


On July 8, the Bitcoin (BTC) price broke out from a descending channel that has been in place since June 1.
While there is a possibility that the price is following a bearish fractal that could soon initiate a sharp drop, the high volume on the breakout suggests that the move might be legitimate.
Bitcoin Bearish Fractal
Cryptocurrency trader @ColdBloodShill noted a bearish fractal, which shows two previous occurrences in which Bitcoin retraced as a result of a rapid sell-off, but continued its drop afterward.
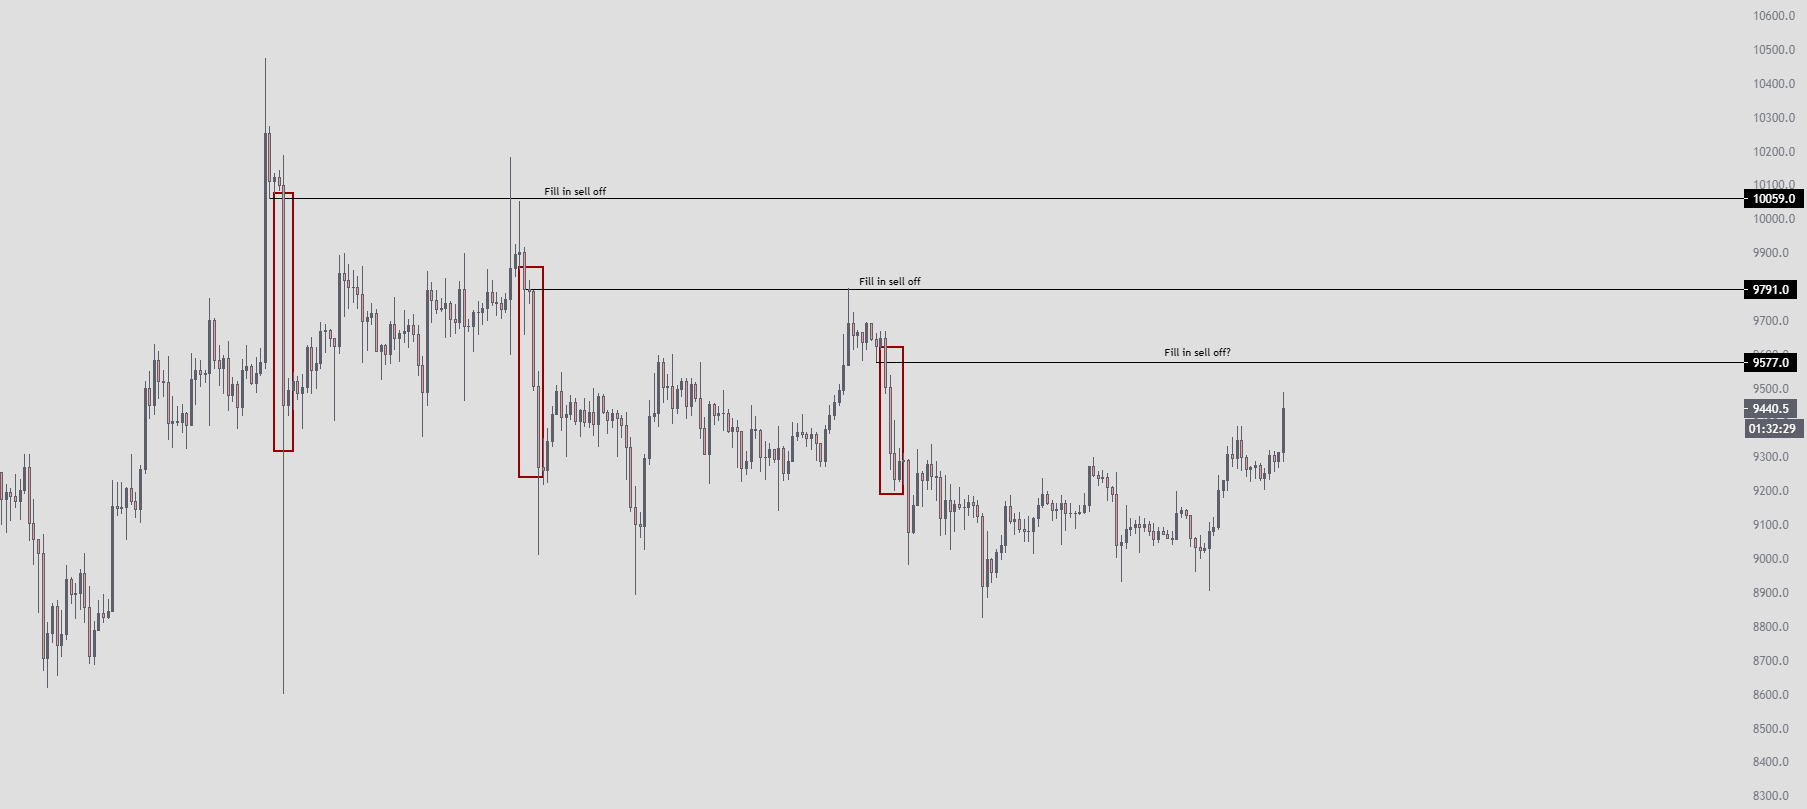
So far, there have been two instances when BTC dropped sharply, before retracing towards an important Fib level and going down again afterward.
The first such instance occurred after the drop from $10,380 on June 1. Afterward, the price gradually retraced, reaching a high of $9,992 on June 10, only slightly above the 0.618 Fib level. This was 1.12% above the most recent high. Afterward, the price dropped sharply once more.
The second decrease is measured from the aforementioned June 10 high of $9,992. After the drop, the price gradually retraced, reaching a high of $9,780 on June 22. This high was slightly above the 0.79 Fib level of the previous decrease. Also, measuring from the most recent high, it was 1.99% above the price during that high.
Therefore:
- In the first drop, the price retraced slightly above the 0.618 Fib level, 1.12% above the recent high
- In the second drop, the price retraced slightly above the 0.79 Fib level, 1.99% above the recent high.
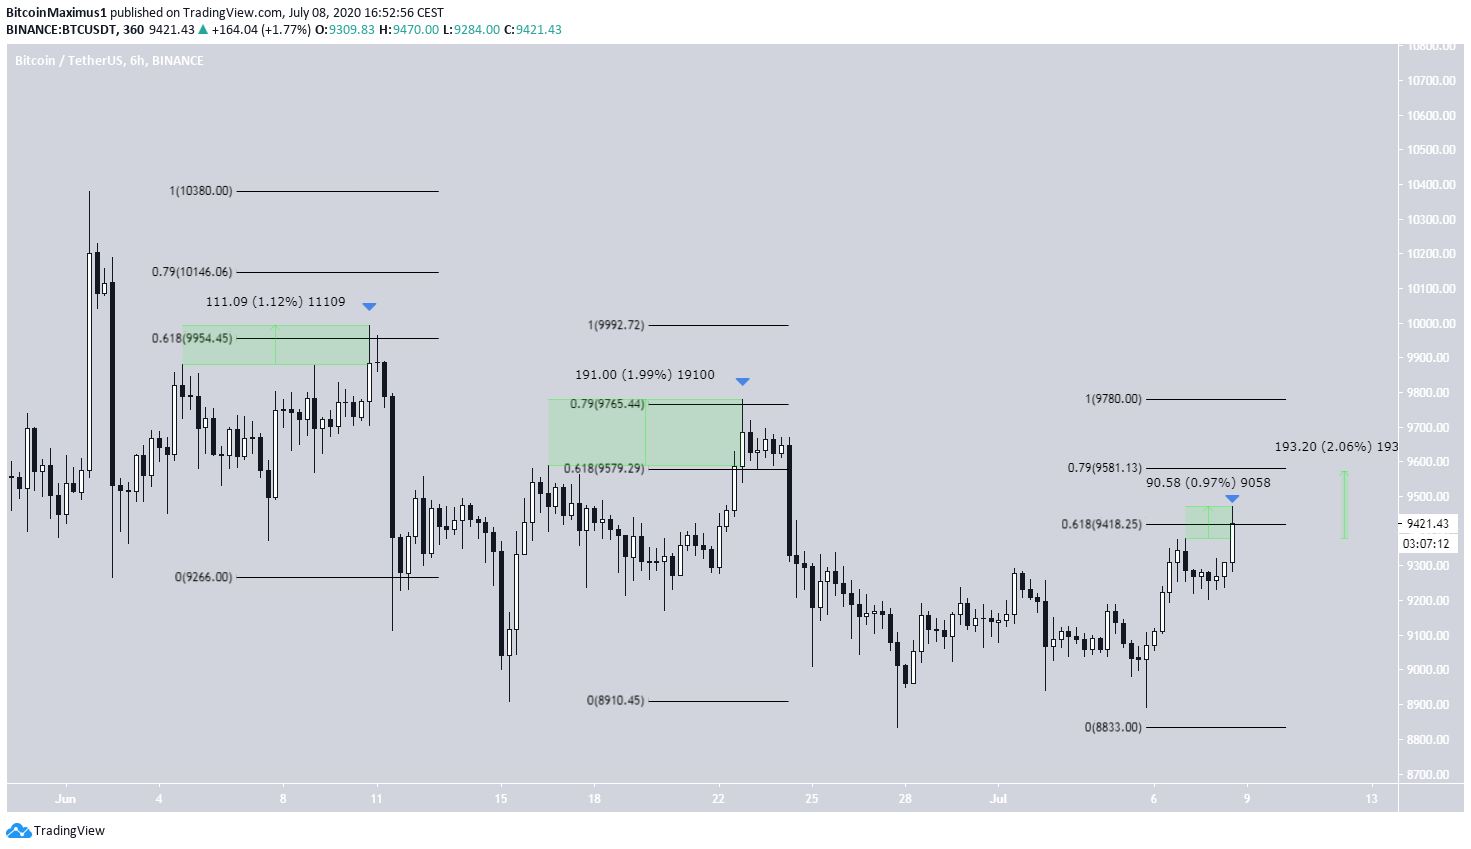
In the current movement, the price has already moved above the 0.618 Fib level but has not reached 0.79 yet. Furthermore, measuring from the recent high, the price has increased by 0.97%.
If the fractal continues to be followed, BTC should reach a high at a maximum of $9,600, which would be slightly above the 0.79 Fib level and 2% above the previous swing high.
If the price goes any higher, the fractal would be invalidated.
Current Breakout
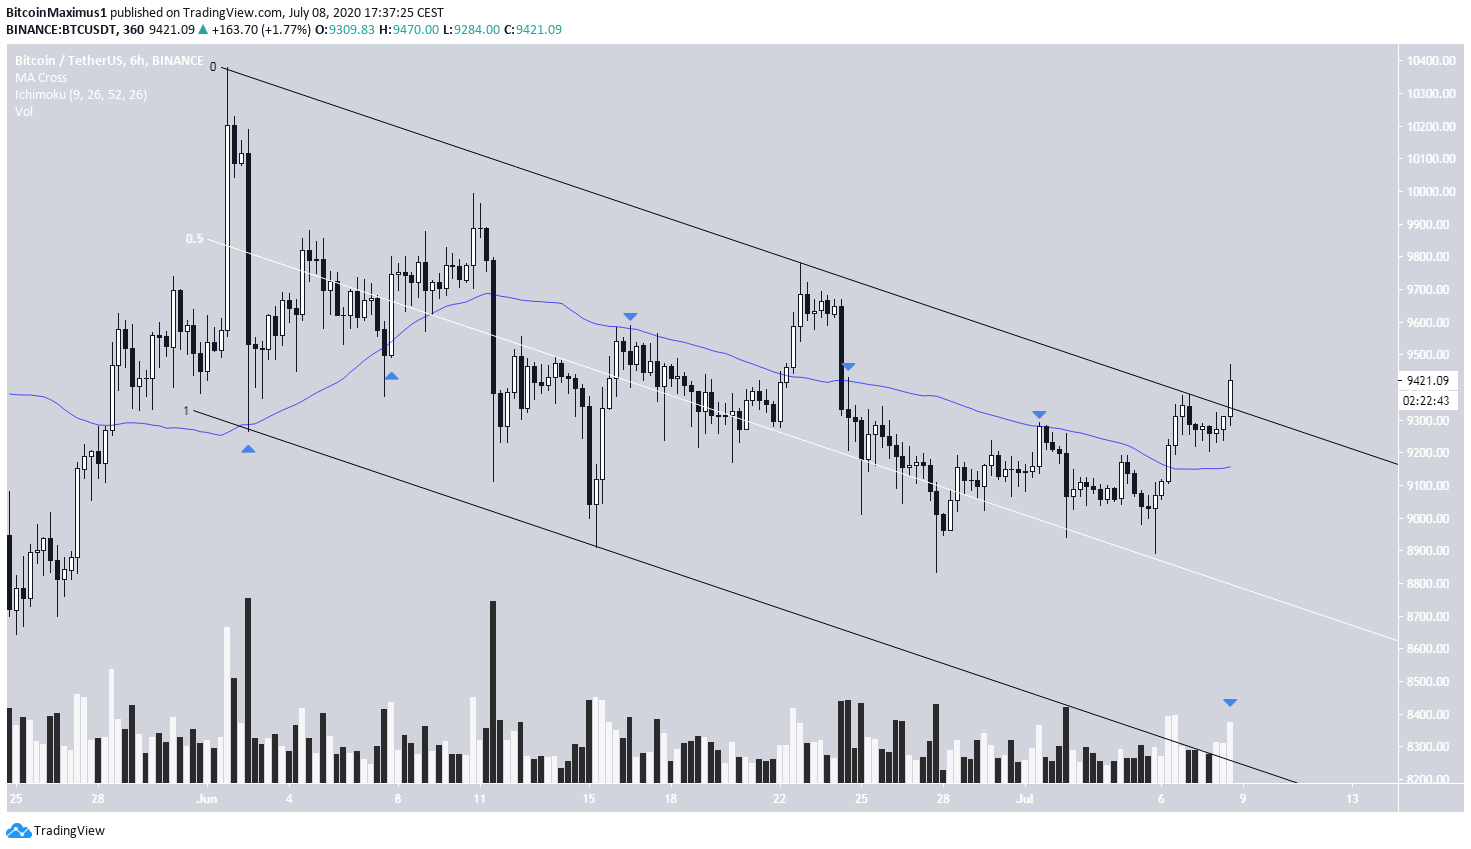
However, the BTC price is in the process of breaking out from a descending channel that has been in place since the June 1 high. The breakout seems legitimate, due to the considerable volume.
Furthermore, the price has moved decisively above its 300-hour moving average (MA), which has been a very good predictor of the trend until now.
If the channel is broken, then the fractal will likely be invalidated, since the bearish structure that has been in place since June 1 would be invalidated.
To conclude, while there is a possibility that BTC is following a bearish fractal, the current breakout casts doubt in its validity. A confirmed breakout would invalidate the fractal.


