


At BeInCrypto, we offer regular price analyses and predictions of the most popular and relevant cryptoassets. This is the second entry in a weekly series in which we compare price fluctuations of Bitcoin (BTC), Ethereum (ETH) Crude Oil, and Solar Power.
In this analysis, we compare the current trading patterns of crude oil, Jinko Solar—the world’s largest solar panel manufacturer, Bitcoin, and Ethereum. We conclude with a summary of our findings where we compare the gains or losses experienced by these four assets over the last week.
To begin, let’s take the price of crude oil.
What’s Going on With Oil?
The price of crude oil (USOIL) is analyzed at one-hour intervals from Apr 21 to May 1 in order to trace the current pattern.
Crude oil reached highs of $66.58 on Apr 23. A gradual decrease followed. After intensifying on Apr 28, the price reached low of $62.26 the next day.
Since then, USOIL has been trading inside a symmetrical triangle:
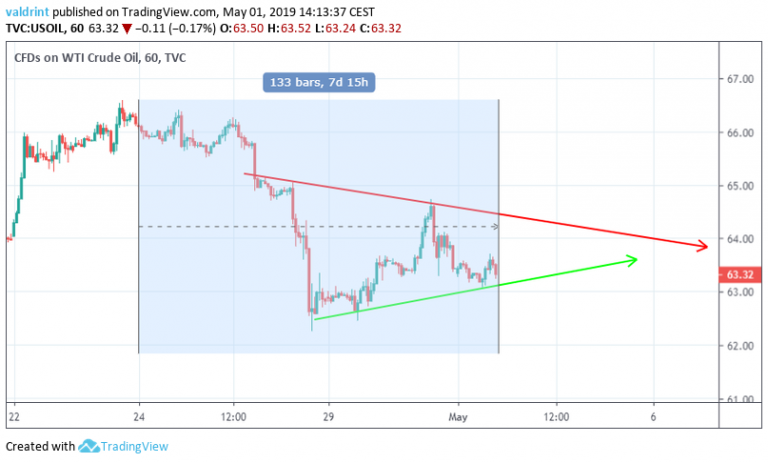
The highlighted part is the price of oil during the week of Apr 24-May 1. During this period, USOIL has experienced price decreases.
At the time of writing, the price was trading near $63.30.
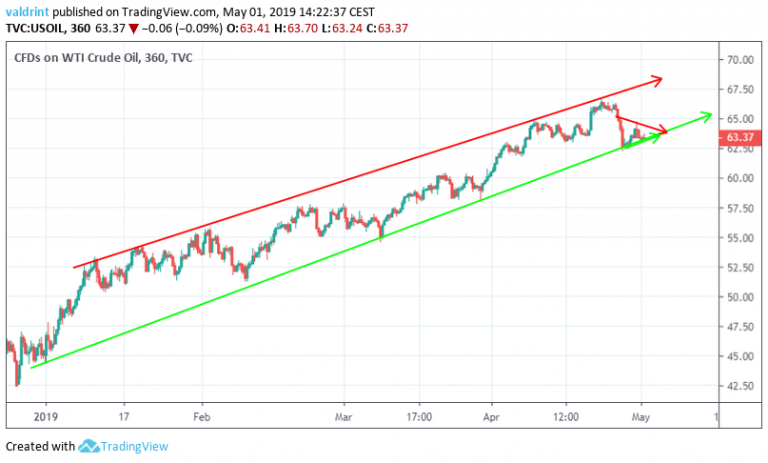
It is worth mentioning that the price is trading inside a long-term ascending channel since the beginning of 2019. A breakdown below the support line of the triangle would also mean that a breakdown below the long-term channel has occurred.
This could initiate a rapid price decrease.
The long-term 2019 channel is shown in the graph below:
What About Solar Energy?
The price of Jinko Solar (JKS) is analyzed at one-hour intervals from Mar 26 to May 1 in order to trace the current pattern:
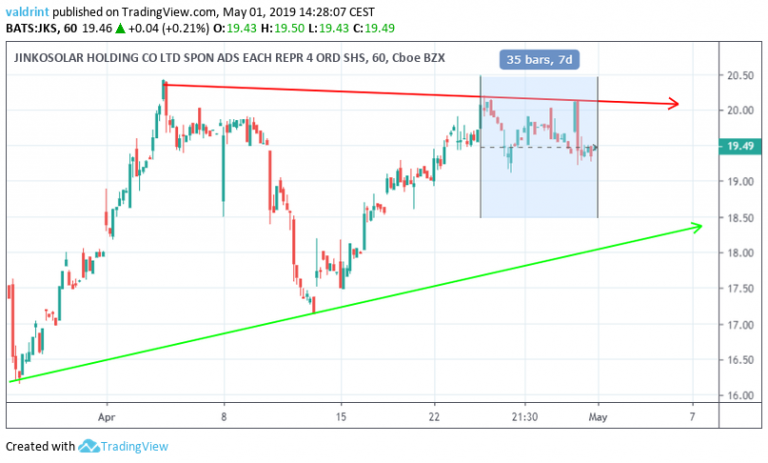
The price of JKS reached a low of $16.15 on Mar 26. A rapid upward move began and the price reached a high of $20.43 on Apr 3. A gradual decrease dropped it to $17.19 on Apr 14. It has been increasing since.
The highlighted part is the price of JKS during the week of Apr 24- May 1 during which it has experienced significant price decreases.
At the time of writing, the price was trading near $19.50.
A Look at Bitcoin
The price of BTC/USD is analyzed at six-hour intervals from Apr 3 to May 1 in order to determine Bitcoin’s current trading pattern:
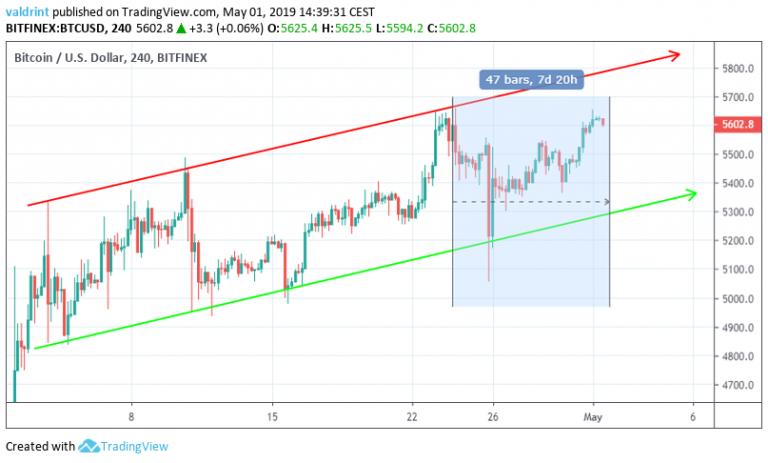
On Apr 2, a massive spike caused Bitcoin to break out of its previous trading pattern. The price reached a high of $5335.50 the following day.
Since then, the price has been trading inside an ascending channel. The highlighted part is the price of BTC during the week of Apr 24- May 1 during which it has seen price increases.
At the time of writing, the price is trading close to $5600, near the middle of the channel.
And Finally, Ethereum
ETH on Bitfinex is analyzed at four-hour intervals from Apr 5 to May 1 in the graph below:
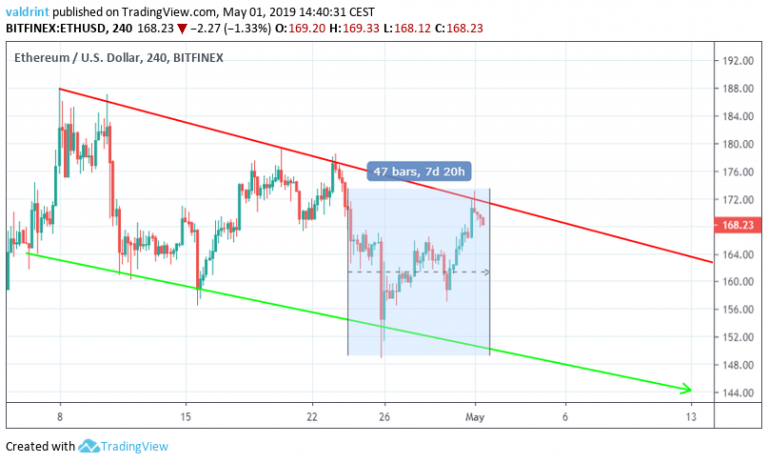
The price of Ethereum made a high of $184 on Apr 8. It reached a similar level on Apr 9, creating a double top pattern. A sharp decrease ensued, and the price dropped to the support line on Apr 11. It recovered slightly before falling back to the resistance four days later.
Thereafter, a gradual increase took Ethereum to $176. These higher lows give us the resistance line required to complete the descending channel.
SImilar to the double top on Apr 9, the price decreased sharply, dropping to lows of $148 on Apr 26. The price has been increasing since.
The highlighted part is the price of ETH during the week of Apr 24- May 1 during which it has seen price decreases.
It is currently trading near $168, close to the resistance line of the channel.
Summary
The price fluctuations of ETH (Candlesticks), BTC (blue line), JKS (yellow line) and Oil (purple line) are now compared at one-hour intervals from Apr 24 to May 1 in the graph below. The right-hand scale presents the percentage increase/decrease of the three assets during this period.
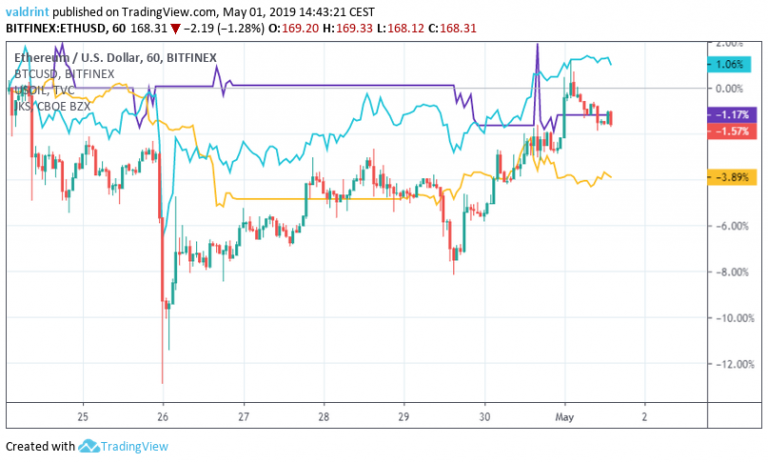
The price of BTC has enjoyed a gradual increase. However, the price dropped sharply during Apr 26. It was the only one of the four assets which enjoyed positive growth.
Therefore, Bitcoin is our winner, with a growth rate of 1.06%.
The price of oil did not enjoy significant fluctuations in our measuring period. Until Apr 30, it had the highest rate of growth, but a sharp decrease dropped it to 2nd place. Oil had a negative growth rate of -1.17% during our measuring period.
Ethereum saw losses similar to oil and finished the measuring period with a decrease of -1.57%.
JKS was our biggest loser, decreasing by 3.89%.
It appears as if the price of Ethereum is mirroring that of BTC. However, the fluctuations have been larger. This has been especially true during the sharp drop on Apr 26.
The price of oil was characterized by slow movement without significant volatility while the price of JKS has enjoyed significant volatility. Furthermore, based on its position inside its trading pattern, further decreases may be in store.
Therefore, the presence of price volatility is not exclusive to the cryptocurrency industry. However, as evidenced in the drop of Apr 26, the magnitude of short-term decreases in cryptocurrencies is still dissimilar to other industries.
Interested in 2019, 2020, and 5 year Bitcoin price predictions? Click on the blue button below:
Disclaimer: This article is not trading advice and should not be construed as such. Always consult a trained financial professional before investing in cryptocurrencies, as the market is particularly volatile.


