


![Bitcoin Analysis for 2020-03-05 [Premium Analysis]](/_mfes/post/_next/image/?url=https%3A%2F%2Fassets.beincrypto.com%2Fimg%2FG0SY2neQj3rhw9joTrSqmEN2byo%3D%2Fsmart%2Fa0ca440b7e4a4024aa234c9e47c13341&w=1920&q=75)
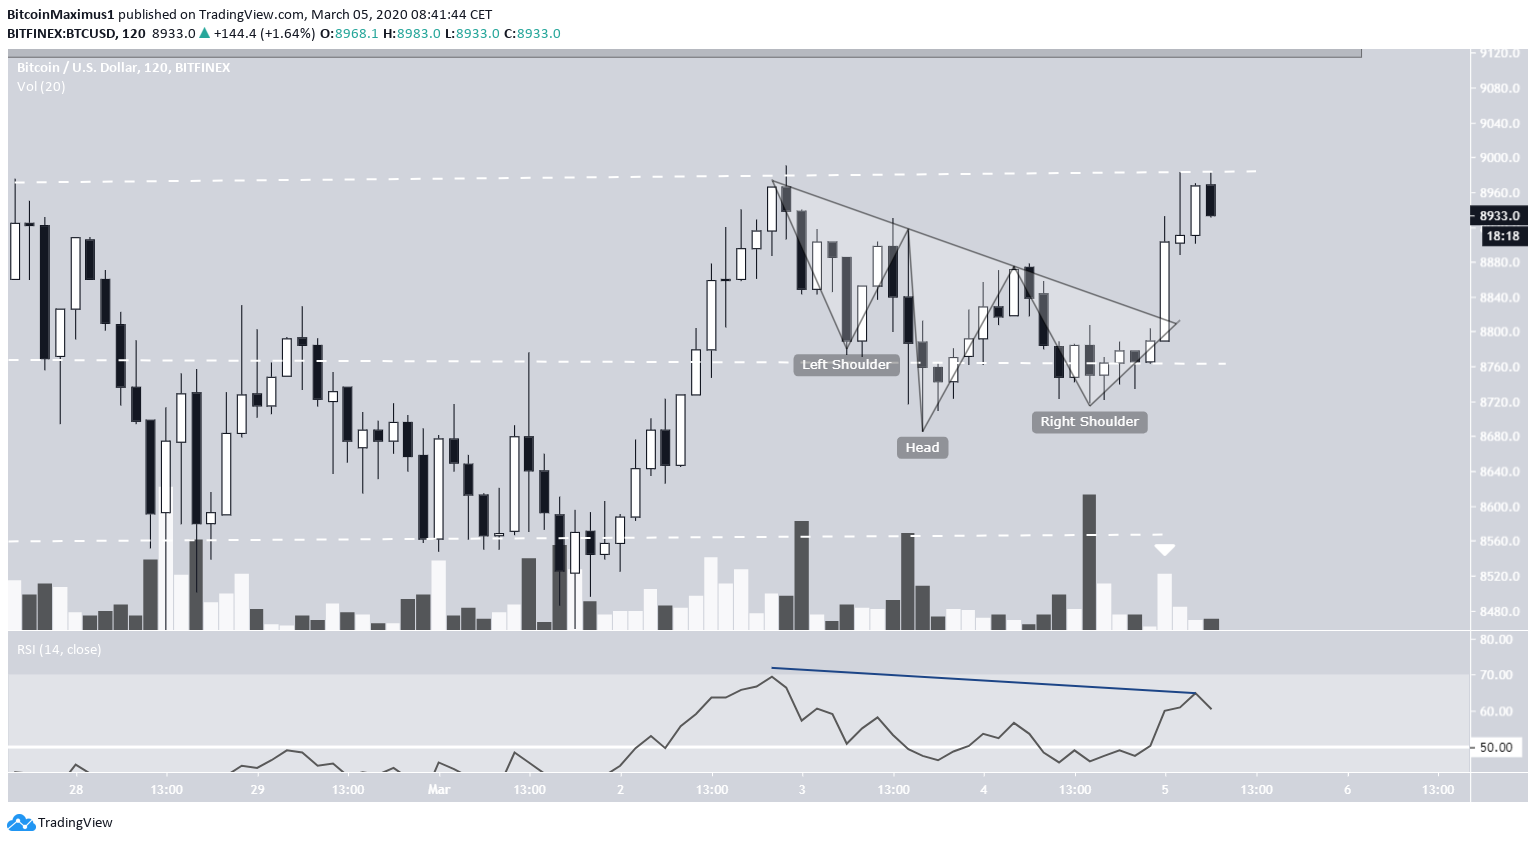
On March 4, the Bitcoin price initiated a rapid increase that caused it to break out from an inverse head and shoulders pattern and move above its 50 and 200-hour moving averages (MA).
Bitcoin (BTC) Price Highlights
- The Bitcoin price is trading in a range of $8,550-$8,975.
- It has reached the top of the range.
- The price broke out from an inverse head and shoulders pattern.
- There is resistance at $9,150.
- An hourly golden cross has transpired.
Short-Term Range
The BTC price has been trading in a range between $8,550-$8,975 since Feb 28, having validated both the resistance and support lines numerous times. Currently, the price is trading right at the resistance line of this range.
The BTC price is trading above both the 50- and 200-hour moving averages (MA), which have just made a bullish cross. Late last night, the BTC price pumped towards the resistance line, causing it to move above these MAs and them to make a bullish cross.
If the price breaks out, the next resistance area is found at $9,150.

Looking closer, we can see that the price has also broken out above an inverse head and shoulders pattern.
However, concerns are raised since the volume was quite weak, and there has been bearish divergence developing. But, this is not sufficient to say that the price will not break out from this range. It may also continue consolidating for some more time prior to breaking out.
Future Movement
We could be seeing the development of an ascending triangle before the price breaks out to $9,150.
While the possible ascending support line is not confirmed, the ensuing retracement should give it a clearer slope.
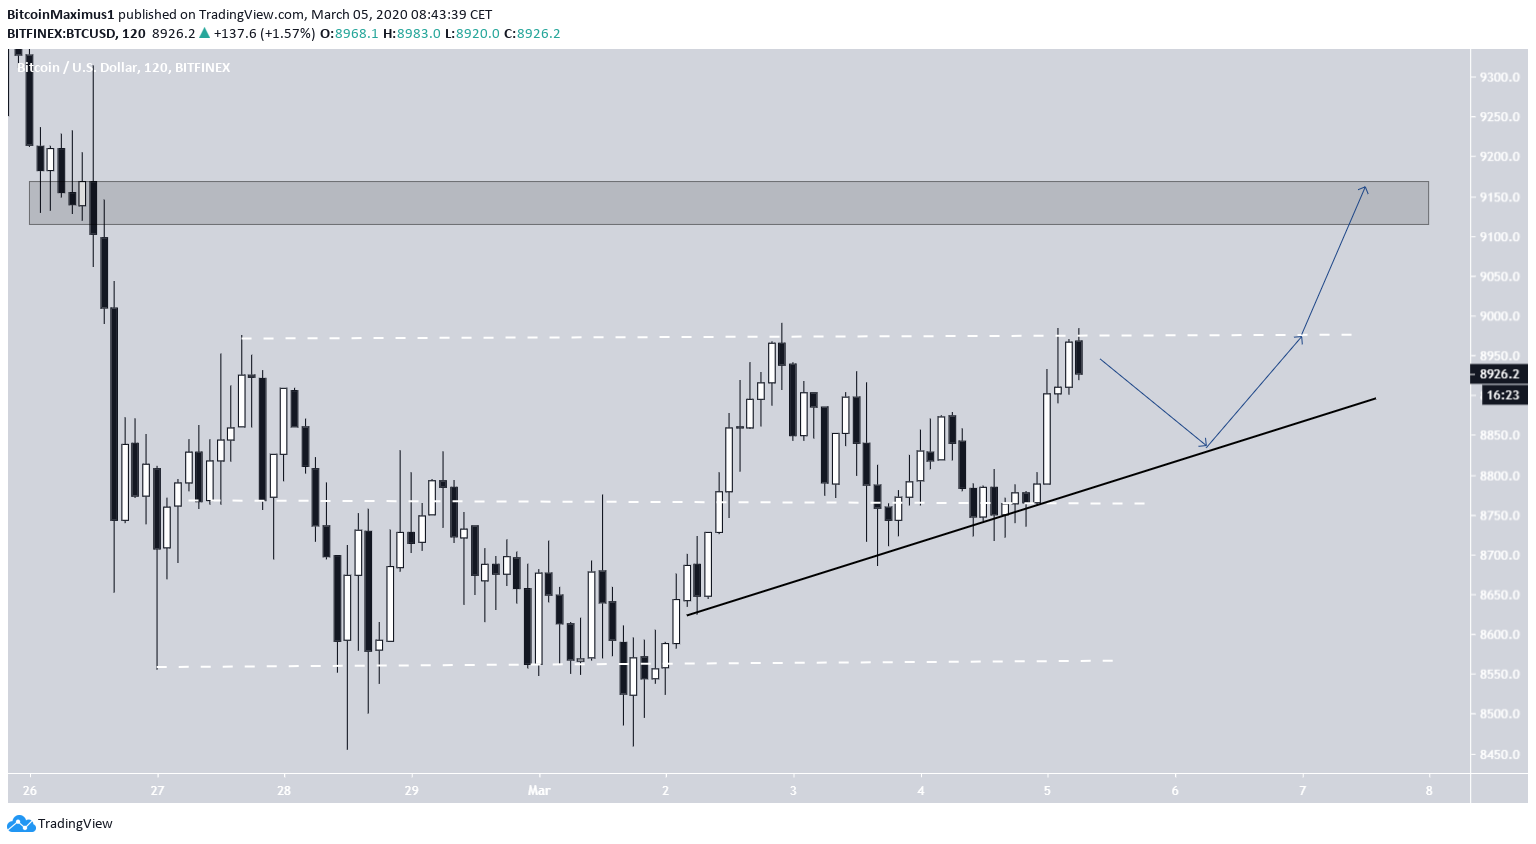
To conclude, the Bitcoin price has begun an upward move after bouncing above significant hourly MAs and breaking out from an inverse head and shoulders pattern. After some more consolidation, it is expected to break out and reach the next resistance area at $9,150.
For those interested in BeInCrypto’s previous Bitcoin analysis, click here.


