


![Bitcoin Analysis for 2020-02-24 [Premium Analysis]](/_mfes/post/_next/image/?url=https%3A%2F%2Fassets.beincrypto.com%2Fimg%2FfKV8mGhLAn3cuXEWDsLK71e5VFs%3D%2Fsmart%2F9b88bd7385a74c91bd4eec3fb1712157&w=1920&q=75)
The Bitcoin price has been increasing since reaching the support line of its descending channel on February 20. The increase has gone above customary retracement levels.
Bitcoin Price Highlights
- The Bitcoin price created a weekly doji candlestick.
- It is following an ascending support line.
- The price has flipped the $9,650 level as support.
- The price is trading inside a short-term descending channel.
Trading Range
Over the past week, the Bitcoin price did not move significantly. Rather, it created a small bullish doji candlestick. Therefore, since the bullish engulfing weekly candlestick of February 3-10, the price has been slowly decreasing but has yet to create a significant candlestick.
While the fact that the price rebounded nicely from the early week decrease is bullish, we cannot disregard the fact that it has failed to even re-test the $10,500 level, which is currently the main resistance area.
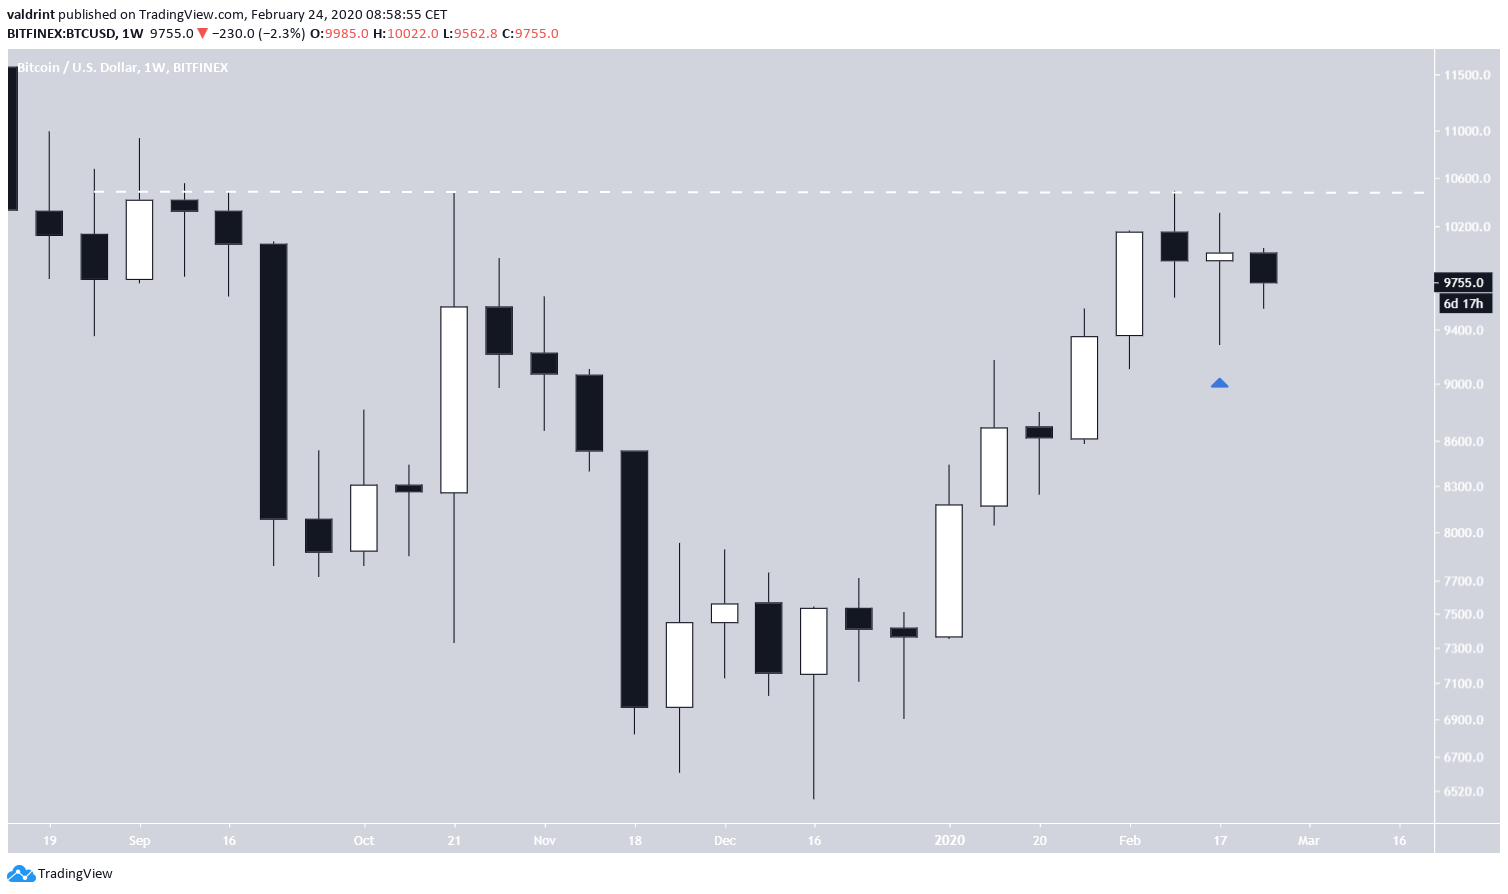
Since December 2019, the Bitcoin price has been trading in a range with the main support/resistance areas at:
- $10,500
- $9,650
- $9,150
- $8,700
- $8,250
- $7,650
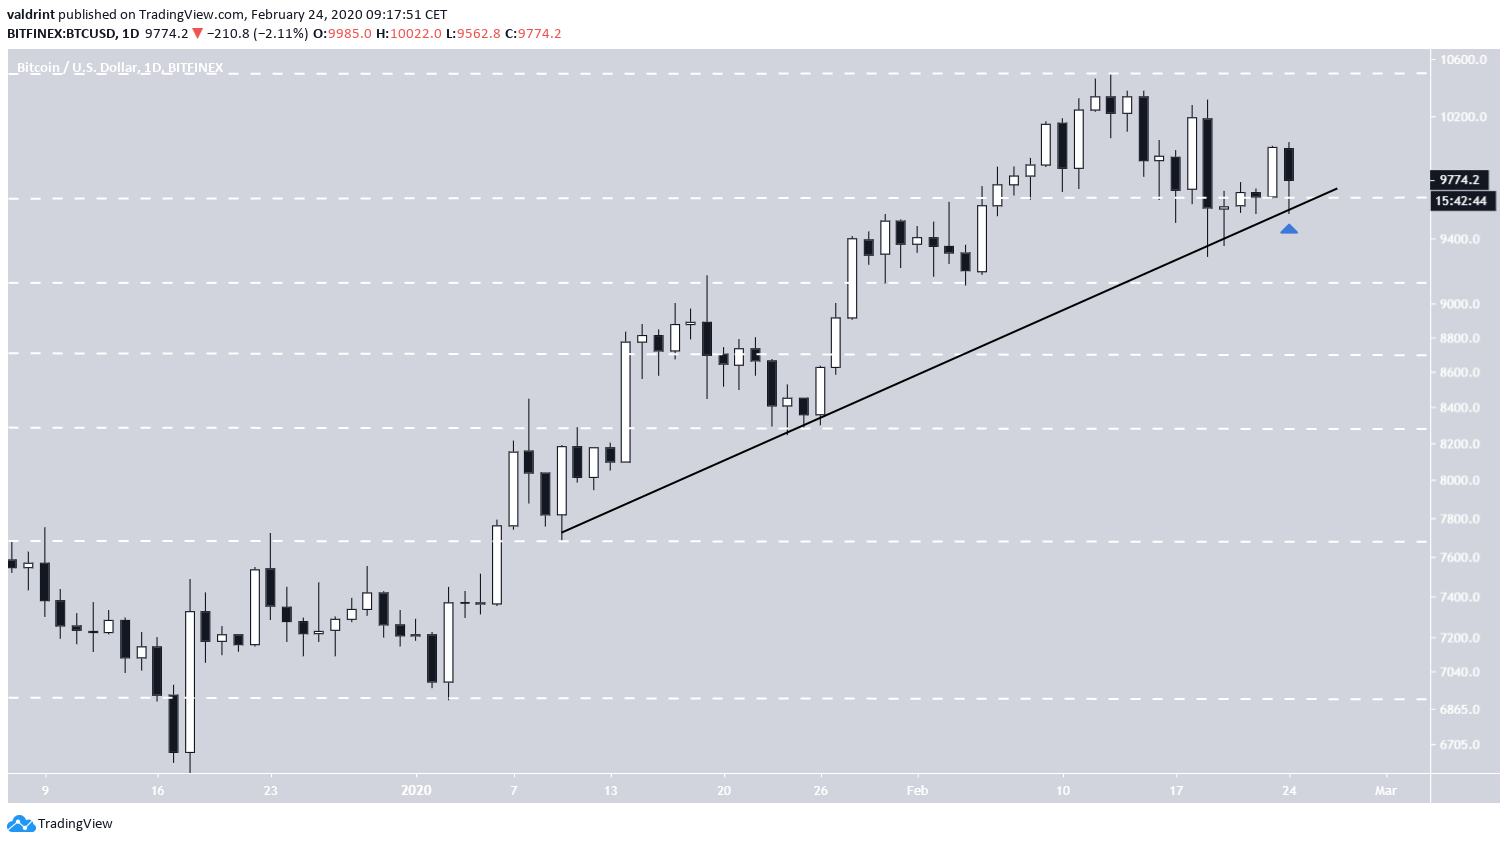
The BTC price successfully flipped the $9650 level as support with a bullish engulfing candlestick on February 23 and validated it afterward with a long lower wick on the current daily candlestick.
Also, it is possible that the price is following an ascending support line, having just bounced on it for the fourth time. As long as the ascending support line is intact, we are expecting the price to increase at its rate. A breakdown from this line would likely take the price to $9150.
Descending Channel
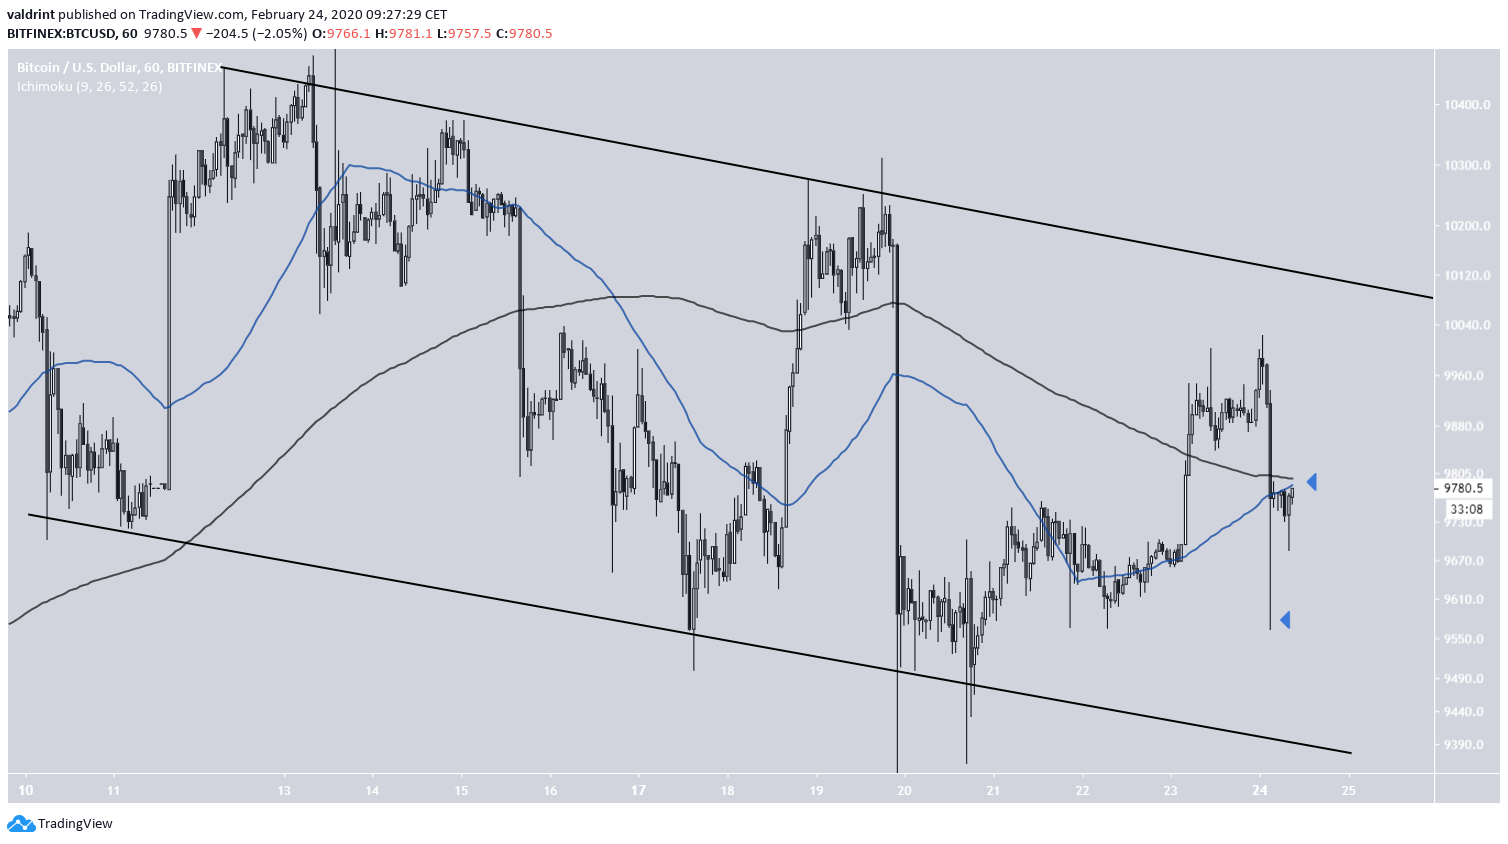
The Bitcoin price has been trading inside a descending channel since February 10. It has been increasing since reached the support line of the channel on February 20.
The 50- and 200-hour moving averages (MAs) are very close to making a bullish cross. Even though the price is trading below them, it is only doing so slightly and could soon flip them as support.
In addition, we can see buying pressure in the form of a considerably long lower wick.
Looking closer at the increase since February 20, we can see that the Bitcoin price has moved all the way to the 0.786 Fib level, which is more than a retracement usually goes. Therefore, this is likely a new upward move.
Also, the price has found support above the $9700 level. The most likely movement is an increase in the resistance line.
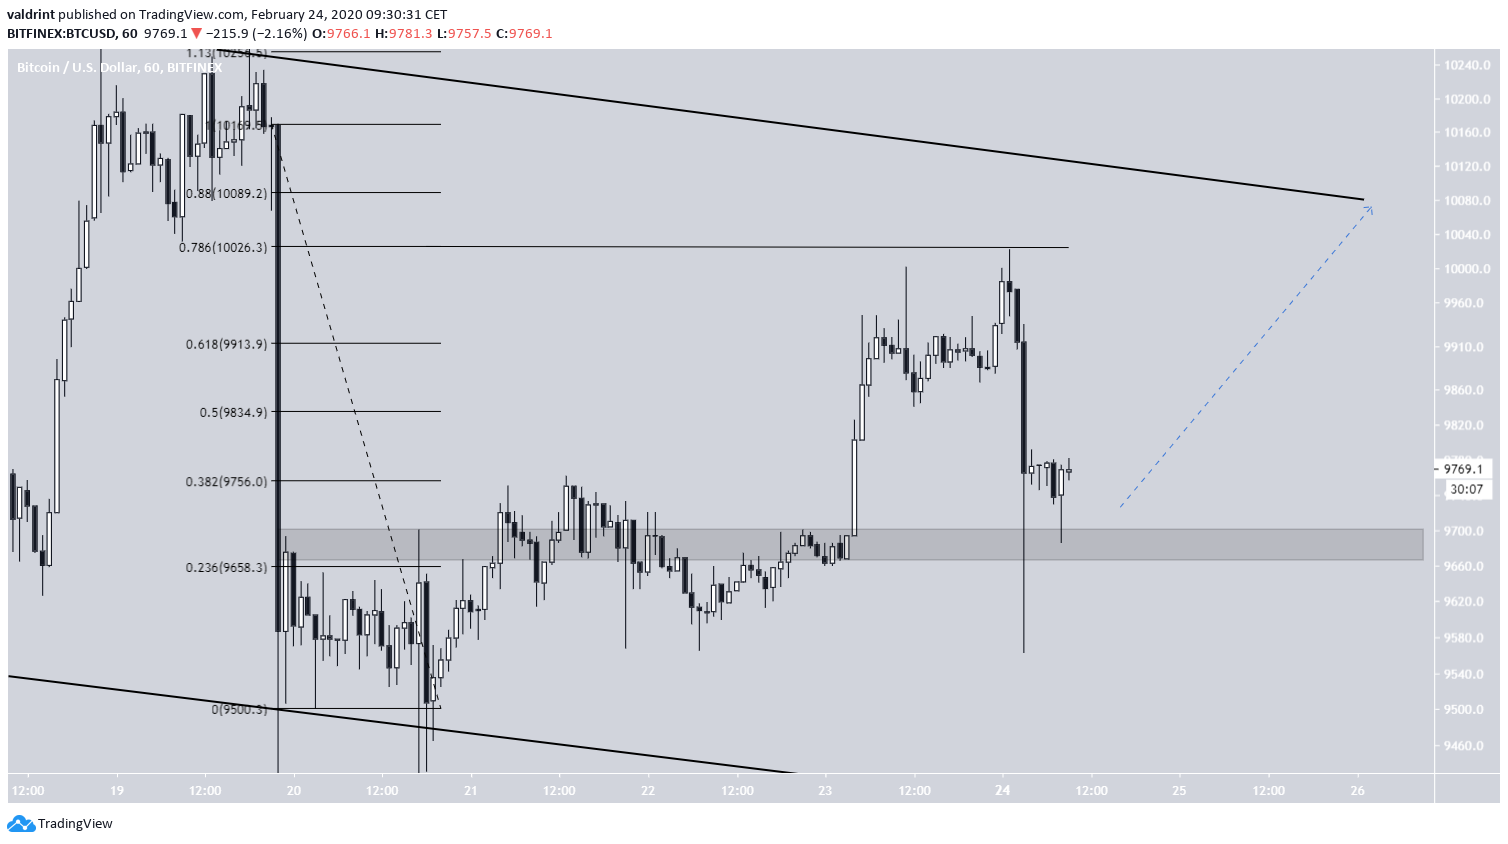
To conclude, the Bitcoin price is trading inside a descending channel and has been increasing since February 10. We believe it is likely to reach the resistance line of the channel at $10,100.
For those interested in BeInCrypto’s previous Bitcoin analysis, click here.


