


![Bitcoin Analysis for 2020-01-24 [Premium Analysis]](/_mfes/post/_next/image/?url=https%3A%2F%2Fassets.beincrypto.com%2Fimg%2FLwHbIG7OGN5FownqgCWd0fj5j8g%3D%2Fsmart%2Fd77b30e58ed14b1e8b6c952c3483150e&w=1920&q=75)
Bitcoin Price Highlights
- The Bitcoin price broke down from a range of $8,550-$8,750.
- The RSI successfully completed a failure swing top.
- The RSI broke down from a descending triangle.
- There is minor support at $8,350 and $8,000.
- There is major support near $7,700.
Bitcoin Range Breakdown
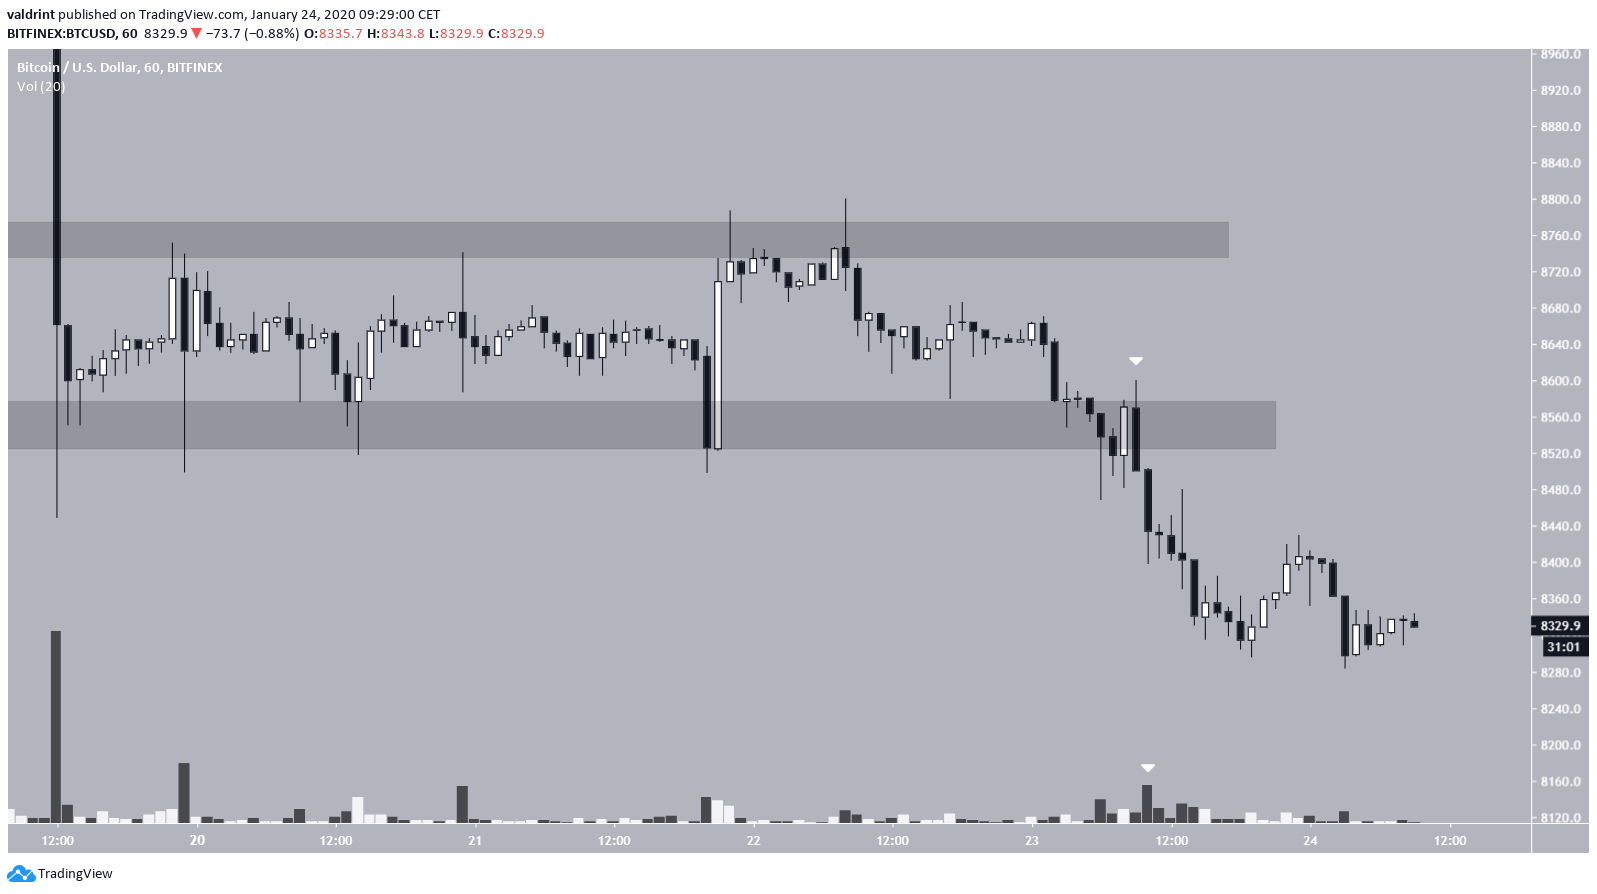
Since the breakdown from the wedge on Jan 19, the Bitcoin price traded in a range between $8,550-$8,750, validating both the support and resistance areas several times.
On Jan 23, the BTC price broke down from this range. While the breakdown was valid, it did not transpire with significant volume.
The price has been decreasing since and has made what resembles a double-bottom near $8,300.
Future Movement
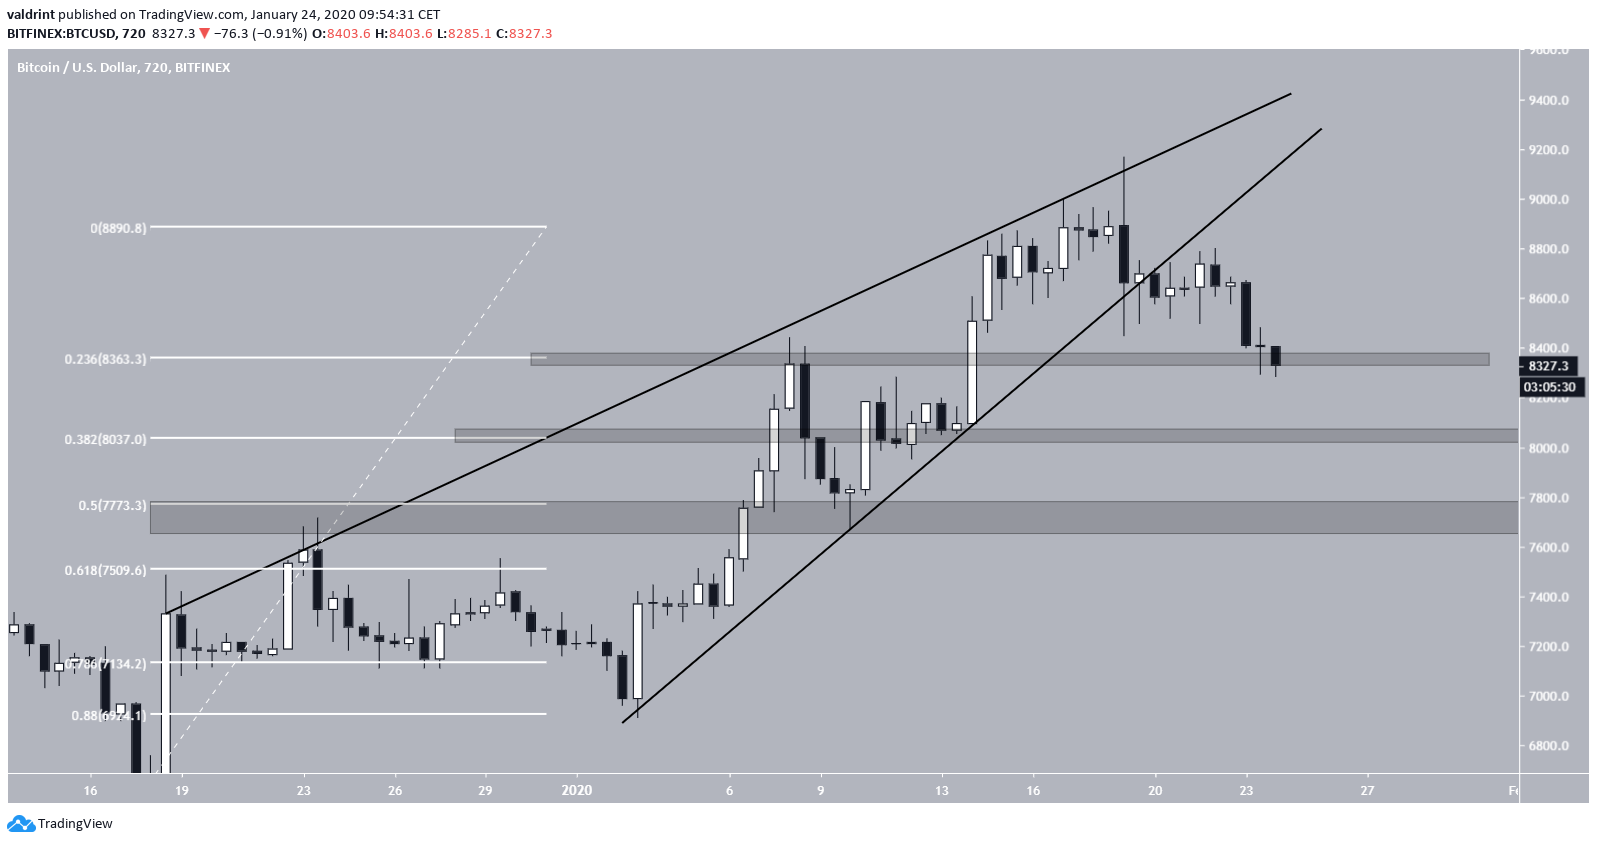
Looking at the wedge breakdown, we can see that the price is right at the 0.236 fib level of the entire upward move. This is also a previous high, so it would make sense for the price to find some support here, but it’s likely that it won’t be sufficient for a complete reversal.
There is minor support at the 0.382 fib level at $8,000 and major support at the 0.5 fib level between $7,700-$7,800.
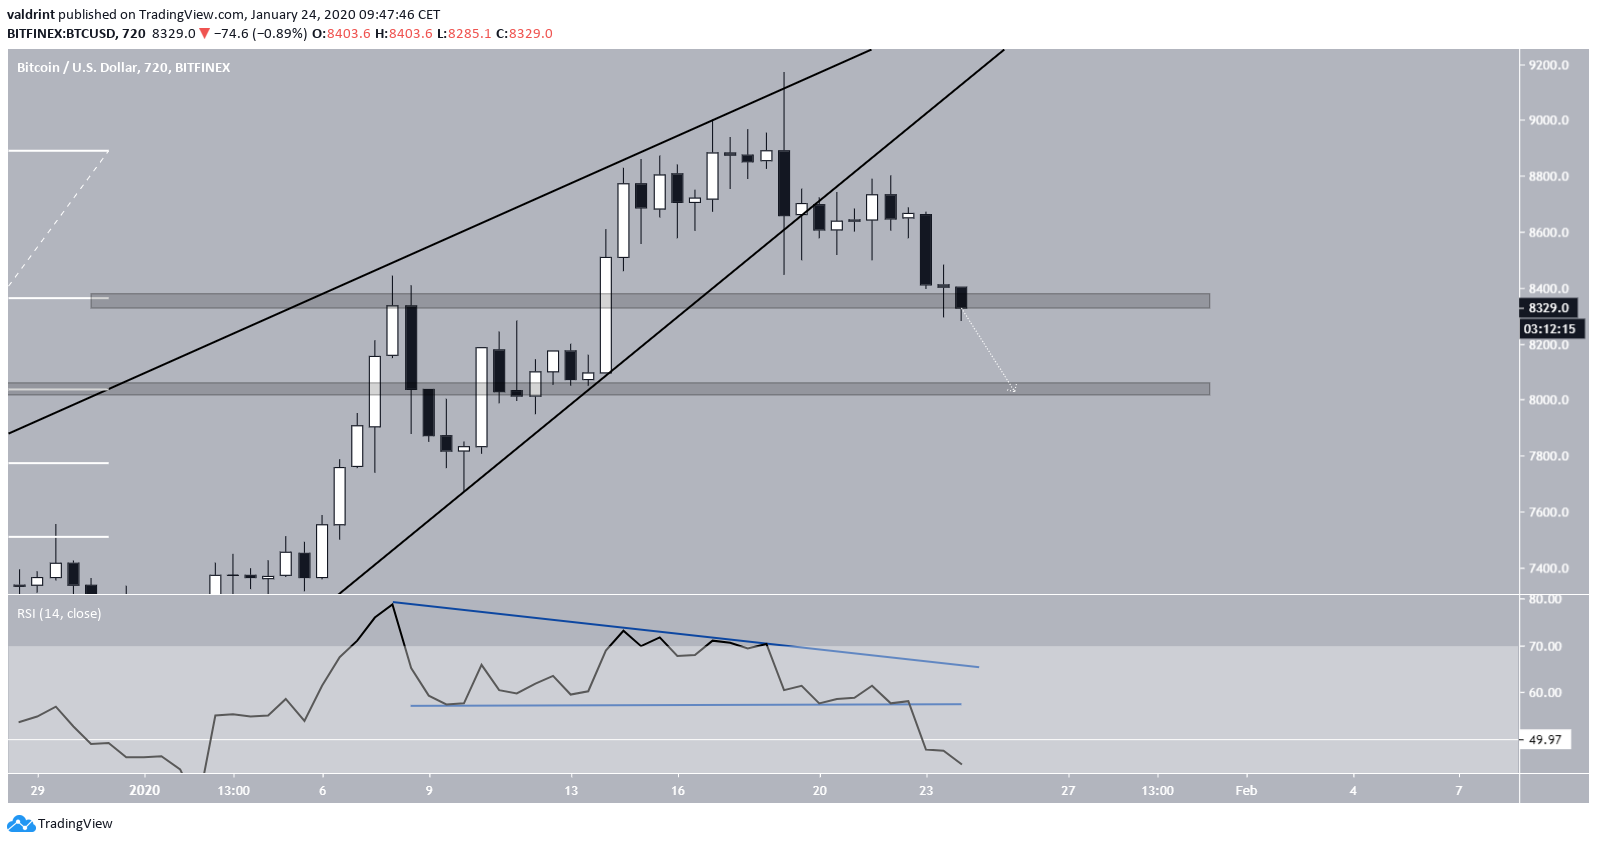
The RSI supports this price decrease. The breakdown from the wedge was preceded by bearish divergence. Afterward, the RSI created a descending triangle out of which it broke down yesterday.
Furthermore, it has fallen below the 50, so a corrective period towards at least one of the support areas mentioned is to be expected.
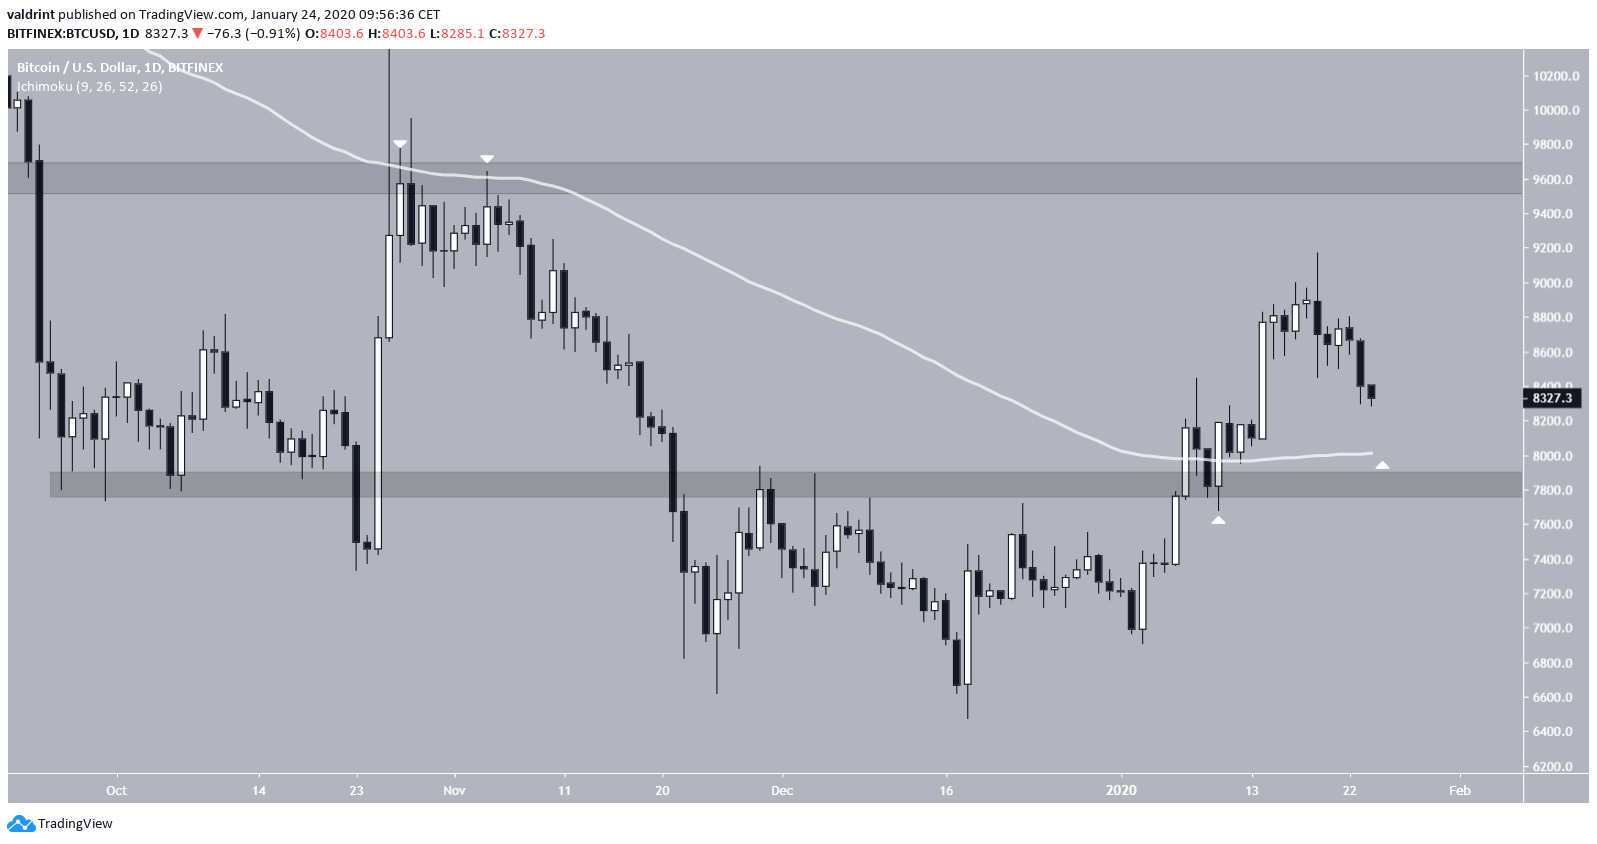
The daily chart better reveals the significance of each support area. The $8,000 support is strengthened by the presence of the 100-day moving average (MA).
On the other hand, the $7,700 mark was the previous breakout level and has acted as support in the past. Therefore, the price is most expected to reverse at one of these levels.
To conclude, the Bitcoin price has continued losing ground after the price broke down from an ascending wedge on Jan 19. The ensuing RSI pattern breakdown supports this decrease and indicates that it will continue until the price reaches $8,000, and could possibly continue back to $7,700.


