Bitcoin Price Highlights
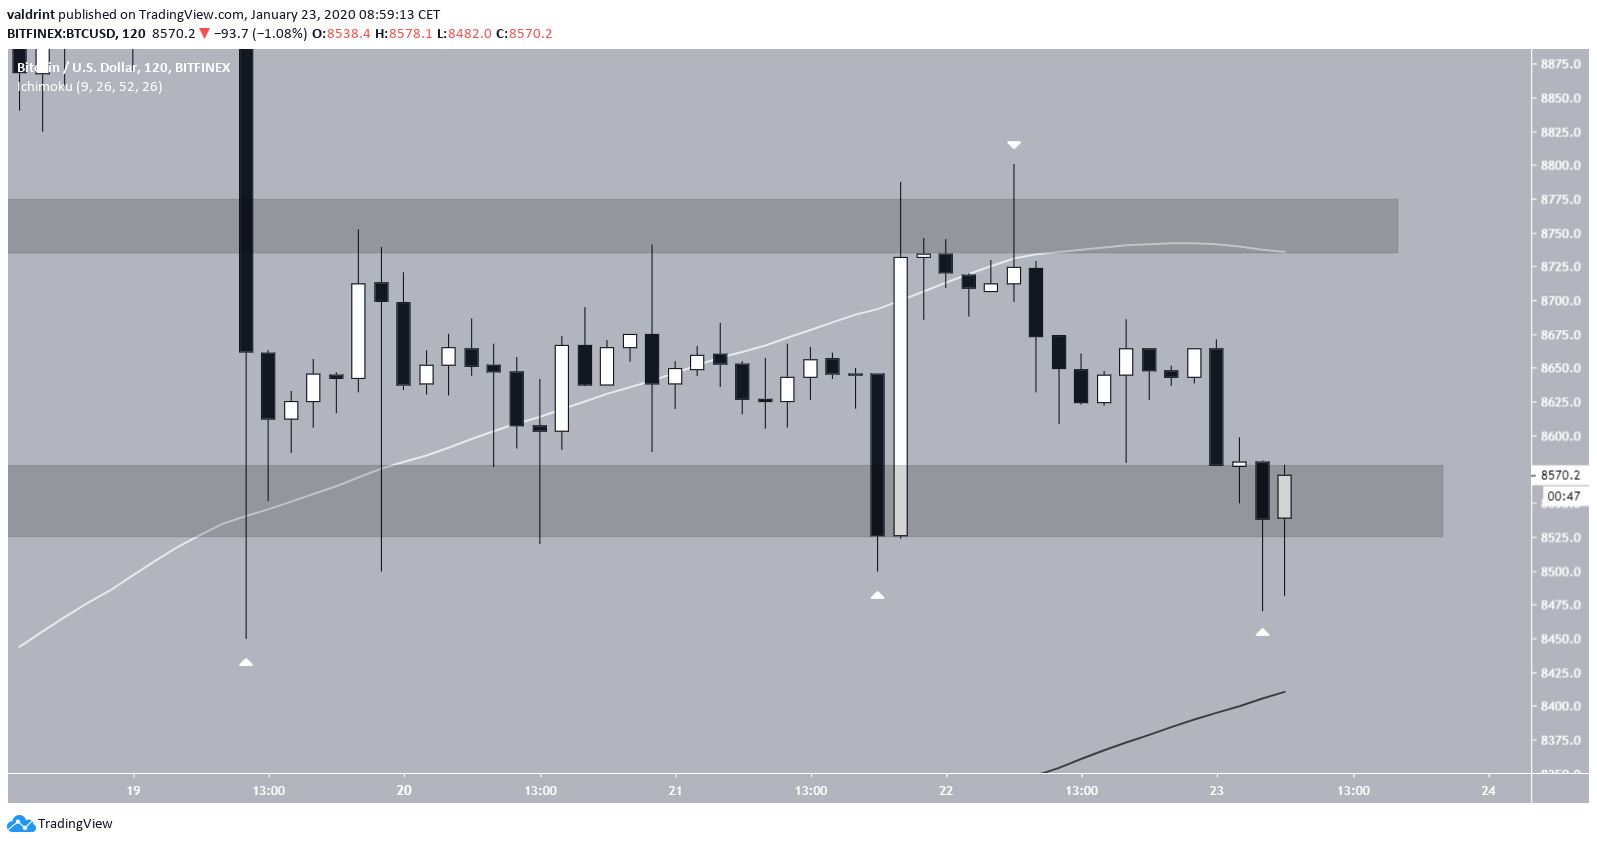
- The Bitcoin price is trading inside a short-term range between $8550-$8750.
- The price is trading between the 200- and 400-hour moving averages.
- Technical indicators are undecided, slightly leaning on bearish.
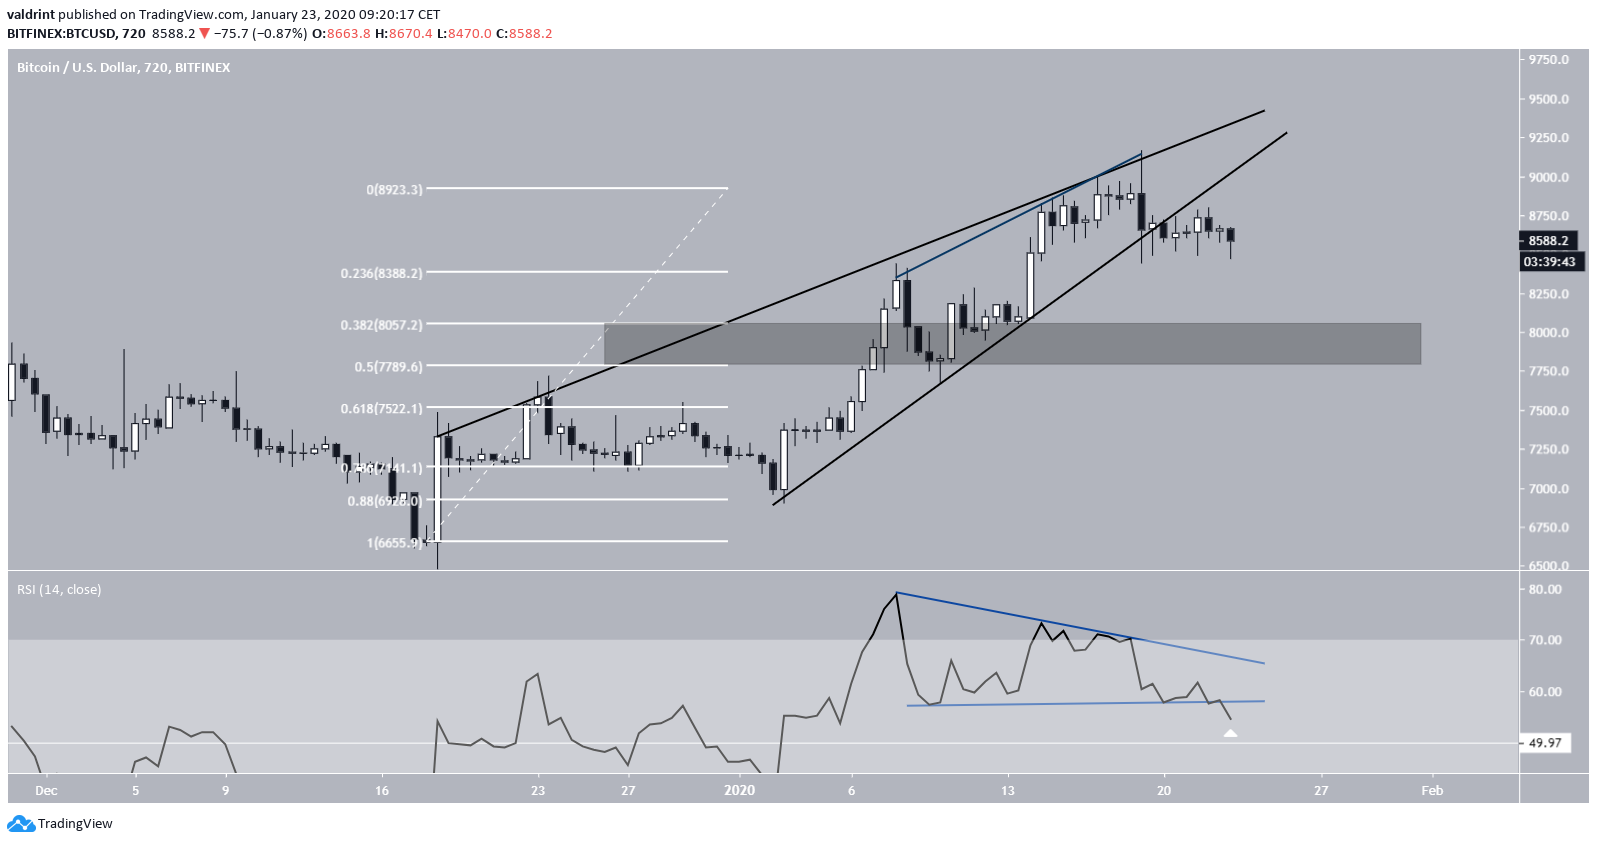
- There is long-term support at $7700-$8000.
Trading Range
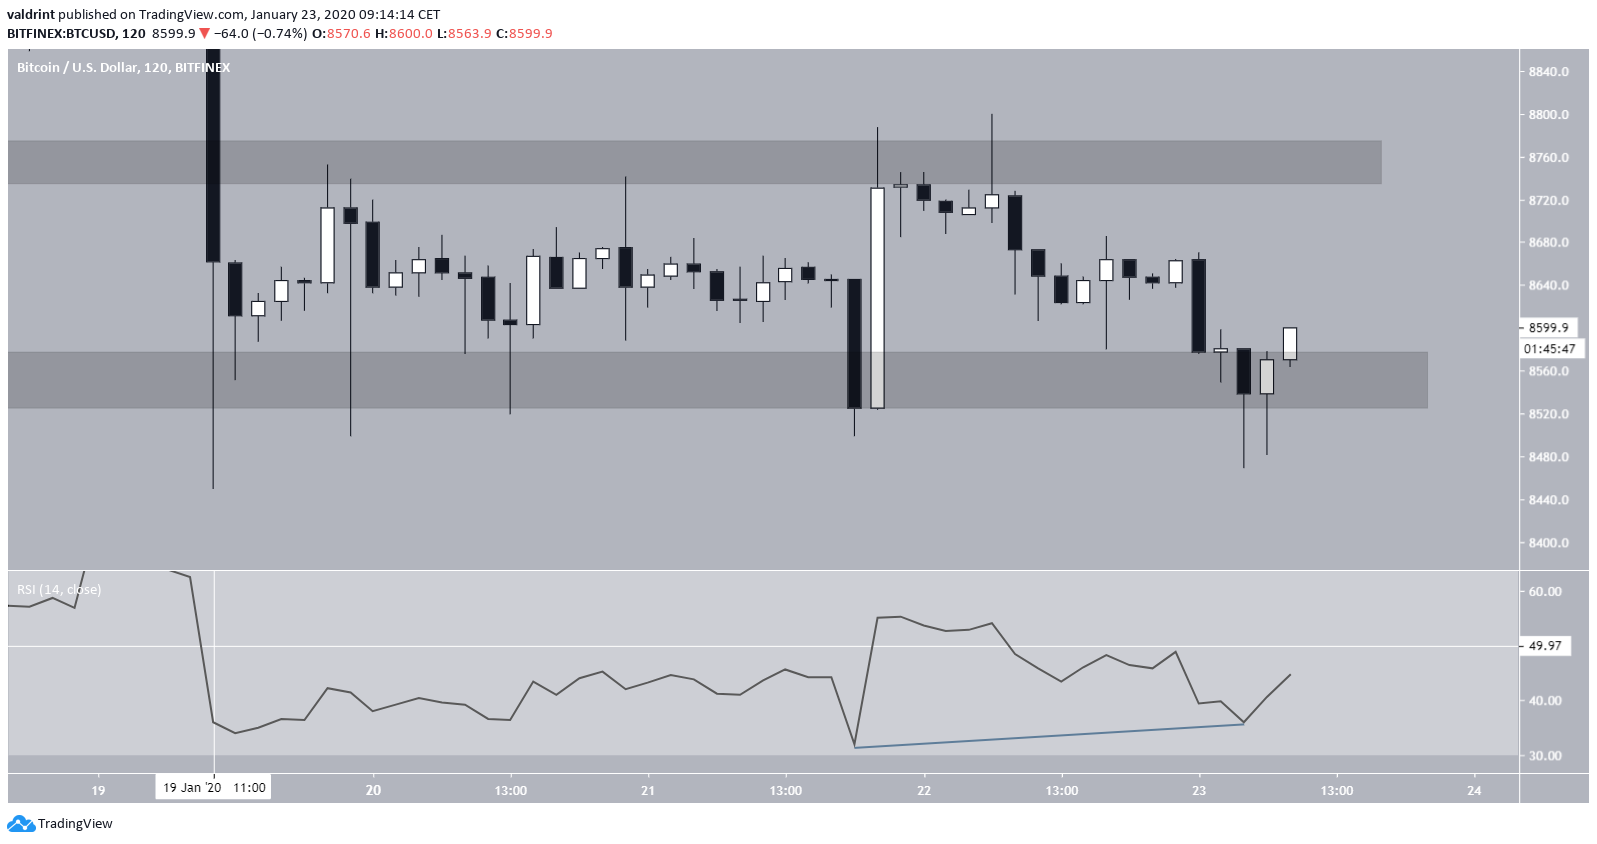
Since breaking down from the ascending wedge on January 19, the Bitcoin price has been trading inside a range between $8550-$8750. During this time, the price has made several overthrows — cases in which it has moved below/above the support/resistance of the range before quickly reversing in the other direction. At the time of writing, it had briefly moved below the support area before reversing and going in the other direction. It is in the process of creating a bullish hammer, which would be the first step in heading towards the range high. In addition, the price is trading between the 200- and 400-hour moving averages (MAs), which are roughly at the support and resistance areas. The RSI is tilting towards a price increase, but its movement has yet to confirm it. While there is some bullish divergence developing, the RSI has been trading below the 50 level since the breakdown on January 19.
In order to fully indicate that the price is heading upwards, the RSI needs to cross 50 and begin moving upward — confirming the strength of the rally.

Possible Weakness
The ascending wedge breakdown was preceded by bearish divergence in the 12-hour RSI. Afterward, the RSI did not make a failure swing top — rather, it created a descending triangle. Initially, it seemed as if the RSI would bounce at the support line and move towards resistance. However, it is in the process of decreasing below it and completing the failure swing top. Unless the short-term bullish divergence is sufficient in moving the price upwards within the next few hours, we think the price will break down and head towards $7800-$8000. Thus, the use of a stop loss below the support area would be recommended. To conclude, the Bitcoin price has been continuing to trade within the same range. Both a breakout and a breakdown remain possible, but we are slightly leaning towards a breakdown. The use of a stop loss below the support area would be recommended.
For our previous analysis, click here.
Disclaimer
In line with the Trust Project guidelines, this price analysis article is for informational purposes only and should not be considered financial or investment advice. BeInCrypto is committed to accurate, unbiased reporting, but market conditions are subject to change without notice. Always conduct your own research and consult with a professional before making any financial decisions. Please note that our Terms and Conditions, Privacy Policy, and Disclaimers have been updated.

Valdrin Tahiri
Valdrin discovered cryptocurrencies while he was getting his MSc in Financial Markets from the Barcelona School of Economics. Shortly after graduating, he began writing for several different cryptocurrency related websites as a freelancer before eventually taking on the role of BeInCrypto's Senior Analyst.
(I do not have a discord and will not contact you first there. Beware of scammers)
READ FULL BIO
Sponsored
Sponsored
![Bitcoin Analysis for 2020-01-23 [Premium Analysis]](https://beincrypto.com/wp-content/uploads/2019/12/bic_Bitcoin_Recession-Free_Decade.jpg.optimal.jpg)