


![Bitcoin Analysis for 2019-12-27 [Premium Analysis]](/_mfes/post/_next/image/?url=https%3A%2F%2Fassets.beincrypto.com%2Fimg%2FS-sq-d_YLHSPE--JSDzGshOlrh0%3D%2Fsmart%2Fe2e4c206aac0487a869d4d94909b5e7e&w=1920&q=75)
The Bitcoin price broke out from a descending channel and reached a high of $7250 before decreasing. It has created a head and shoulders pattern, a breakdown from which could take it to $6400.
Bitcoin Price Highlights
- The Bitcoin price broke out from a descending channel.
- It has possibly created a head and shoulders pattern.
- A breakdown from this pattern would take it to $6400.
- The price has failed to move above the previous breakdown level for the fifth time.
Previous Bitcoin Breakout
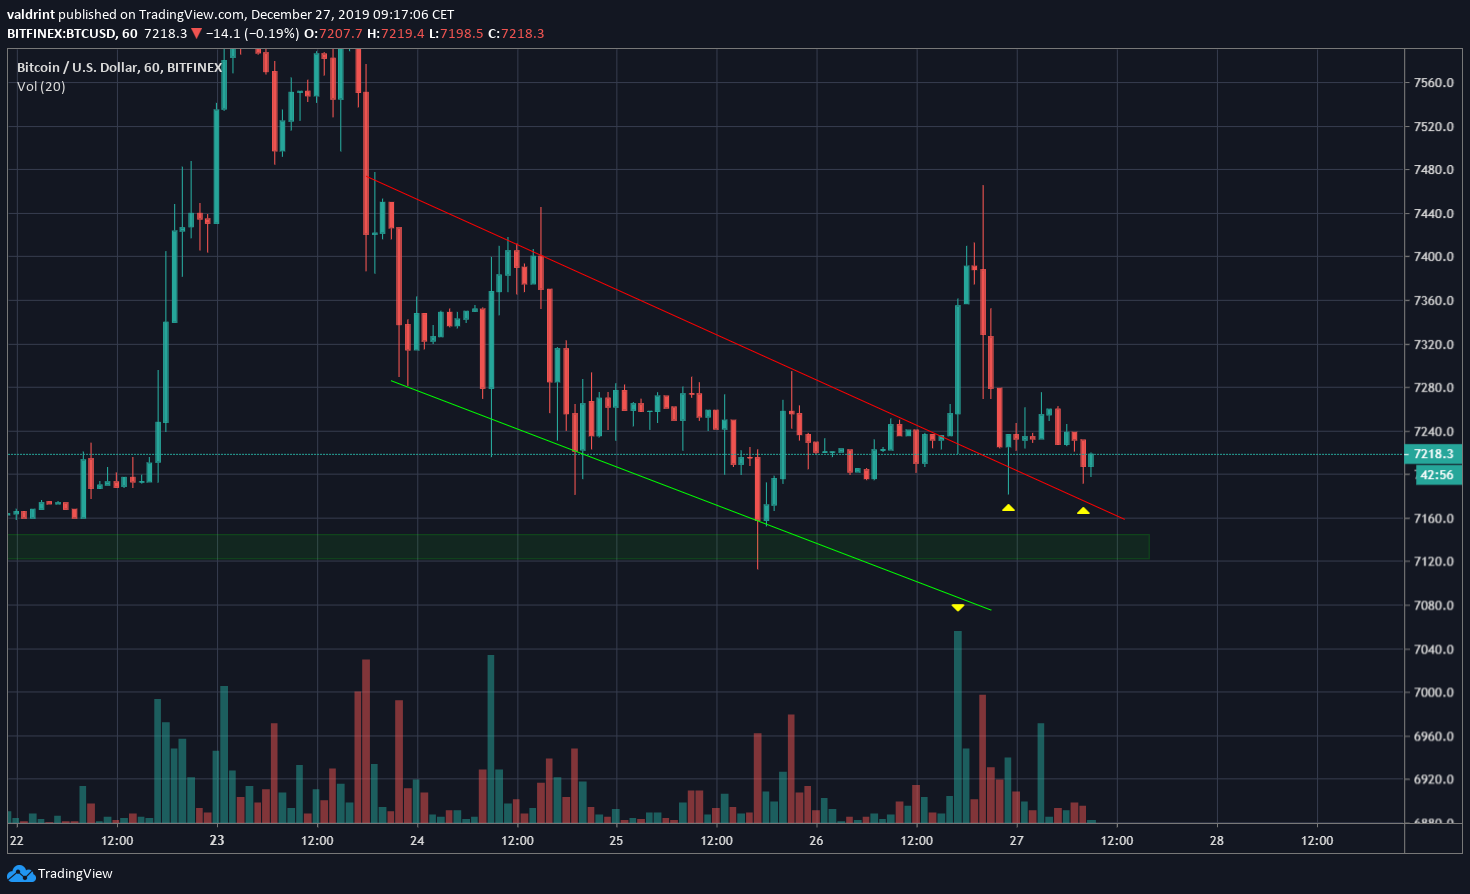
The Bitcoin price broke out from a descending channel yesterday. The breakout transpired with significant volume. Afterward, the BTC price returned to validate the previous resistance line.
While the price has made a double bottom near $7200, combined with long lower wicks, there is no bullish divergence to suggest that the price will move upward.
There is a minor support area near $7150.
Head and Shoulders
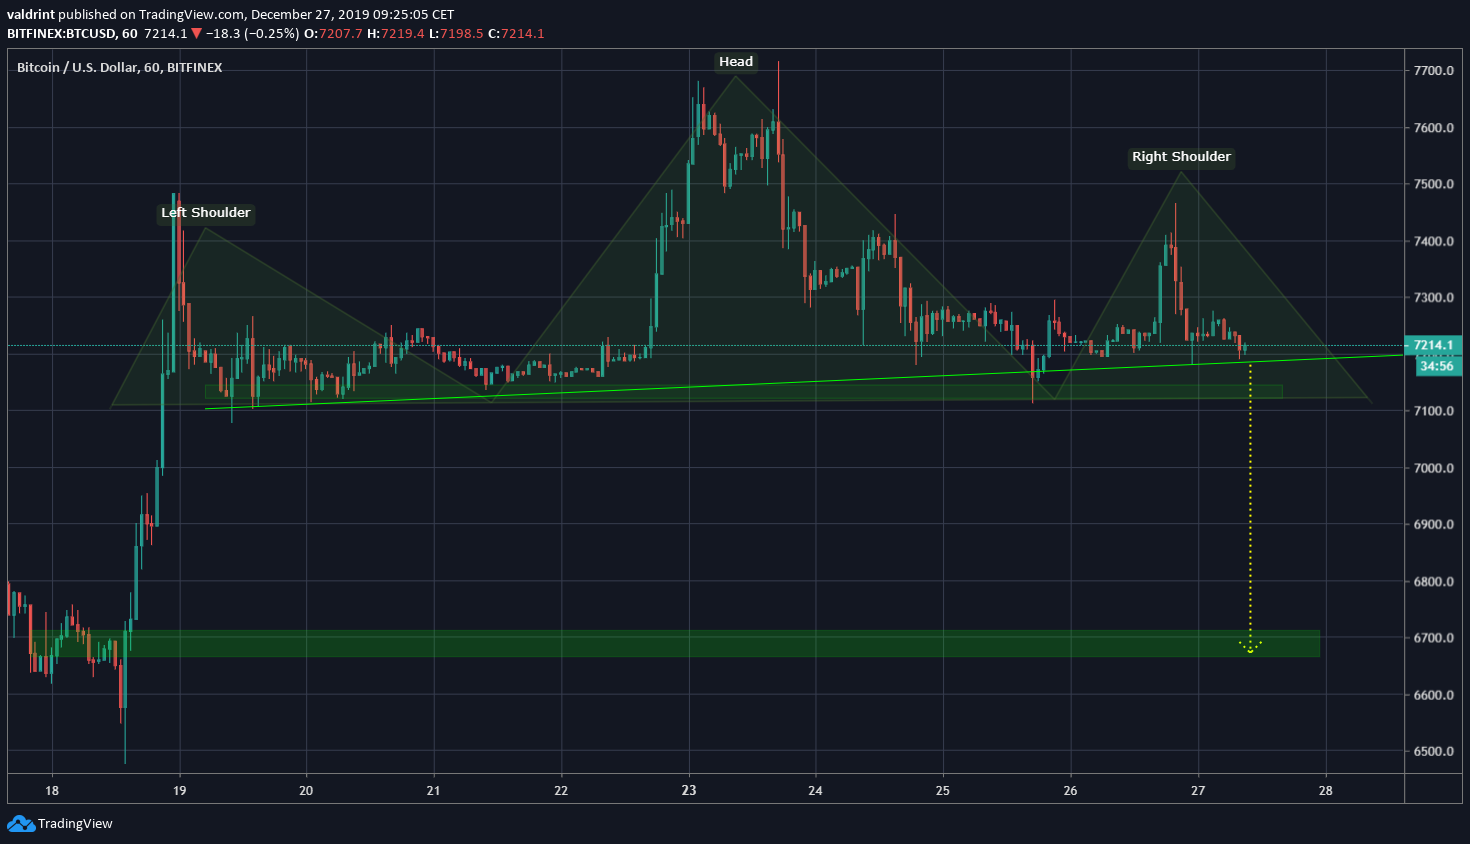
The Bitcoin price seems to be following a longer-term bearish pattern.
It has likely created a head and shoulder pattern, with an ascending neckline. A breakdown from this pattern that travels its full height would likely take the price to $6700, inside a support area. This makes sense since there is a lack of support below $7000, due to the rapid rate of the previous price increase.
Longer-Term
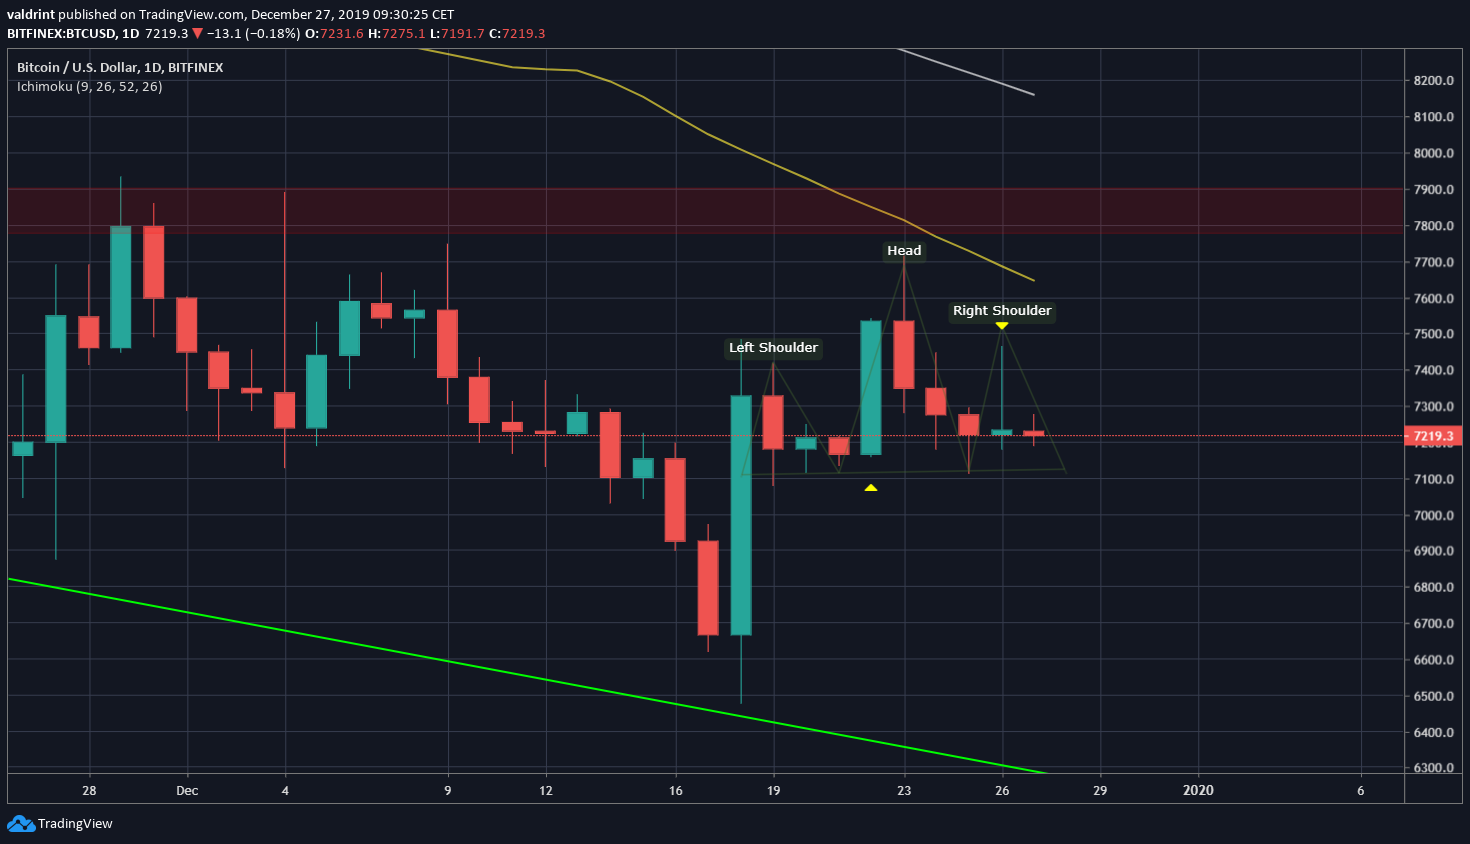
Looking at this H&S in the daily time-frame, we can see the strong resistance above the current price, both in the form of previous resistance and current moving averages (MAs).
Also, the possible three-day pattern outlined in yesterday’s analysis has been invalidated — since, instead of creating a bullish engulfing candlestick, the Bitcoin price created a doji with a long upper wick.
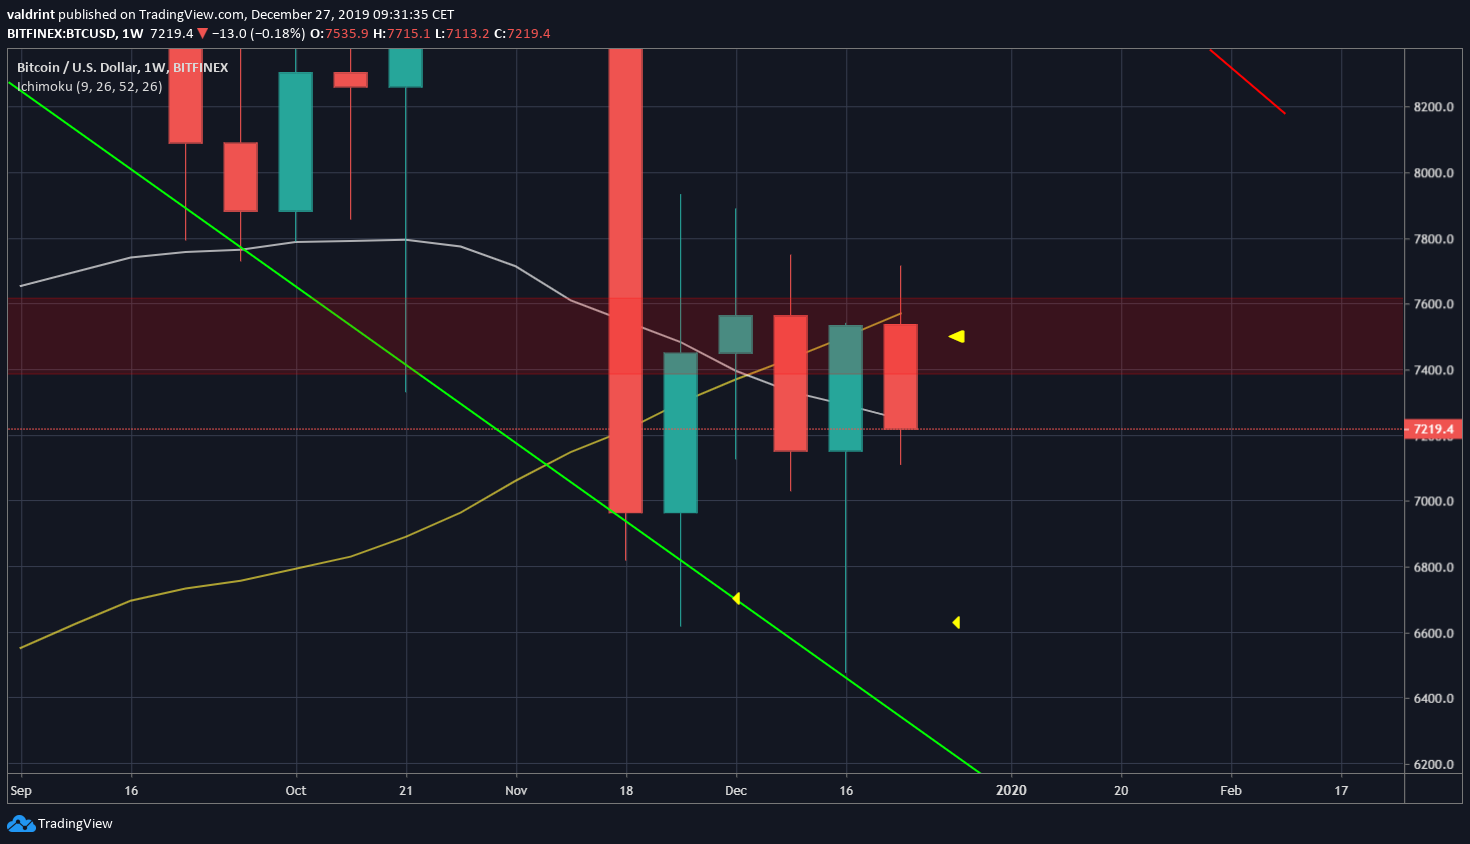
The weekly outlook gives a similar view. The Bitcoin price has failed to move above the previous resistance level for the fifth time.
Currently, it has fallen back below the 50- and 100-week MAs. The breakdown from the H&S would take it to the previous wick lows and near the descending support line.
To conclude, the Bitcoin price has created a head and shoulders pattern. A breakdown from this pattern would take the price near $6400.
Good luck and happy trading! For our previous analysis, click here.


