


![Bitcoin Analysis for 2019-11-15 [Premium]](/_mfes/post/_next/image/?url=https%3A%2F%2Fassets.beincrypto.com%2Fimg%2FpIeMrHTRKKO5U83DqdYtqg6Wfz8%3D%2Fsmart%2F4944476efd004165bdb0640b58da639d&w=1920&q=75)
The Bitcoin price is trading near the end of a descending wedge. Due to the strong bullish divergence and a confluence of support, it has likely begun an upward move which will eventually lead to a breakout.
Bitcoin Price Highlights
- The Bitcoin price is trading inside a descending wedge.
- The 100- and 200-day moving averages (MA) have almost made a bearish cross.
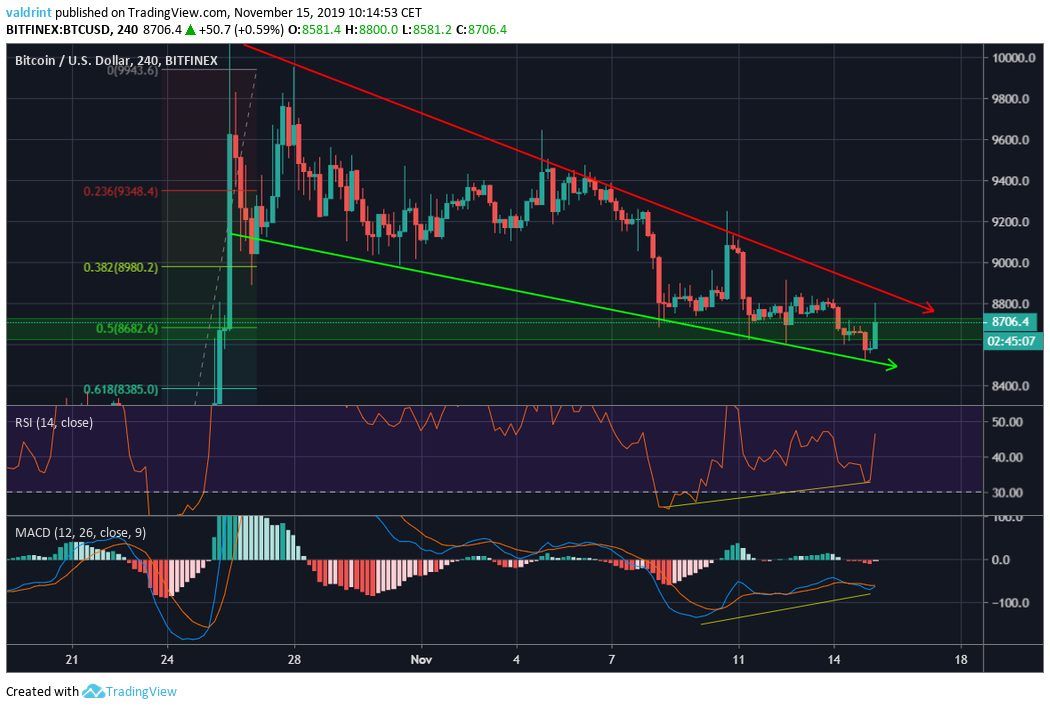
- There is a strong bullish divergence in both the RSI & MACD.
- There is resistance at $9100 and $9500.
Descending Resistance Line
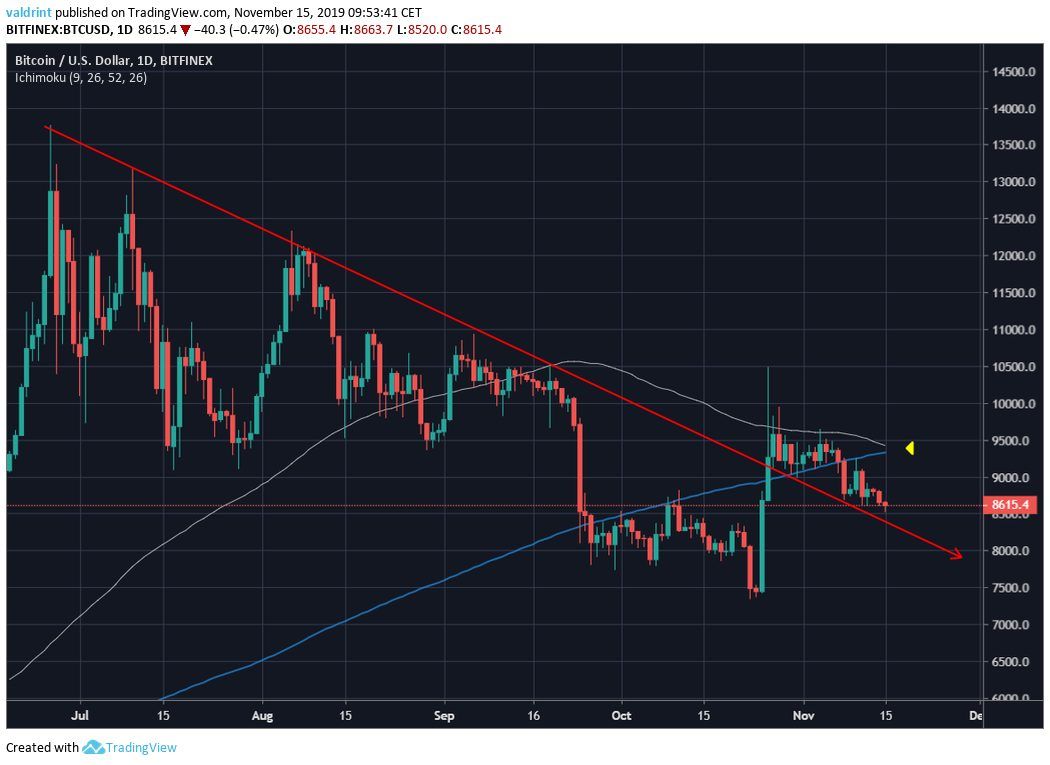
Looking at the daily time-frame, we can see that the Bitcoin price is still respecting the descending resistance line out of which it broke out from October 25.
It has validated it several times as support. Since the resistance line is descending, the Bitcoin price is making lower lows.
However, the 100- and 200-day MAs have almost made a bearish cross. A rapid upward movement would be needed for this cross to be rejected and the MAs to move upward.
Descending Wedge
In the short-term, the Bitcoin price has been trading inside a descending wedge since the October 25 move.
It reached the 0.5 Fib level of the entire upward move and the $8600 support area, before barely breaking down. However, the breakdown levels could not be sustained and the Bitcoin price has begun an upward move.
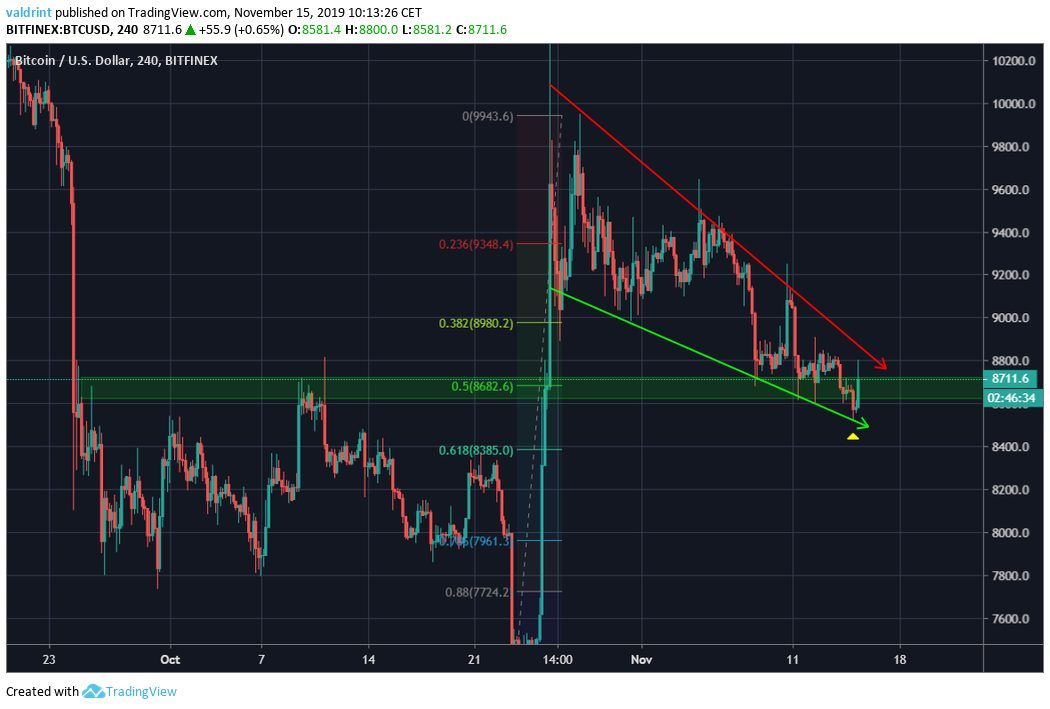
Looking closer at the movement, the Bitcoin price has created a morning star pattern, following a doji with a bullish engulfing candle. Usually, whenever a support level fails and the lower price cannot be sustained, it often has major bullish implications.
Finally, there is a strong bullish divergence in the RSI and the MACD. This makes us believe that the Bitcoin price will soon break out.
Future Movement
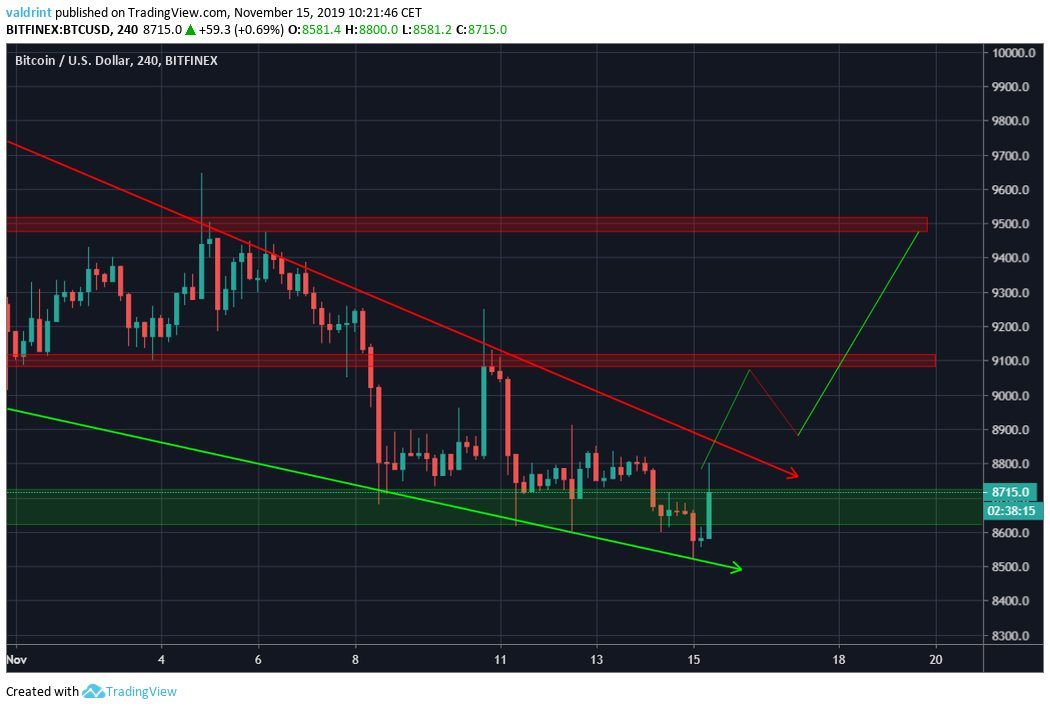
There are two resistance areas outlined, at $9100 and $9500.
After the breakout, we are expecting the Bitcoin price to eventually do a movement similar to that outlined — in which it breaks out towards the first resistance area, retraces and then resumes its upward movement towards the second resistance area.
For our previous analysis, click here.
Disclaimer: This article is not trading advice and should not be construed as such. Always consult a trained financial professional before investing in cryptocurrencies, as the market is particularly volatile.
Did you know you can trade sign-up to trade Bitcoin and many leading altcoins with a multiplier of up to 100x on a safe and secure exchange with the lowest fees — with only an email address? Well, now you do! Click here to get started on StormGain!


