


At BeInCrypto, we publish regular price analyses and predictions for the most relevant and popular cryptocurrencies and digital assets. For our most recent prediction of BNB, keep reading below — or, if you’re interested in an exchange that does not lie about trading volume, check out our Binance exchange review here.
The Binance Coin price (BNB) recently broke its all-time high, reaching a price of $36.01 on May 27. A decrease ensued. On June 5, the price reached a low of $28.52. It has been increasing since.
On June 12, the BNB price reached highs above $34.
Will the Binance Coin price (BNB) reach yet another all-time high? Keep reading in order to find out.
(Click here for our previous analysis.)
Binance Coin Price (BNB): Trends and Highlights for June 12, 2019
- The Binance Coin price (BNB) has been on an uptrend since June 5.
- It broke out from an ascending triangle.
- It is following a longer-term ascending support line.
- There is bearish divergence developing in the RSI.
- The 10- and 20-day moving averages has made a bearish cross.
- There is resistance near $47.
Previous Movement
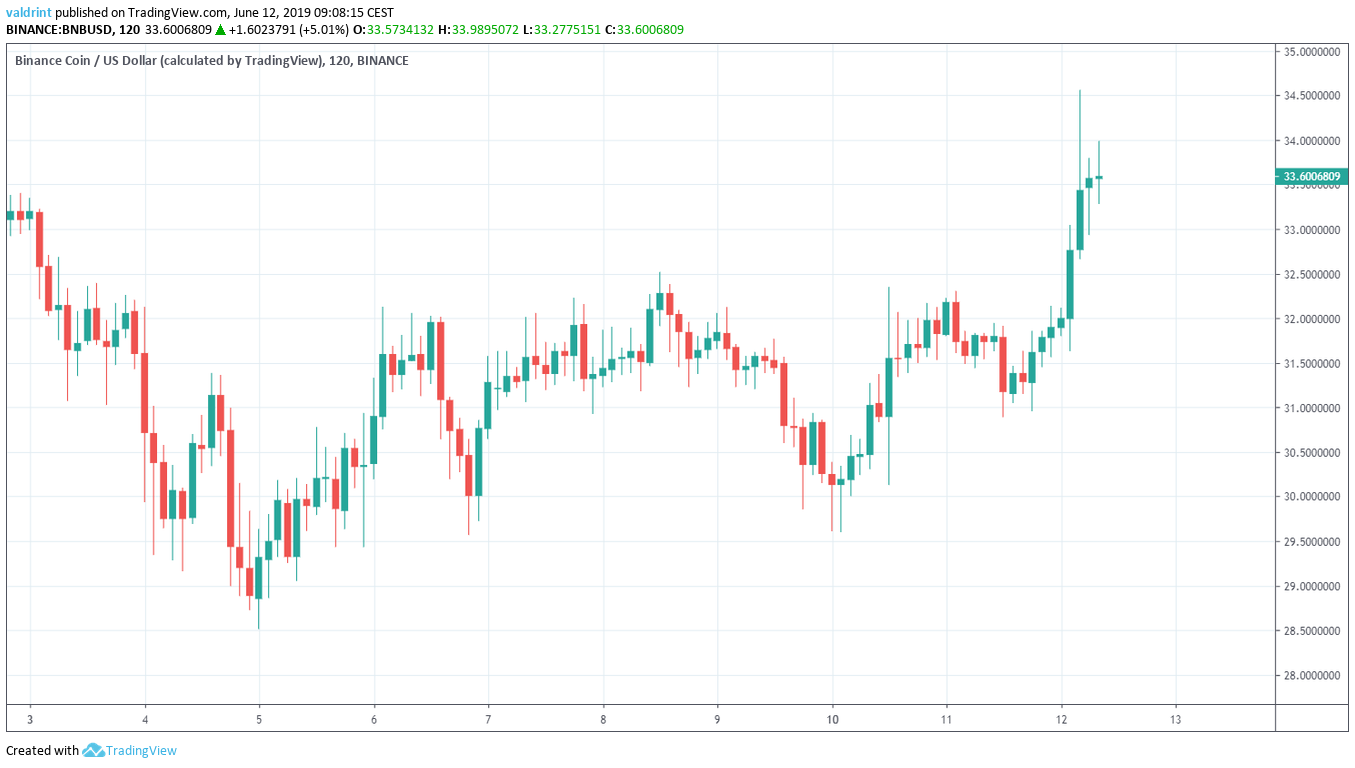
On June 5, BNB/USD reached a low of $28.51. A gradual upward move ensued. The price reached highs of $32.12 the next day.
Since then, the Binance Coin price (BNB) has been trading inside the ascending triangle outlined below:
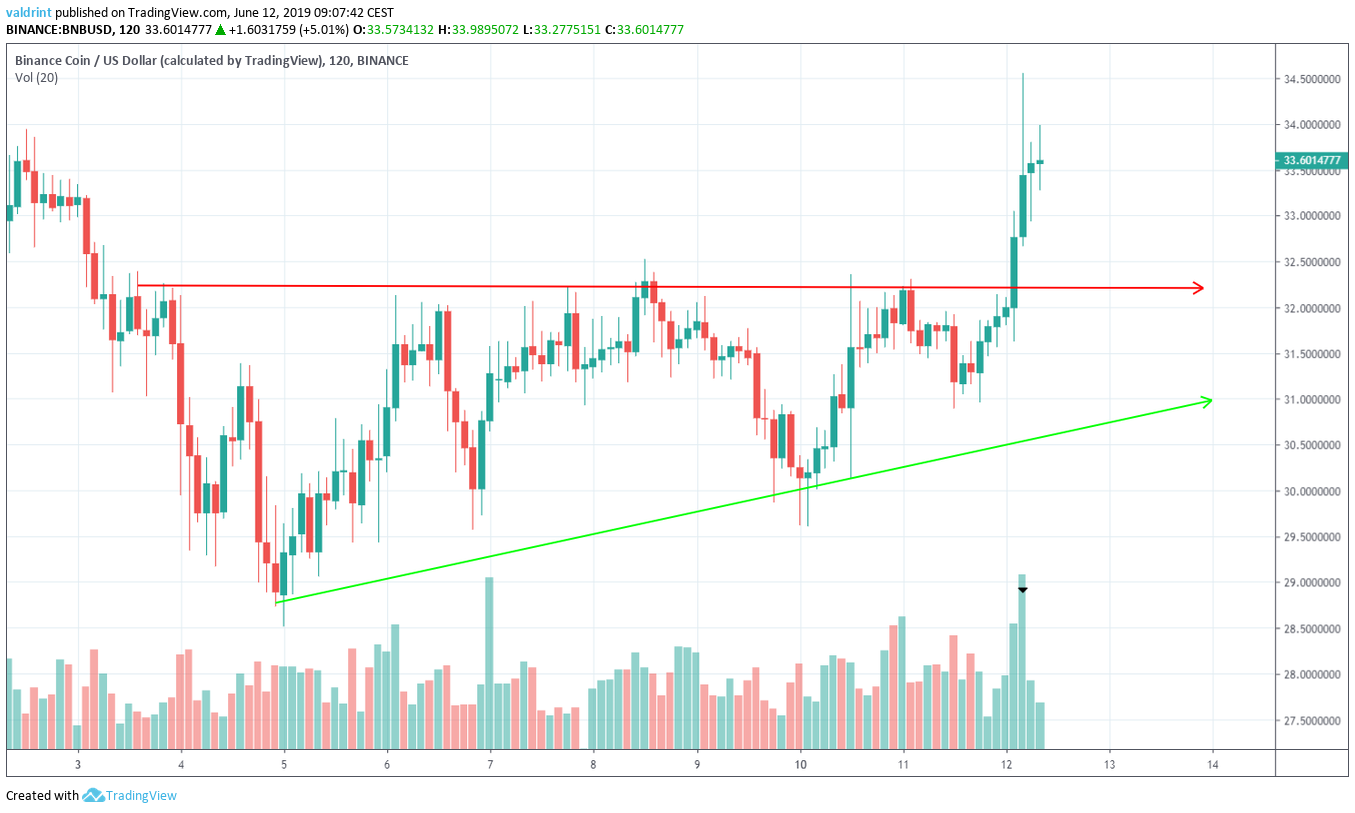
On June 12, the BNB price began an upward move and broke out from the triangle.
The breakout occurred with slightly above average volume, somewhat reducing its validity.
In a slightly longer time-frame, the price is following an ascending support line.
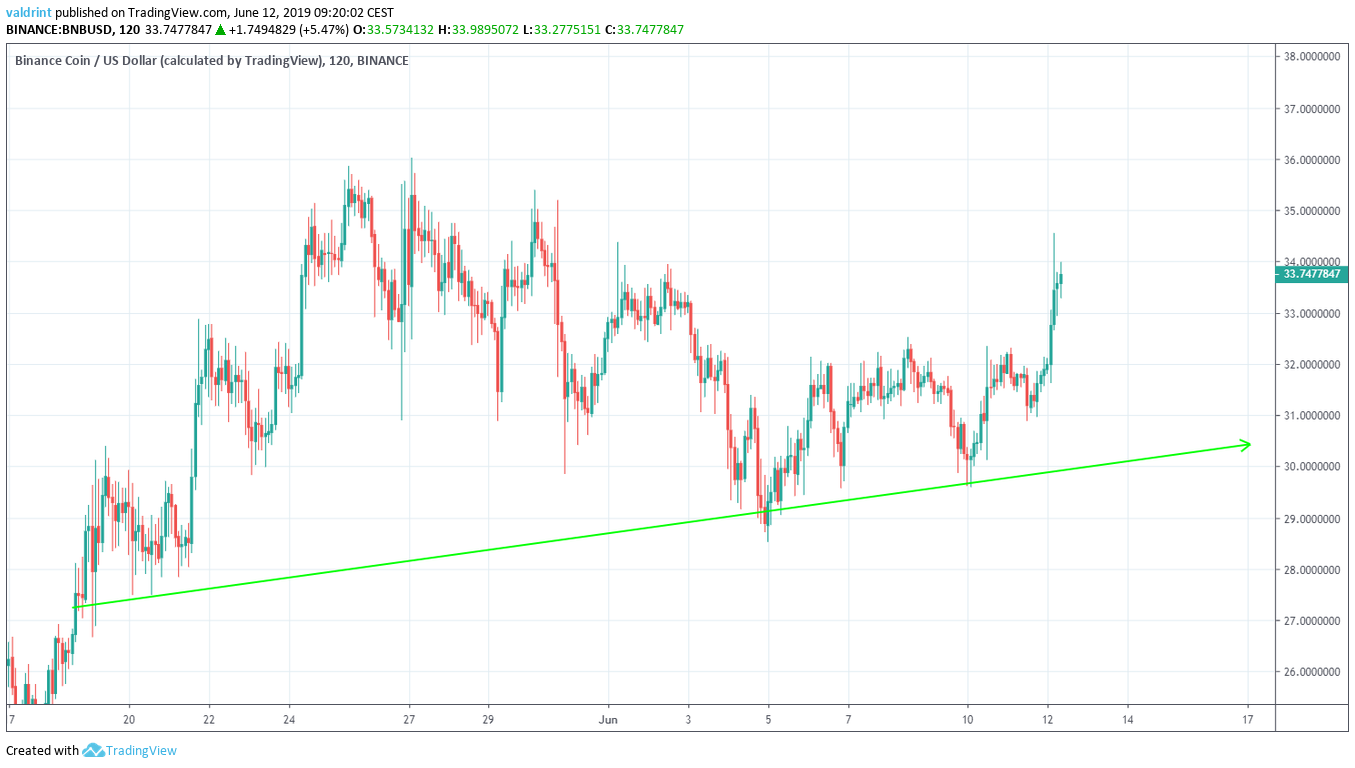
The support line began on May 18 and coincides with the support line of the ascending triangle.
After bouncing from it on June 10, the BNB price began an upward move.
How high will it go?
We will look at technical indicators in a longer time-frame in order to try and answer this question.
BNB Price: Bearish Divergence in an Ascending Wedge
The Binance Coin price (BNB) is analyzed at three-day intervals alongside the RSI below:
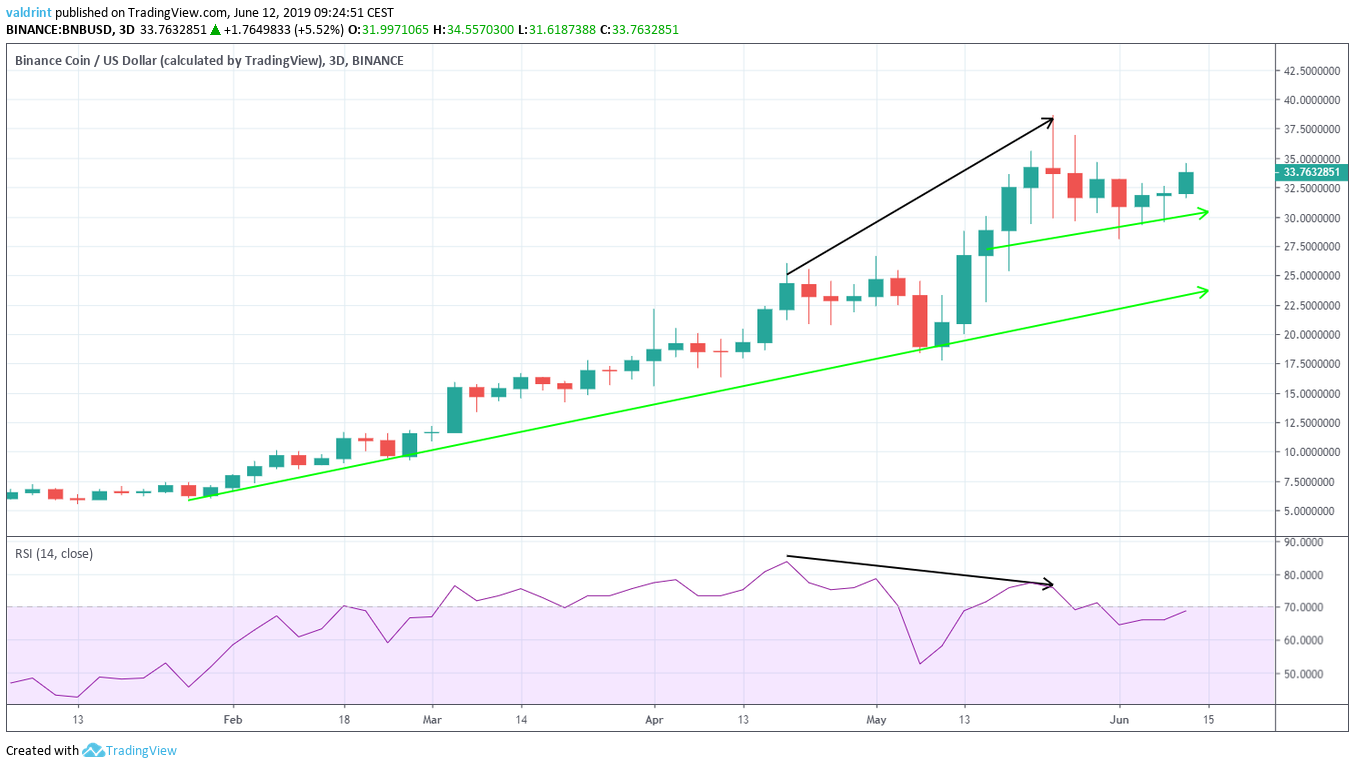
Since Jan 2019, the Binance Coin price has been following a long-term ascending support line.
The RSI reached a high in the middle of April and has been generating lower values since. This is in stark contrast to the Binance Coin price (BNB), which has enjoyed significant increases during the same period. This is known as bearish divergence and often precedes price decreases. Furthermore, it is occurring in a long-term time-frame.
In our previous analysis, we stated that :
The three-day candle in which the all-time high price was reached was a bearish doji. It was followed by another bearish candle with a slightly longer body. While these can be the signs of the beginning of the reversal, we do not have confirmation yet. A candle close below $29 would give us confirmation that a reversal is underway.
Since then, the BNB price has reached values below $29. However, we have not yet had a close below $29. Therefore, despite the divergence, it is possible that the price will continue to increase and reach a higher high.
Furthermore, the moving averages (MA) also give conflicting signs.

On June 7, the 10-day MA crossed below the 20-day one. This is known as a bearish cross and often indicates that a downtrend has begun. However, the recent upward move took the BNB price above both MAs. This reduces the validity of the cross.
These indicators give mixed opinions. Therefore, we can conclude that the market is undecided, and more information is needed for us to make a confident prediction on where the price will go.
However, possible resistance and support areas are outlined below.
Reversal Areas
One resistance area is traced for the BNB price in the graph below:
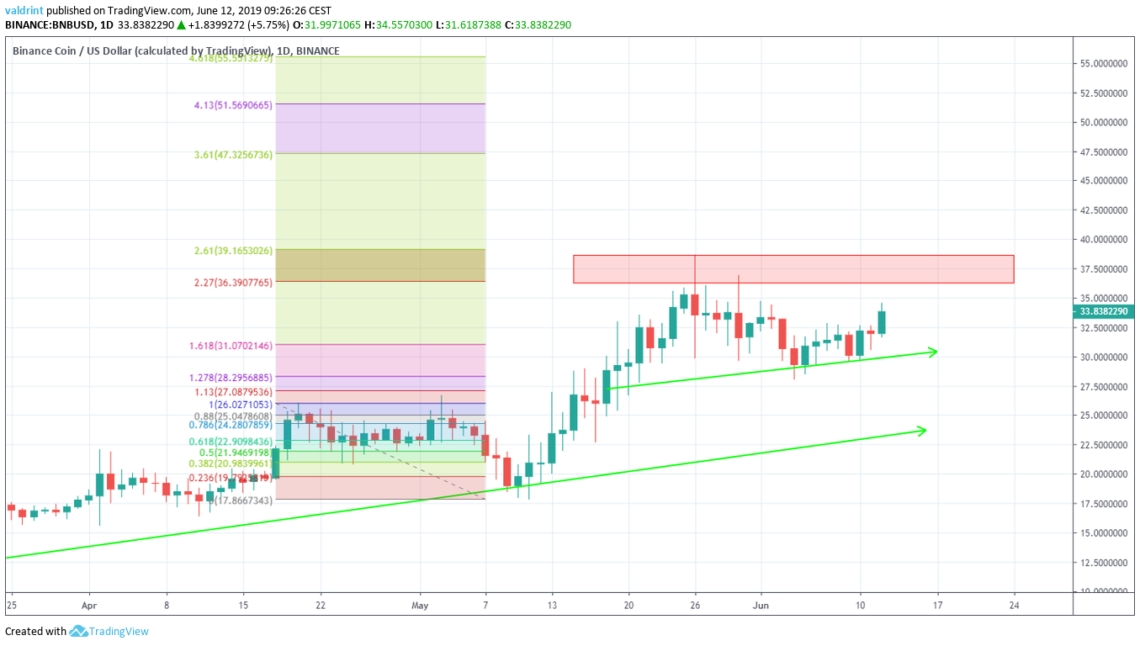
The closest resistance area is found near $37. However, this area coincides with the all-time high price. Therefore, it is the last area of resistance. To predict where the BNB price will go if it moves above this area, a fib retracement is used in the downward move from Apr 19 to May 10. The closest resistance area is found by the 3.61 fib ratio which is close to $47.
The closest support area is found by the ascending support line, which is currently near $25.
Summary
BNB is following an ascending support line. It is currently close to reaching another all-time high price. There is bearish divergence developing in the RSI.
Do you think the Binance Coin price (BNB) will reach another all-time high? Let us know your thoughts in the comments below.
Disclaimer: This article is not trading advice and should not be construed as such. Always consult a trained financial professional before investing in cryptocurrencies, as the market is particularly volatile.


