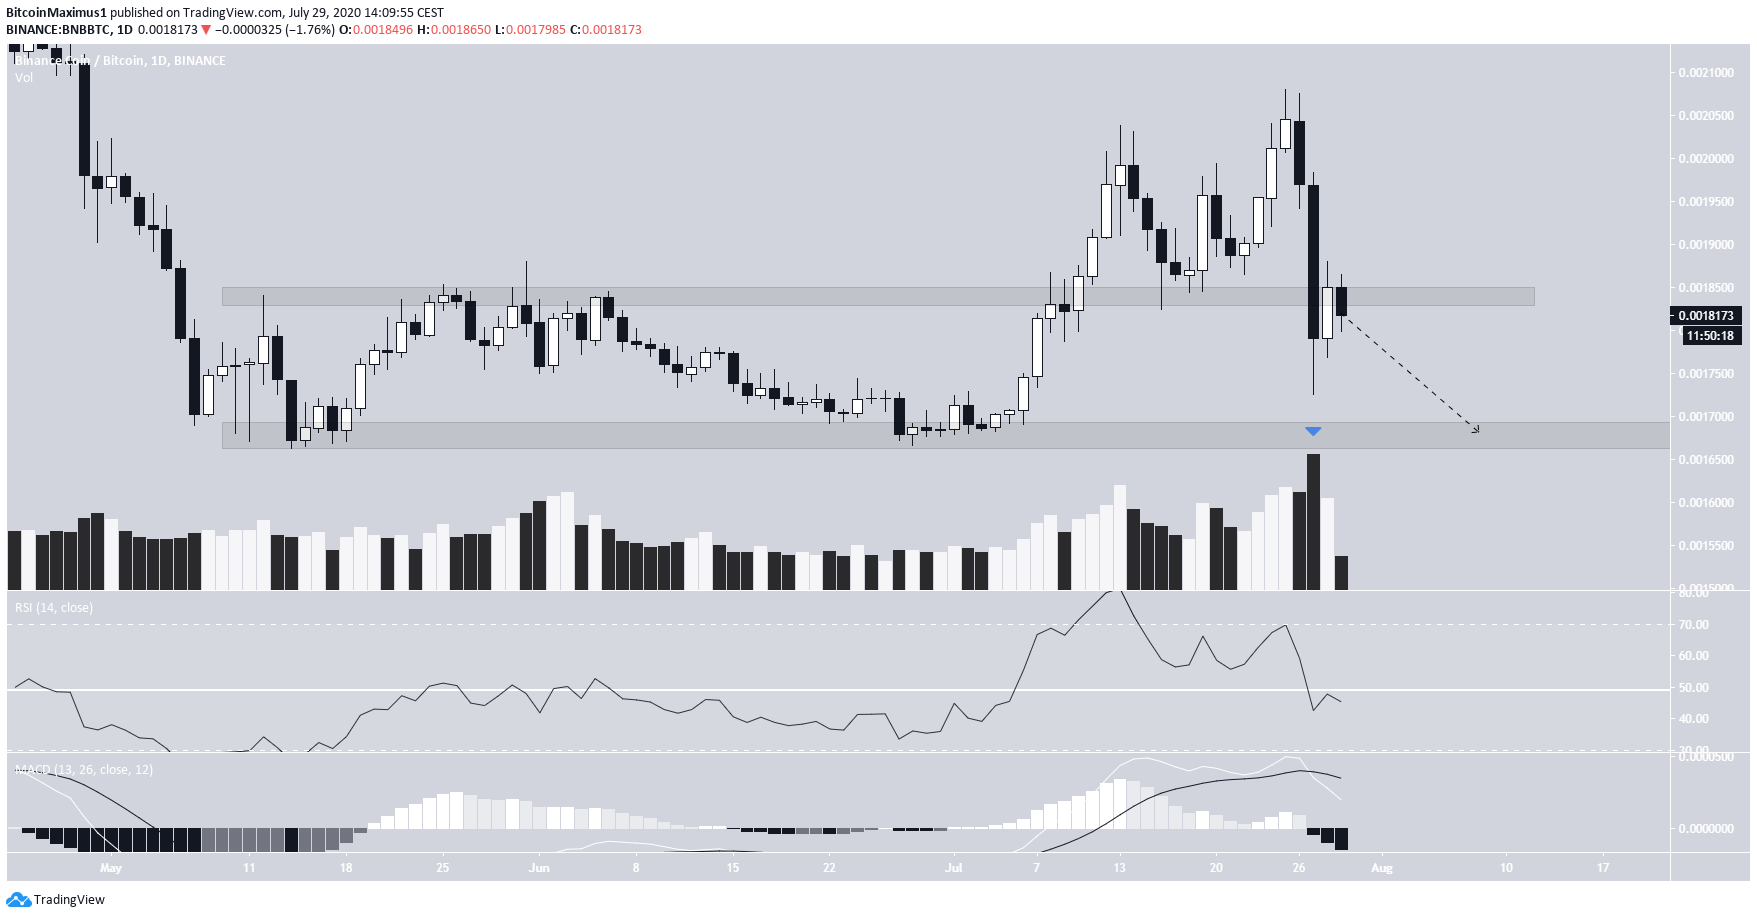
At the beginning of July, Binance Coin (BNB) broke out above a long-term resistance area, signifying that it had begun an upward movement.
However, the price fell back below the breakout level on July 27 and is currently back inside its previous range.
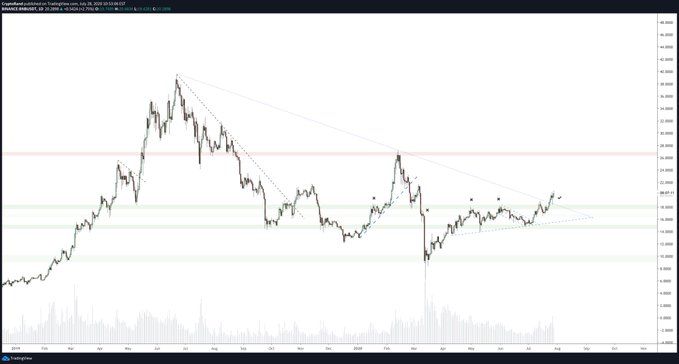
Long-Term Consolidation
Since the beginning of May, the BNB price has been mostly trading between the ₿0.00168 and ₿0.00184 levels. The price broke out at the beginning of July, continuing to increase after validating the breakout level as support.
BNB fell back inside the previous range on July 27 and has seemingly validated the ₿0.00184 level as resistance once more. The breakdown transpired with significant volume, increasing its legitimacy.
In addition, the daily RSI has crossed below 50, and the MACD has made a bearish cross while momentum has turned negative.
Therefore, it would be expected for the BNB price to fall back to the previous long-term support area at ₿0.00168.
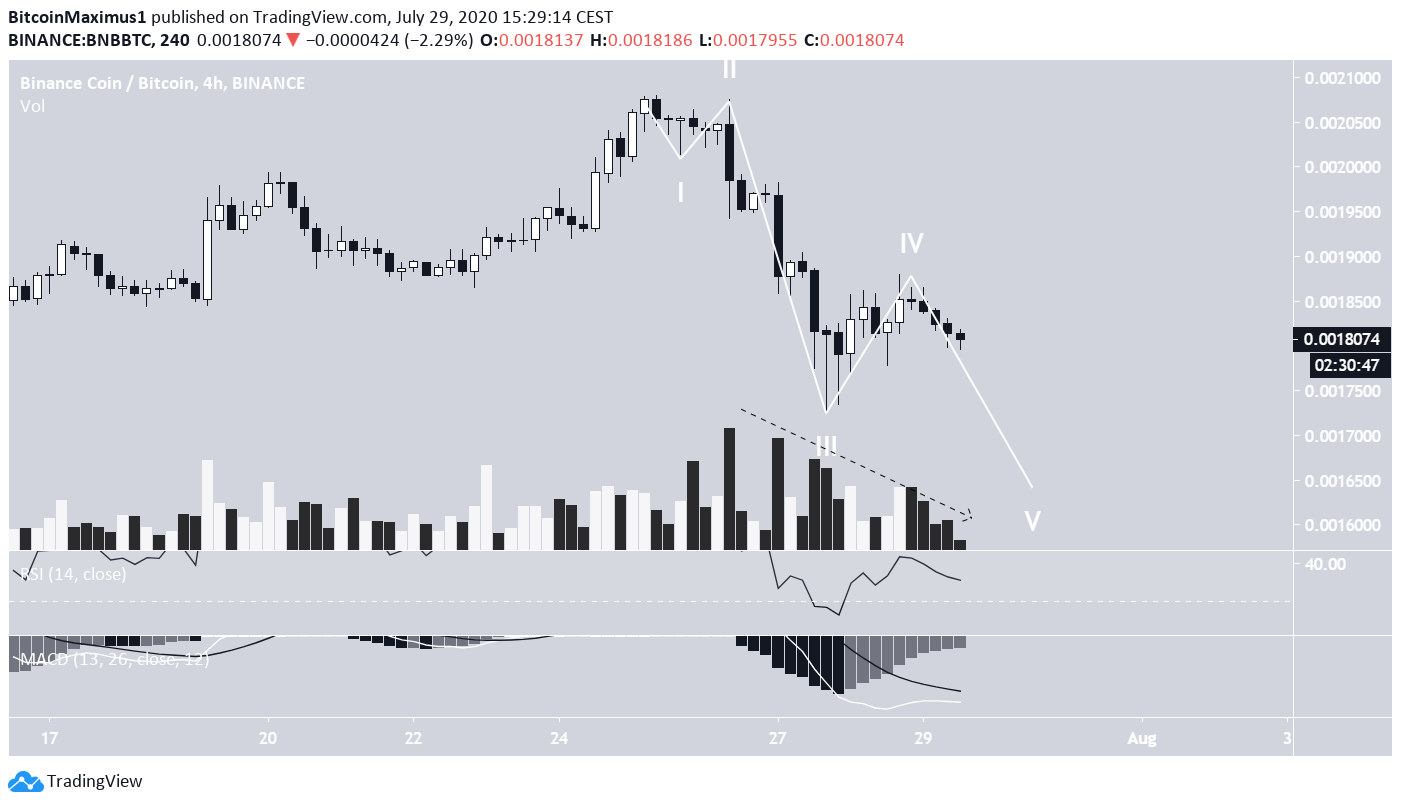
The decrease is supported by Elliot Wave theory since the price is seemingly finishing a five-wave downward impulse with an extended third wave. The final wave would be expected to end at the previously outlined support area.
Technical indicators support this possibility since volume has been decreasing while prices head lower. The MACD and the RSI are in the process of generating a bullish divergence inside the oversold territory.
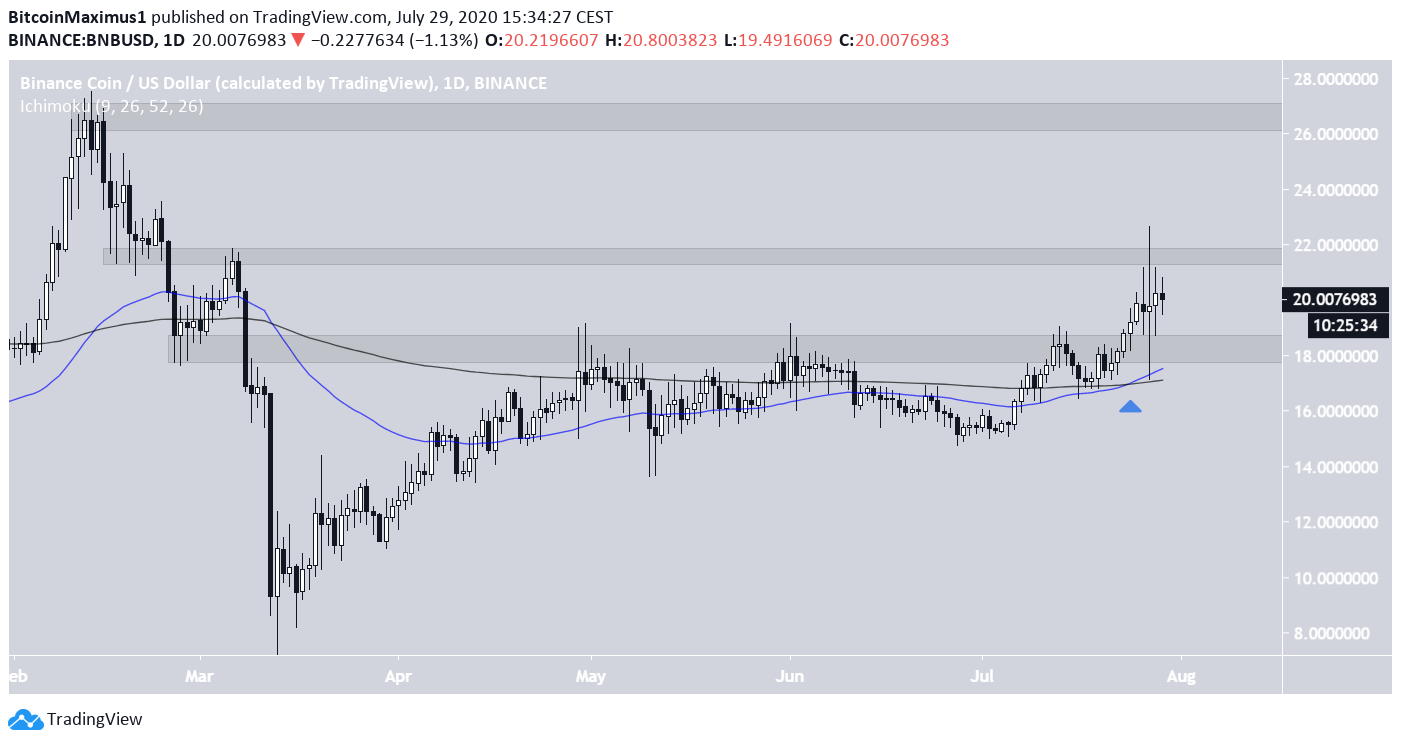
BNB/USD
Cryptocurrency trader @Crypto_Rand outlined a BNB chart, stating that the price has broken out from an important resistance level and will likely continue moving upwards.
The price movement for BNB/USD is very dissimilar to the BTC pair. The price has broken out from the $18 area, which had acted as resistance since March. Afterward, the price validated it as support in the form of a long lower-wick before moving upwards.
The 50 and 200-day moving averages (MA) have made a bullish cross and are both offering support to the price.
The closest minor resistance area is found at $21.50, having rejected the price once. A more significant resistance near $27.